School Accountability Report Card (SARC) - Paramount Unified ...
School Accountability Report Card (SARC) - Paramount Unified ...
School Accountability Report Card (SARC) - Paramount Unified ...

You also want an ePaper? Increase the reach of your titles
YUMPU automatically turns print PDFs into web optimized ePapers that Google loves.
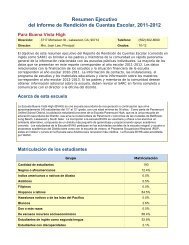
<strong>School</strong> <strong>Accountability</strong> <strong>Report</strong> <strong>Card</strong> (<strong>SARC</strong>)<br />
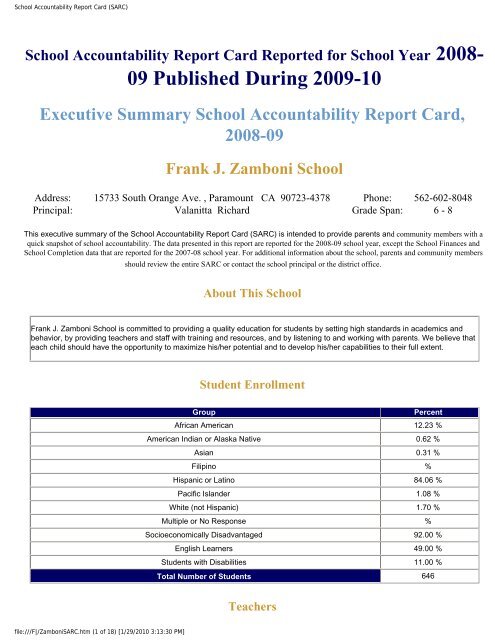
<strong>School</strong> <strong>Accountability</strong> <strong>Report</strong> <strong>Card</strong> <strong>Report</strong>ed for <strong>School</strong> Year 2008-<br />
09 Published During 2009-10<br />
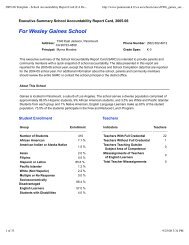
Executive Summary <strong>School</strong> <strong>Accountability</strong> <strong>Report</strong> <strong>Card</strong>,<br />
2008-09<br />
Frank J. Zamboni <strong>School</strong><br />
Address: 15733 South Orange Ave. , <strong>Paramount</strong> CA 90723-4378 Phone: 562-602-8048<br />
Principal: Valanitta Richard Grade Span: 6 - 8<br />
This executive summary of the <strong>School</strong> <strong>Accountability</strong> <strong>Report</strong> <strong>Card</strong> (<strong>SARC</strong>) is intended to provide parents and community members with a<br />
quick snapshot of school accountability. The data presented in this report are reported for the 2008-09 school year, except the <strong>School</strong> Finances and<br />
<strong>School</strong> Completion data that are reported for the 2007-08 school year. For additional information about the school, parents and community members<br />
should review the entire <strong>SARC</strong> or contact the school principal or the district office.<br />
About This <strong>School</strong><br />
Frank J. Zamboni <strong>School</strong> is committed to providing a quality education for students by setting high standards in academics and<br />
behavior, by providing teachers and staff with training and resources, and by listening to and working with parents. We believe that<br />
each child should have the opportunity to maximize his/her potential and to develop his/her capabilities to their full extent.<br />
Student Enrollment<br />
Group<br />
Percent<br />
African American 12.23 %<br />
American Indian or Alaska Native 0.62 %<br />
Asian 0.31 %<br />
Filipino %<br />
Hispanic or Latino 84.06 %<br />
Pacific Islander 1.08 %<br />
White (not Hispanic) 1.70 %<br />
Multiple or No Response %<br />
Socioeconomically Disadvantaged 92.00 %<br />
English Learners 49.00 %<br />
Students with Disabilities 11.00 %<br />
Total Number of Students 646<br />
Teachers<br />
file:///F|/Zamboni<strong>SARC</strong>.htm (1 of 18) [1/29/2010 3:13:30 PM]
<strong>School</strong> <strong>Accountability</strong> <strong>Report</strong> <strong>Card</strong> (<strong>SARC</strong>)<br />
Indicator<br />
Teachers<br />
Teachers with full credential 32<br />
Teachers without full credential 1<br />
Teachers Teaching Outside Subject Area of Competence 1<br />
Misassignments of Teachers of English Learners 1<br />
Total Teacher Misassignments 1<br />
Student Performance<br />
Subject<br />
Students Proficient and Above on California Standards Tests<br />
English-Language Arts 44%<br />
Mathematics 52%<br />
Science 34%<br />
History-Social Science 21%<br />
Academic Progress<br />
Indicator<br />
Result<br />
2009 Growth API Score (from 2009 Growth API <strong>Report</strong>) 753<br />
Statewide Rank (from 2008 Base API <strong>Report</strong>) 3<br />
2009-10 Program Improvement Status (PI Year) Not in PI<br />
<strong>School</strong> Facilities<br />
Summary of Most Recent Site Inspection<br />
Inspection date: November 20, 2008<br />
No problems identified<br />
Repairs Needed<br />
Corrective Actions Taken or Planned<br />
Curriculum and Instructional Materials<br />
file:///F|/Zamboni<strong>SARC</strong>.htm (2 of 18) [1/29/2010 3:13:30 PM]
<strong>School</strong> <strong>Accountability</strong> <strong>Report</strong> <strong>Card</strong> (<strong>SARC</strong>)<br />
Core Curriculum Areas<br />
Reading/Language Arts<br />
Mathematics<br />
Science<br />
History-Social Science<br />
Foreign Language<br />
Health<br />
Visual and Performing Arts<br />
Science Laboratory Equipment (grades 9-12)<br />
Pupils Who Lack Textbooks and Instructional Materials<br />
0%<br />
0%<br />
0%<br />
0%<br />
0%<br />
0%<br />
0%<br />
0%<br />
<strong>School</strong> Finances<br />
Level<br />
Expenditures Per Pupil (Unrestricted Sources Only)<br />
<strong>School</strong> Site $ 3,200.00<br />
District $ 3,092.00<br />
State $5,512.00<br />
NAEP Reading, Grade 4<br />
Level<br />
Result<br />
Average Scale Score - State 209<br />
Average Scale Score - National 220<br />
Achievement Level - Basic 30%<br />
Achievement Level - Proficient 18%<br />
Achievement Level - Advanced 5%<br />
NAEP Reading, Grade 8<br />
Level<br />
Result<br />
Average Scale Score - State 251<br />
Average Scale Score - National 261<br />
Achievement Level - Basic 41%<br />
Achievement Level - Proficient 20%<br />
Achievement Level - Advanced 2%<br />
NAEP Mathematics, Grade 4<br />
file:///F|/Zamboni<strong>SARC</strong>.htm (3 of 18) [1/29/2010 3:13:30 PM]
<strong>School</strong> <strong>Accountability</strong> <strong>Report</strong> <strong>Card</strong> (<strong>SARC</strong>)<br />
Level<br />
Result<br />
Average Scale Score - State 232<br />
Average Scale Score - National 239<br />
Achievement Level - Basic 72%<br />
Achievement Level - Proficient 30%<br />
Achievement Level - Advanced 5%<br />
NAEP Mathematics, Grade 8<br />
Level<br />
Result<br />
Average Scale Score - State 270<br />
Average Scale Score - National 282<br />
Achievement Level - Basic 59%<br />
Achievement Level - Proficient 23%<br />
Achievement Level - Advanced 5%<br />
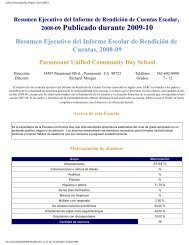
<strong>School</strong> <strong>Accountability</strong> <strong>Report</strong> <strong>Card</strong> <strong>Report</strong>ed for <strong>School</strong> Year 2008-09 Published<br />
During 2009-10<br />
The <strong>School</strong> <strong>Accountability</strong> <strong>Report</strong> <strong>Card</strong> (<strong>SARC</strong>), which is required by law to be published annually, contains information about the condition and<br />
performance of each California public school. More information about <strong>SARC</strong> requirements is available on the California Department of Education<br />
(CDE) <strong>SARC</strong> Web page. For additional information about the school, parents and community members should contact the school principal or the<br />
district office.<br />
I. Data and Access<br />
DataQuest<br />
DataQuest is an online data tool located on the CDE DataQuest Web page that contains additional information about this school and comparisons of<br />
the school to the district, the county, and the state. Specifically, DataQuest is a dynamic system that provides reports for accountability (e.g.,<br />
Academic Performance Index [API], Adequate Yearly Progress [AYP]), test data, enrollment, graduates, dropouts, course enrollments, staffing, and<br />
data regarding English learners).<br />
Internet Access<br />
Internet access is available at public libraries and other locations that are publicly accessible (e.g., the California State Library). Access to the Internet<br />
at libraries and public locations is generally provided on a first-come, first-served basis. Other use restrictions include the hours of operation, the<br />
length of time that a workstation may be used (depending on availability), the types of software programs available on a workstation, and the ability to<br />
print documents.<br />
II. About This <strong>School</strong><br />
Contact Information (<strong>School</strong> Year 2009-10)<br />
file:///F|/Zamboni<strong>SARC</strong>.htm (4 of 18) [1/29/2010 3:13:30 PM]
<strong>School</strong> <strong>Accountability</strong> <strong>Report</strong> <strong>Card</strong> (<strong>SARC</strong>)<br />
This section provides the schools contact information.<br />
<strong>School</strong><br />
District<br />
<strong>School</strong> Name Frank J. Zamboni District Name <strong>Paramount</strong> <strong>Unified</strong><br />
Street 15733 South Orange Ave. Phone Number 562-602-6000<br />
City, State, Zip <strong>Paramount</strong> , CA 90723-4378 Web Site www.paramount.k12.ca.us<br />
Phone Number 562-602-8048 Superintendent David Verdugo<br />
Principal Valanitta Richard E-mail Address dverdugo@paramount.k12.ca.us<br />
E-mail Address vrichard@paramount.k12.ca.us CDS Code 19- 64873- 6114615<br />
<strong>School</strong> Description and Mission Statement (<strong>School</strong> Year 2008-09)<br />
<strong>School</strong> Description and Mission Statement (<strong>School</strong> Year 2008-09)<br />
Frank J. Zamboni <strong>School</strong> is committed to providing a quality education for students by setting high standards in academics and<br />
behavior, by providing teachers and staff with training and resources, and by listening to and working with parents. We believe that<br />
each child should have the opportunity to maximize his/her potential and to develop his/her capabilities to their full extent.<br />
Mission Statement/Goals<br />
All students have the right to a quality education in a positive and safe environment that promotes dignity, respect, high<br />
achievement, and responsible, productive citizenry in a multi-cultural society.<br />
1. Teachers believe that all students can learn.<br />
2. The school addresses the whole child: intellectual, emotional, social, and physical.<br />
3. Teachers hold high expectations for each child while acknowledging individual differences.<br />
4. Developing positive self-esteem enhances respect and cooperation.<br />
5. Pride in one’s work is essential to achieving one’s potential.<br />
6. Promoting personal responsibility develops contributing members of a worldwide society.<br />
7. Learning is valued as a life-long process.<br />
8. A positive, safe environment allows children to perform without fear.<br />
Children should be allowed to make choices and be held responsible for their own actions.<br />
Opportunities for Parental Involvement (<strong>School</strong> Year 2008-09)<br />
Opportunities for Parental Involvement (<strong>School</strong> Year 2008-09)<br />
file:///F|/Zamboni<strong>SARC</strong>.htm (5 of 18) [1/29/2010 3:13:30 PM]
<strong>School</strong> <strong>Accountability</strong> <strong>Report</strong> <strong>Card</strong> (<strong>SARC</strong>)<br />
Parents are encouraged to be a part of their student's education and are welcome to meet with staff members to improve the<br />
learning experiences for their students. Each year, the school surveys parents regarding the effectiveness of school programs and<br />
uses the parent responses to improve the educational program.<br />
Parents may be actively involved in the school through the Parent Teacher Association (PTA), by being elected a <strong>School</strong> Site<br />
Council (SSC) member and attending the <strong>School</strong> Site Council meetings, or being elected to the English Language Advisory<br />
Committee (ELAC). The <strong>School</strong> Site Council and English Language Advisory Committees are parent advisory groups that assist<br />
the principal staff with the educational programs at the school. Parents are welcome to volunteer in their child's classroom<br />
assisting small groups of students, individual students and/or completing tasks the teacher assigns.<br />
Monthly Parent Read Nights give parents ideas of ways to provide reading at home, plus they gain information concerning the<br />
school’s Language Arts program. Other parent education activities include workshops on how to help your student with homework,<br />
the importance of good attendance, how to help your child in algebra, and different parenting skills topics.<br />
Student Enrollment by Grade Level (<strong>School</strong> Year 2008-09)<br />
This table displays the number of students enrolled in each grade level at the school.<br />
Grade Level<br />
Number of Students<br />
Kindergarten 78<br />
Grade 1 59<br />
Grade 2 79<br />
Grade 3 59<br />
Grade 4 66<br />
Grade 5 56<br />
Grade 6 88<br />
Grade 7 72<br />
Grade 8 89<br />
Ungraded Elementary 0<br />
Grade 9 0<br />
Grade 10 0<br />
Grade 11 0<br />
Grade 12 0<br />
Ungraded Secondary 0<br />
Total Enrollment 646<br />
Student Enrollment by Group (<strong>School</strong> Year 2008-09)<br />
This table displays the percent of students enrolled at the school who are identified as being in a particular group.<br />
Group<br />
Percent of Total Enrollment<br />
African American 12.23 %<br />
American Indian or Alaska Native 0.62 %<br />
Asian 0.31 %<br />
Filipino %<br />
file:///F|/Zamboni<strong>SARC</strong>.htm (6 of 18) [1/29/2010 3:13:30 PM]
<strong>School</strong> <strong>Accountability</strong> <strong>Report</strong> <strong>Card</strong> (<strong>SARC</strong>)<br />
Hispanic or Latino 84.06 %<br />
Pacific Islander 1.08 %<br />
White (not Hispanic) 1.70 %<br />
Multiple or No Response %<br />
Socioeconomically Disadvantaged 92.00 %<br />
English Learners 49.00 %<br />
Students with Disabilities 11.00 %<br />
Average Class Size and Class Size Distribution (Elementary)<br />
This table displays by grade level the average class size and the number of classrooms that fall into each size category (a range of total students per<br />
classroom).<br />
Grade<br />
Level<br />
Avg. Class<br />
Size<br />
2006-07 2007-08 2008-09<br />
Avg. Number of<br />
Number of Classrooms Avg. Class Number of Classrooms Class Classrooms<br />
1-20 21-32 33+ Size 1-20 21-32 33+ Size 1-20 21-32 33+<br />
K 24.7 3 20.7 1 2 19.5 4<br />
1 18.8 4 20.0 4 19.7 3<br />
2 20.7 1 2 20.7 1 19.8 4<br />
3 21.0 1 2 20.0 3 20.3 2 1<br />
4 28.7 3 20.0 2 1 22.0 3<br />
5 24.7 3 28.3 3 18.7 3<br />
6<br />
K-3<br />
3-4<br />
4-8<br />
Other<br />
Average Class Size and Class Size Distribution (Secondary)<br />
This table displays by subject area the average class size and the number of classrooms that fall into each size category (a range of<br />
total students per classroom).<br />
2006-07 2007-08 2008-09<br />
Avg. Class Number of Classrooms Avg. Class<br />
Number of<br />
Classrooms<br />
Avg.<br />
Class<br />
Number of<br />
Classrooms<br />
Subject Size 1-22 23-32 33+ Size 1-22 23-32 33+ Size 1-22 23-32 33+<br />
English 30.1 2 3 7 27.9 4 7 4 28.2 1 8 1<br />
Mathematics 30.9 4 4 28.9 3 5 28.0 1 5 2<br />
Science 30.9 5 3 27.9 2 3 3 28.0 1 5 2<br />
Social Science 32.0 1 3 4 28.1 2 2 4 28.0 1 5 2<br />
III. <strong>School</strong> Climate<br />
<strong>School</strong> Safety Plan (<strong>School</strong> Year 2008-09)<br />
file:///F|/Zamboni<strong>SARC</strong>.htm (7 of 18) [1/29/2010 3:13:30 PM]
<strong>School</strong> <strong>Accountability</strong> <strong>Report</strong> <strong>Card</strong> (<strong>SARC</strong>)<br />
This section provides information about the school's comprehensive safety plan.<br />
The safety committee devised the disaster plan with input from parents and teachers. The committee meets regularly to review<br />
safety issues. Included in the comprehensive plan is: mandated cross-reporting, SB187 overview, child abuse reporting, orderly<br />
school environment procedures, policy statements, employee discipline measures, dress code, parent liability, sexual harassment,<br />
pupil discipline, and campus access. Within the school disaster plan are procedures on evacuation due to fire, earthquake<br />
procedures, bomb threat procedures and lockdown procedures. Monthly drills are scheduled in order to be best prepared for any<br />
of these situations. We at Zamboni know that we “play like we practice”, so we take drills seriously. Student safety is paramount.<br />
Suspensions and Expulsions<br />
This table displays the rate of suspensions and expulsions (the total number of incidents divided by the total enrollment) at the school and district<br />
levels for the most recent three-year period.<br />
<strong>School</strong><br />
District<br />
Rate<br />
2006-07 2007-08 2008-09 2006-07 2007-08 2008-09<br />
Suspensions 6.5 5.8 20.3 10.0 11.7 14.6<br />
Expulsions 0.0 0.0 0.0 0.0 0.0 0.1<br />
IV. <strong>School</strong> Facilities<br />
<strong>School</strong> Facility Conditions and Planned Improvements (<strong>School</strong> Year 2009-10)<br />
This section provides information about the condition of the school’s grounds, buildings, and restrooms, and a description of any planned or recently<br />
completed facility improvements.<br />
<strong>School</strong> Facility Good Repair Status (<strong>School</strong> Year 2009-10)<br />
This table displays the results of the most recently completed school site inspection to determine the school facility’s good repair status.<br />
Repair Status<br />
Item Inspected<br />
Exemplary Good Fair Poor<br />
Systems: Gas Leaks, Mechanical/HVAC, Sewer N/A X<br />
Interior: Interior Surfaces N/A X<br />
Cleanliness: Overall Cleanliness, Pest/ Vermin<br />
Infestation<br />
N/A X<br />
Electrical: Electrical N/A X<br />
Restrooms/Fountains: Restrooms, Sinks/ Fountains N/A X<br />
Safety: Fire Safety, Hazardous Materials N/A X<br />
Structural: Structural Damage, Roofs N/A X<br />
Repair Needed and Action Taken or<br />
Planned<br />
file:///F|/Zamboni<strong>SARC</strong>.htm (8 of 18) [1/29/2010 3:13:30 PM]
<strong>School</strong> <strong>Accountability</strong> <strong>Report</strong> <strong>Card</strong> (<strong>SARC</strong>)<br />
External: Playground/<strong>School</strong> Grounds, Windows/<br />
Doors/Gates/Fences<br />
N/A X<br />
Overall Rating X N/A<br />
V. Teachers<br />
Teacher Credentials<br />
This table displays the number of teachers assigned to the school with a full credential, without a full credential, and those teaching outside of their<br />
subject area of competence. Detailed information about teacher qualifications can be found on the CDE DataQuest Web page.<br />
<strong>School</strong><br />
District<br />
Teachers<br />
2006-07 2007-08 2008-09 2008-09<br />
With Full Credential 31 29 32 708<br />
Without Full Credential 3 3 1 22<br />
Teaching Outside Subject Area of Competence 1 0 1 N/A<br />
Teacher Misassignments and Vacant Teacher Positions<br />
This table displays the number of teacher misassignments (teachers assigned without proper legal authorization) and the number of vacant teacher<br />
positions (not filled by a single designated teacher assigned to teach the entire course at the beginning of the school year or semester). Note: Total<br />
Teacher Misassignments includes the number of Misassignments of Teachers of English Learners.<br />
Indicator 2007-08 2008-09 2009-10<br />
Misassignments of Teachers of English Learners 0 1 0<br />
Total Teacher Misassignments 0 1 0<br />
Vacant Teacher Positions 0 0 0<br />
Core Academic Classes Taught by No Child Left Behind Compliant Teachers (<strong>School</strong> Year 2008-09)<br />
This table displays the percent of classes in core academic subjects taught by No Child Left Behind (NCLB) compliant and non-NCLB compliant<br />
teachers in the school, in all schools in the district, in high-poverty schools in the district, and in low-poverty schools in the district. High poverty<br />
schools are defined as those schools with student participation of approximately 75 percent or more in the free and reduced price meals program. Low<br />
poverty schools are those with student participation of approximately 25 percent or less in the free and reduced price meals program. More<br />
information on teacher qualifications required under NCLB can be found on the CDE Improving Teacher and Principal Quality Web page.<br />
Location of Classes<br />
Percent of Classes In Core Academic Subjects<br />
Taught by NCLB Compliant Teachers Taught by Non-NCLB Compliant Teachers<br />
This <strong>School</strong> 92.7 7.3<br />
All <strong>School</strong>s in District 93.7 6.3<br />
High-Poverty <strong>School</strong>s in District 93.8 6.2<br />
Low-Poverty <strong>School</strong>s in District<br />
VI. Support Staff<br />
file:///F|/Zamboni<strong>SARC</strong>.htm (9 of 18) [1/29/2010 3:13:30 PM]
<strong>School</strong> <strong>Accountability</strong> <strong>Report</strong> <strong>Card</strong> (<strong>SARC</strong>)<br />
Academic Counselors and Other Support Staff (<strong>School</strong> Year 2008-09)<br />
This table displays, in units of full-time equivalents (FTE), the number of academic counselors and other support staff who are assigned to the school<br />
and the average number of students per academic counselor. One FTE equals one staff member working full time; one FTE could also represent two<br />
staff members who each work 50 percent of full time.<br />
Title<br />
Number of FTE Assigned to <strong>School</strong><br />
Average Number of Students per Academic<br />
Counselor<br />
Academic Counselor 1.0 646<br />
Library Media Teacher (Librarian)<br />
Psychologist<br />
Social Worker<br />
Nurse<br />
Speech/Language/Hearing Specialist 1.0 N/A<br />
Resource Specialist (non-teaching) 1.0 N/A<br />
Other<br />
N/A<br />
N/A<br />
N/A<br />
N/A<br />
VII. Curriculum and Instructional Materials<br />
Quality, Currency, Availability of Textbooks and Instructional Materials (<strong>School</strong> Year 2009-10)<br />
This table displays information about the quality, currency, and availability of the standards-aligned textbooks and other instructional materials used at<br />
the school, and information about the school’s use of any supplemental curriculum or non-adopted textbooks or instructional materials.<br />
Core Curriculum Area<br />
Quality, Currency, and Availability of Textbooks<br />
and Instructional Materials<br />
All of the following books are in fair to<br />
new condition. Any book in less than fair<br />
condition is discarded:<br />
Percent of Pupils Who Lack Their Own<br />
Assigned Textbooks and Instructional<br />
Materials<br />
Reading/Language Arts<br />
Prentice Hall Literature - standards based text from<br />
state approved list adopted by PUSD in 2003<br />
Hampton-Brown High Point - standards based text<br />
from state approved list adopted by PUSD in 2003<br />
0<br />
McDougal Littell Math - standards based text from<br />
state approved list adopted by PUSD<br />
Mathematics<br />
McDougal Littell Algebra - standards based text<br />
approved by PUSD Board of Education<br />
Glencoe/McGraw-Hill Algebra Readiness -<br />
standards based text approved by PUSD Board of<br />
Education<br />
0<br />
file:///F|/Zamboni<strong>SARC</strong>.htm (10 of 18) [1/29/2010 3:13:30 PM]
<strong>School</strong> <strong>Accountability</strong> <strong>Report</strong> <strong>Card</strong> (<strong>SARC</strong>)<br />
Science<br />
Glenco/Mcgraw-Hill Focus on Science -<br />
standards based text from state approved list<br />
adopted by PUSD in 2007<br />
0<br />
History-Social Science<br />
Glenco/Mcgraw-Hill Social Studies -<br />
standards based text from state approved list<br />
adopted by PUSD in 2006<br />
0<br />
Health<br />
Mendez Foundation Too Good: Violence<br />
& Drugs - standards based text approved by<br />
PUSD Board of Education<br />
Glenco/Mcgraw-Hill Teen Health - standards based<br />
text approved by PUSD Board of Education<br />
0<br />
VIII. <strong>School</strong> Finances<br />
Expenditures Per Pupil and <strong>School</strong> Site Teacher Salaries (Fiscal Year 2007-08)<br />
This table displays a comparison of the school’s per pupil expenditures from unrestricted (basic) sources with other schools in the district and<br />
throughout the state, and a comparison of the average teacher salary at the school site with average teacher salaries at the district and state levels.<br />
Detailed information regarding school expenditures can be found on the CDE Current Expense of Education & Per-pupil Spending Web page and<br />
teacher salaries can be found on the CDE Certificated Salaries & Benefits Web page.<br />
Total Expenditures Per Expenditures Per Pupil Expenditures Per Pupil Average<br />
Level<br />
Pupil<br />
(Supplemental / Restricted) (Basic / Unrestricted) Teacher Salary<br />
<strong>School</strong> Site $3,605 $405 3,200 $72,906<br />
District N/A N/A $3,092 $67,410<br />
Percent Difference<br />
– <strong>School</strong> Site and<br />
N/A N/A -3.49% 8.15%<br />
District<br />
State N/A N/A $5,512 $65,905<br />
Percent Difference<br />
– <strong>School</strong> Site and<br />
N/A N/A 41.94% 10.62%<br />
State<br />
Types of Services Funded (Fiscal Year 2008-09)<br />
This section provides information about the programs and supplemental services that are available at the school and funded through either categorical<br />
or other sources.<br />
file:///F|/Zamboni<strong>SARC</strong>.htm (11 of 18) [1/29/2010 3:13:30 PM]
<strong>School</strong> <strong>Accountability</strong> <strong>Report</strong> <strong>Card</strong> (<strong>SARC</strong>)<br />
Our district receives federal and state funds that provide supplementary instructional and support services to eligible students.<br />
These programs are designed to help overcome the academic obstacles that students face as a result of poverty, mobility and lack<br />
of English language skills. These programs are Title 1, Economic Impact Aide for Limited English Proficient students (EIA-LEP),<br />
English Language Acquisition Program (ELAP), and Migrant Education (ME).<br />
Additional programs provide support for identified gifted and talented students such as the Gifted and Talented Program (GATE)<br />
and fund schoolwide initiatives such as <strong>School</strong> Improvement Program (SIP). Programs such as Community Based English<br />
Tutoring (CBET) and Title I provide parent education and English Language Development classes to parents of English Learners.<br />
●<br />
●<br />
●<br />
●<br />
●<br />
●<br />
●<br />
●<br />
Title I – For K-12 students whose academic performance is below the average range for his/her grade level.<br />
<strong>School</strong> Improvement Program (SIP) – Assists all K-8 students with extra materials, supplies and other related support.<br />
Migrant Education (ME) - For K-12 students whose parents are employed in agriculture, forestry or fishing industries.<br />
EIA/LEP- For K-12 English Learners to acquire English proficiency.<br />
English Language Acquisition Program (ELAP) - For students in grades 4-8 to assist them in improving their English<br />
proficiency and to meet the state’s academic content and performance standards.<br />
Gifted and Talented Education (GATE) - For K-12 students who meet specific criteria and show abilities above grade level.<br />
Foster Youth Mentor Program - Foster youth students receive tutoring and mentoring services on a weekly basis.<br />
The California <strong>School</strong> Age Family Education program (Cal-SAFE) is designed to provide specialized instruction and<br />
support to pregnant and parenting teens.<br />
The support that these programs provide fall within the following categories:<br />
●<br />
●<br />
●<br />
Extended-day instructional services that include before and after-school tutorials, summer school intersessions, Saturday<br />
classes, and academic institutes. In addition, instructional aides, teacher extra hours, literacy teachers, other classified<br />
personnel and supplementary materials are funded with these monies.<br />
Professional Development services that include participation at conferences, teacher institutes, summer academies and<br />
workshops. These activities provide staff with effective teaching strategies that support student learning.<br />
Parent and Community Involvement services that include parent education classes, leadership development activities,<br />
ELD classes, and beginning computer classes. These services are provided with the intent of strengthening the role of<br />
parents by teaching them ways to support their children’s academic success and develop their skills as school and<br />
community leaders.<br />
Other support services:<br />
Counseling Services - Counseling and guidance services are available at all sites. There is a full-time counselor at each of the K-8<br />
school sites.<br />
Special Education – Special education services are provided to students who have mental, emotional, learning, or physical<br />
impairments that significantly affect their educational progress.<br />
d<br />
Teacher and Administrative Salaries (Fiscal Year 2007-08)<br />
This table displays district salaries for teachers, principals, and superintendents, and compares these figures to the state averages for districts of the<br />
same type and size. The table also displays teacher and administrative salaries as a percent of a district's budget, and compares these figures to the<br />
state averages for districts of the same type and size based on the salary schedule. Detailed information regarding salaries may be found on the CDE<br />
Certificated Salaries & Benefits Web page.<br />
Category District Amount State Average For Districts In Same Category<br />
Beginning Teacher Salary $44,636 $40,786<br />
Mid-Range Teacher Salary $67,422 $65,726<br />
Highest Teacher Salary $87,179 $85,230<br />
Average Principal Salary (Elementary) $107,782 $106,548<br />
Average Principal Salary (Middle) $112,237<br />
Average Principal Salary (High) $117,608 $121,617<br />
file:///F|/Zamboni<strong>SARC</strong>.htm (12 of 18) [1/29/2010 3:13:30 PM]
<strong>School</strong> <strong>Accountability</strong> <strong>Report</strong> <strong>Card</strong> (<strong>SARC</strong>)<br />
Superintendent Salary $196,684 $191,155<br />
Percent of Budget for Teacher Salaries 41.00 % 40.60 %<br />
Percent of Budget for Administrative Salaries 5.60 % 5.30 %<br />
IX. Student Performance<br />
Standardized Testing and <strong>Report</strong>ing Program<br />
The Standardized Testing and <strong>Report</strong>ing (STAR) Program consists of several key components, including the California Standards Tests<br />
(CSTs); the California Modified Assessment (CMA), and the California Alternate Performance Assessment (CAPA). The CSTs show<br />
how well students are doing in relation to the state content standards. The CSTs include English-language arts (ELA) and mathematics<br />
in grades two through eleven; science in grades five, eight, and nine through eleven; and history-social science in grades eight, and ten<br />
through eleven. The CAPA includes ELA, mathematics, and science in grades two through eleven, and for science for grades five, eight,<br />
and ten. The CAPA is given to those students with significant cognitive disabilities whose disabilities prevent them from taking either the<br />
CSTs with accommodations or modifications or the CMA with accommodations. The CMA includes ELA and mathematics for grades<br />
three through eight and science in grade five and is an alternate assessment that is based on modifiedachievement standards. The CMA<br />
is designed to assess those students whose disabilities preclude them from achieving grade-level proficiency on an assessment of the<br />
California content standards with or without accommodations. Student scores are reported as performance levels. Detailed information<br />
regarding the STAR Program results for each grade and performance level, including the percent of students not tested, can be found<br />
on the CDE Standardized Testing and <strong>Report</strong>ing (STAR) Results Web site. Program information regarding the STAR Program can be<br />
found in the Explaining 2008 STAR Program Summary Results to the Public guide. Note: Scores are not shown when the number of<br />
students tested is ten or less, either because the number of students in this category is too small for statistical accuracy or to protect<br />
student privacy. In no case shall any group score be reported that would deliberately or inadvertently make public the score or<br />
performance of any individual student.<br />
Standardized Testing and <strong>Report</strong>ing Results for All Students – Three-Year Comparison<br />
This table displays the percent of students achieving at the Proficient or Advanced level (meeting or exceeding the state standards).<br />
Subject<br />
<strong>School</strong> District State<br />
2006-07 2007-08 2008-09 2006-07 2007-08 2008-09 2006-07 2007-08 2008-09<br />
English-Language Arts 28 36 43 32 34 39 43 46 50<br />
Mathematics 38 45 51 33 38 43 40 43 46<br />
Science 15 27 31 22 32 34 38 46 50<br />
History-Social Science 4 13 21 18 22 27 33 36 41<br />
Note: Scores are not shown when the number of students tested is 10 or less because the number of students in this category is<br />
too small for statistical accuracy or privacy protection. In no case shall any group score be reported that would deliberately or<br />
inadvertently make public the score or performance of any individual student.<br />
Standardized Testing and <strong>Report</strong>ing Results by Student Group (<strong>School</strong> Year 2008-09)<br />
This table displays the percent of students, by group, achieving at the Proficient or Advanced level (meeting or exceeding the state standards) for the<br />
most recent testing period.<br />
Group<br />
Percent of Students Scoring at Proficient or Advanced<br />
English-Language Arts Mathematics Science History-Social Science<br />
African American 39 40 33 17<br />
American Indian or Alaska Native * * *<br />
Asian * * *<br />
file:///F|/Zamboni<strong>SARC</strong>.htm (13 of 18) [1/29/2010 3:13:30 PM]
<strong>School</strong> <strong>Accountability</strong> <strong>Report</strong> <strong>Card</strong> (<strong>SARC</strong>)<br />
Filipino * *<br />
Hispanic or Latino 43 52 31 22<br />
Pacific Islander * * * *<br />
White (not Hispanic) * * *<br />
Male 40 52 34 23<br />
Female 46 50 29 19<br />
Economically Disadvantaged 42 50 32 23<br />
English Learners 26 40 8 7<br />
Students with Disabilities 38 44 19 *<br />
Students Receiving Migrant Education Services<br />
Note: Scores are not shown when the number of students tested is 10 or less because the number of students in this category is too small for statistical<br />
accuracy or privacy protection. In no case shall any group score be reported that would deliberately or inadvertently make public the score or<br />
performance of any individual student.<br />
California Physical Fitness Test Results (<strong>School</strong> Year 2008-09)<br />
The California Physical Fitness Test is administered to students in grades five, seven, and nine only. This table displays by grade level the percent of<br />
students meeting fitness standards for the most recent testing period. Detailed information regarding this test, and comparisons of a school’s test<br />
results to the district and state levels, may be found on the CDE Physical Fitness Testing (PFT) Web page. Note: Scores are not shown when the<br />
number of students tested is ten or less because the number of students in this category is too small for statistical accuracy or privacy protection. In no<br />
case shall any group score be reported that would deliberately or inadvertently make public the score or performance of any individual student.<br />
Grade Level<br />
Percent of Students Meeting Healthy Fitness Zones<br />
Four of Six Standards Five of Six Standards Six of Six Standards<br />
5 24.5 20.8 20.8<br />
7 28.1 7.8 9.4<br />
9 0.0 0.0 0.0<br />
X. <strong>Accountability</strong><br />
Academic Performance Index<br />
The Academic Performance Index (API) is an annual measure of the academic performance and progress of schools in California. API scores range<br />
from 200 to 1,000, with a statewide target of 800. Detailed information about the API can be found on the CDE Academic Performance Index (API)<br />
Web page.<br />
Academic Performance Index Ranks – Three-Year Comparison<br />
This table displays the school’s statewide and similar schools API ranks. The statewide API rank ranges from one to ten. A statewide rank of one<br />
means that the school has an API score in the lowest ten percent of all schools in the state, while a statewide rank of ten means that the school has an<br />
API score in the highest ten percent of all schools in the state. The similar schools API rank reflects how a school compares to 100 statistically<br />
matched “similar schools.” A similar schools rank of one means that the school’s academic performance is comparable to the lowest performing ten<br />
schools of the 100 similar schools, while a similar schools rank of ten means that the school’s academic performance is better than at least 90 of the<br />
100 similar schools.<br />
API Rank 2006 2007 2008<br />
file:///F|/Zamboni<strong>SARC</strong>.htm (14 of 18) [1/29/2010 3:13:30 PM]
<strong>School</strong> <strong>Accountability</strong> <strong>Report</strong> <strong>Card</strong> (<strong>SARC</strong>)<br />
"N/<br />
A"<br />
"B"<br />
"C"<br />
Statewide 1 2 3<br />
Similar <strong>School</strong>s 6 9 9<br />
means a number is not applicable or not available due to missing data.<br />
means this is either an LEA or an Alternative <strong>School</strong>s <strong>Accountability</strong> Model (ASAM) school. <strong>School</strong>s participating in the<br />
ASAM do not currently receive growth, target information, or statewide or similar schools rankings on this report in<br />
recognition of their markedly different educational missions and populations served. ASAM schools are covered under the<br />
Alternative <strong>Accountability</strong> system as required by Education Code Section 52052 and not the API accountability system.<br />
However, API information is needed to comply with the federal No Child Left Behind (NCLB) law. Growth, target and rank<br />
information are not applicable to LEAs.<br />
means this is a special education school. Statewide and similar schools ranks are not applicable to special education<br />
schools.<br />
" * " means this API is calculated for a small school or a small LEA, defined as having between 11 and 99 valid STAR Program<br />
test scores included in the API. APIs based on small numbers of students are less reliable and therefore should be carefully<br />
interpreted. Similar schools ranks are not calculated for small schools.<br />
Academic Performance Index Growth by Student Group – Three-Year Comparison<br />
This table displays, by student group, the actual API changes in points added or lost for the past three years, and the most recent API score. Note: "N/<br />
A" means that the student group is not numerically significant.<br />
Actual API Change<br />
Growth API Score<br />
Group<br />
2006-07 2007-08 2008-09 2009<br />
All Students at the <strong>School</strong> 30 30 27 753<br />
African American<br />
American Indian or Alaska Native<br />
Asian<br />
Filipino<br />
Hispanic or Latino 25 35 28 756<br />
Pacific Islander<br />
White (not Hispanic)<br />
Socioeconomically Disadvantaged 34 30 29 752<br />
English Learners 29 37 19 730<br />
Students with Disabilities<br />
"N/<br />
A"<br />
means a number is not applicable or not available due to missing data.<br />
"*" means this API is calculated for a small school, defined as having between 11 and 99 valid Standardized Testing and<br />
<strong>Report</strong>ing (STAR) Program test scores included in the API. The API is asterisked if the school was small either in 2008 or<br />
2009. APIs based on small numbers of students are less reliable and therefore should be carefully interpreted.<br />
file:///F|/Zamboni<strong>SARC</strong>.htm (15 of 18) [1/29/2010 3:13:30 PM]
<strong>School</strong> <strong>Accountability</strong> <strong>Report</strong> <strong>Card</strong> (<strong>SARC</strong>)<br />
Adequate Yearly Progress<br />
The federal NCLB Act requires that all schools and districts meet the following Adequate Yearly Progress (AYP) criteria:<br />
* Participation rate on the state’s standards-based assessments in ELA and mathematics<br />
* Percent proficient on the state’s standards-based assessments in ELA and mathematics<br />
* API as an additional indicator<br />
* Graduation rate (for secondary schools)<br />
Detailed information about AYP, including participation rates and percent proficient results by student group, can be found on the CDE Adequate<br />
Yearly Progress (AYP) Web page.<br />
Adequate Yearly Progress Overall and by Criteria (<strong>School</strong> Year 2008-09)<br />
This table displays an indication of whether the school and the district made AYP overall and whether the school and the district met each of the AYP<br />
criteria.<br />
AYP Criteria <strong>School</strong> District<br />
Overall Yes No<br />
Participation Rate - English-Language Arts Yes Yes<br />
Participation Rate - Mathematics Yes Yes<br />
Percent Proficient - English-Language Arts Yes No<br />
Percent Proficient - Mathematics Yes Yes<br />
API Yes Yes<br />
"Yes"<br />
"No"<br />
Graduation Rate N/A Yes<br />
Met 2009 AYP Criteria<br />
Did not Meet 2009 AYP Criteria<br />
Federal Intervention Program (<strong>School</strong> Year 2009-10)<br />
<strong>School</strong>s and districts receiving federal Title I funding enter Program Improvement (PI) if they do not make AYP for two consecutive years in the same<br />
content area (ELA or mathematics) or on the same indicator (API or graduation rate). After entering PI, schools and districts advance to the next level<br />
of intervention with each additional year that they do not make AYP. Detailed information about PI identification can be found on the CDE Adequate<br />
Yearly Progress (AYP) Web page.<br />
Indicator <strong>School</strong> District<br />
Program Improvement Status Not in PI In PI<br />
First Year of Program Improvement 2008-2009<br />
Year in Program Improvement Year 2<br />
Number of <strong>School</strong>s Currently in Program Improvement N/A 9<br />
Percent of <strong>School</strong>s Currently in Program Improvement N/A 47.4<br />
file:///F|/Zamboni<strong>SARC</strong>.htm (16 of 18) [1/29/2010 3:13:30 PM]
<strong>School</strong> <strong>Accountability</strong> <strong>Report</strong> <strong>Card</strong> (<strong>SARC</strong>)<br />
XI. Instructional Planning and Scheduling<br />
Professional Development<br />
This section provides information on the annual number of school days dedicated to staff development for the most recent three-year period.<br />
Numerous professional development opportunities for teachers and staff have been provided in the past several years. The major<br />
focus of all staff development is to provide support and training to staff for the improvement of student achievement in all curricular<br />
areas. Staff members build teaching skills and concepts by participating in workshops and conferences throughout the year. The<br />
district offers professional growth opportunities in curriculum; teaching strategies and methodologies aligned with the district focus<br />
areas. Minimum day schedules and staff meeting days provide time for staff members to extensively examine and analyze student<br />
work and receive further training.<br />
In recent years, the staff development days have concentrated on literacy training, English Language Development and Specially<br />
Designed Academic Instruction (SDAIE) methodology, assessment and evaluation of student work including the use of rubrics<br />
and standards based instruction. The district further promotes professional development programs such as Peer Assistance<br />
Coaches, Master Teachers, Beginning Teacher Support and Assessment (BTSA) and the Intern Program.<br />
XII. National Assessment of Educational Progress<br />
National Assessment of Educational Progress<br />
The National Assessment of Educational Progress (NAEP) is a nationally representative assessment of what America's students know and can do in<br />
various subject areas. Assessments are conducted periodically in mathematics, reading, science, writing, the arts, civics, economics, geography, and U.<br />
S. history. Student scores for reading and mathematics are reported as performance levels (i.e., basic, proficient, and advanced) and the participation<br />
of students with disabilities and English language learners is reported based on three levels (identified, excluded, and assessed). Detailed information<br />
regarding the NAEP results for each grade, performance level, and participation rate can be found on the National Assessment of Educational Progress<br />
Web page (Outside Source).<br />
Note: Only a sample group of California's schools and districts participate in the NAEP testing cycle. Therefore, students in any particular school or<br />
district may not be included in these results. The NAEP reflects state test results and is not reflective of either the LEA or the individual school.<br />
Comparisons of student performance on the NAEP and student performance on the Standardized Testing and <strong>Report</strong>ing (STAR) Program assessments<br />
cannot be made without an understanding of the key differences between the two assessment programs. For example, the NAEP only assesses grades<br />
four, eight and twelve and for long-term trends assesses grades nine, thirteen, and seventeen. Additionally, the NAEP only provides state test results<br />
for grades four and eight. The California Standards Tests (CSTs) are based on a different set of standards than the NAEP assessments. For example,<br />
the NAEP is not aligned with California academic content and achievement standards and, therefore, does not necessarily reflect the curriculum and<br />
instruction to which students are exposed in the classroom. The NAEP assesses reading and writing separately, while the CSTs assess Englishlanguage<br />
arts (ELA), encompassing reading as well as writing conventions, spelling, and grammar. Scores on the CSTs and other assessments are not<br />
directly comparable to those on NAEP. The averages and percentages presented are estimates based on samples of students rather than on entire<br />
populations. Finally, the questions students respond to are only a sample of the knowledge and skills covered by the NAEP frameworks. Information<br />
on the differences between NAEP and CST can be found on the CDE National Assessment of Educational Progress (NAEP) Web page.<br />
National Assessment of Educational Progress Reading and Mathematics Results by Grade Level –<br />
Aggregated<br />
This table displays the scale scores and achievement levels on the National Assessment of Educational Progress Results for reading (2007) and<br />
mathematics (2009) for grades four and eight<br />
file:///F|/Zamboni<strong>SARC</strong>.htm (17 of 18) [1/29/2010 3:13:30 PM]
<strong>School</strong> <strong>Accountability</strong> <strong>Report</strong> <strong>Card</strong> (<strong>SARC</strong>)<br />
Average Scale Score<br />
State Percent at Achievement Level<br />
Subject and Grade Level<br />
State National Basic Proficient Advanced<br />
Reading 2007, Grade 4 209 220 30 18 5<br />
Reading 2007, Grade 8 251 261 41 20 2<br />
Mathematics 2009, Grade 4 232 239 41 25 5<br />
Mathematics 2009, Grade 8 270 282 36 18 5<br />
National Assessment of Educational Progress Reading and Mathematics Results for Students with<br />
Disabilities and/or English Language Learners by Grade Level – Aggregated<br />
This table displays the state and national participation rates on the National Assessment of Educational Progress for reading (2007) and mathematics<br />
(2009) for students with disabilities and/or English language learners for grades four and eight.<br />
Subject and Grade Level<br />
State Participation Rate<br />
Students With<br />
Disabilities<br />
English Language<br />
Learners<br />
National Participation Rate<br />
Students With<br />
Disabilities<br />
English Language<br />
Learners<br />
Reading 2007, Grade 4 74 93 65 80<br />
Reading 2007, Grade 8 78 92 66 77<br />
Mathematics 2009, Grade 4 79 96 84 94<br />
Mathematics 2009, Grade 8 85 96 78 92<br />
file:///F|/Zamboni<strong>SARC</strong>.htm (18 of 18) [1/29/2010 3:13:30 PM]