Part I. R& D Status - pcaarrd - Department of Science and Technology
Part I. R& D Status - pcaarrd - Department of Science and Technology
Part I. R& D Status - pcaarrd - Department of Science and Technology

You also want an ePaper? Increase the reach of your titles
YUMPU automatically turns print PDFs into web optimized ePapers that Google loves.
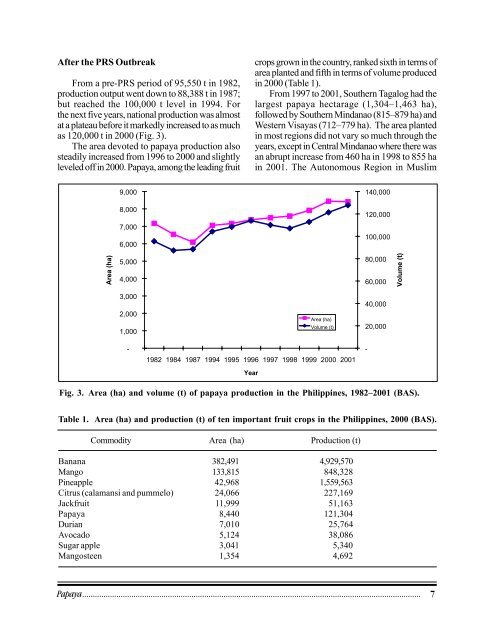
After the PRS Outbreak<br />
From a pre-PRS period <strong>of</strong> 95,550 t in 1982,<br />
production output went down to 88,388 t in 1987;<br />
but reached the 100,000 t level in 1994. For<br />
the next five years, national production was almost<br />
at a plateau before it markedly increased to as much<br />
as 120,000 t in 2000 (Fig. 3).<br />
The area devoted to papaya production also<br />
steadily increased from 1996 to 2000 <strong>and</strong> slightly<br />
leveled <strong>of</strong>f in 2000. Papaya, among the leading fruit<br />
crops grown in the country, ranked sixth in terms <strong>of</strong><br />
area planted <strong>and</strong> fifth in terms <strong>of</strong> volume produced<br />
in 2000 (Table 1).<br />
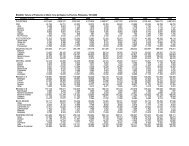
From 1997 to 2001, Southern Tagalog had the<br />
largest papaya hectarage (1,304–1,463 ha),<br />
followed by Southern Mindanao (815–879 ha) <strong>and</strong><br />
Western Visayas (712–779 ha). The area planted<br />
in most regions did not vary so much through the<br />
years, except in Central Mindanao where there was<br />
an abrupt increase from 460 ha in 1998 to 855 ha<br />
in 2001. The Autonomous Region in Muslim<br />
9,000<br />
8,000<br />
7,000<br />
6,000<br />
140,000<br />
120,000<br />
100,000<br />
Area (ha)<br />
5,000<br />
4,000<br />
80,000<br />
60,000<br />
Volume (t)<br />
3,000<br />
2,000<br />
1,000<br />
-<br />
Area (ha)<br />
Volume (t)<br />
1982 1984 1987 1994 1995 1996 1997 1998 1999 2000 2001<br />
Year<br />
40,000<br />
20,000<br />
-<br />
Fig. 3. Area (ha) <strong>and</strong> volume (t) <strong>of</strong> papaya production in the Philippines, 1982–2001 (BAS).<br />
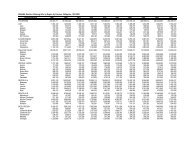
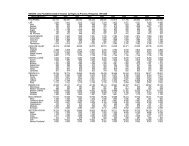
Table 1. Area (ha) <strong>and</strong> production (t) <strong>of</strong> ten important fruit crops in the Philippines, 2000 (BAS).<br />
Commodity Area (ha) Production (t)<br />
Banana 382,491 4,929,570<br />
Mango 133,815 848,328<br />
Pineapple 42,968 1,559,563<br />
Citrus (calamansi <strong>and</strong> pummelo) 24,066 227,169<br />
Jackfruit 11,999 51,163<br />
Papaya 8,440 121,304<br />
Durian 7,010 25,764<br />
Avocado 5,124 38,086<br />
Sugar apple 3,041 5,340<br />
Mangosteen 1,354 4,692<br />
Papaya.............................................................................................................................................................. 7