Are Labor Market Institutions Really at the Root of Unemployment ...
Are Labor Market Institutions Really at the Root of Unemployment ...
Are Labor Market Institutions Really at the Root of Unemployment ...

Create successful ePaper yourself
Turn your PDF publications into a flip-book with our unique Google optimized e-Paper software.
48<br />
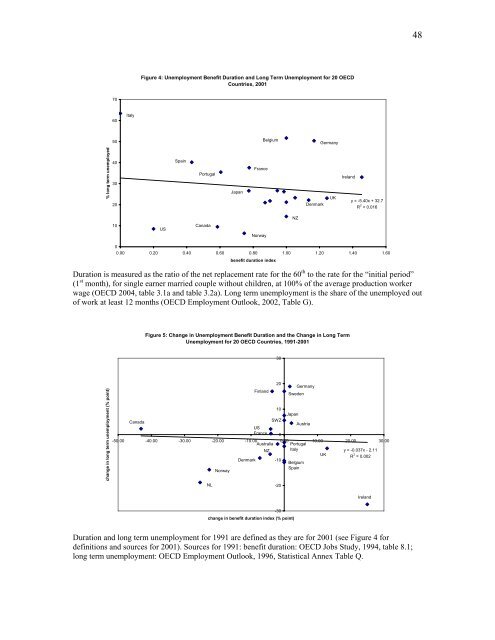
Figure 4: <strong>Unemployment</strong> Benefit Dur<strong>at</strong>ion and Long Term <strong>Unemployment</strong> for 20 OECD<br />
Countries, 2001<br />
70<br />
60<br />
Italy<br />
50<br />
Belgium<br />
Germany<br />
% long term unemployed<br />
40<br />
30<br />
20<br />
Spain<br />
Portugal<br />
Japan<br />
France<br />
Denmark<br />
UK<br />
Ireland<br />
y = -5.40x + 32.7<br />
R 2 = 0.016<br />
NZ<br />
10<br />
US<br />
Canada<br />
Norway<br />
0<br />
0.00 0.20 0.40 0.60 0.80 1.00 1.20 1.40 1.60<br />
benefit dur<strong>at</strong>ion index<br />
Dur<strong>at</strong>ion is measured as <strong>the</strong> r<strong>at</strong>io <strong>of</strong> <strong>the</strong> net replacement r<strong>at</strong>e for <strong>the</strong> 60 th to <strong>the</strong> r<strong>at</strong>e for <strong>the</strong> “initial period”<br />
(1 st month), for single earner married couple without children, <strong>at</strong> 100% <strong>of</strong> <strong>the</strong> average production worker<br />
wage (OECD 2004, table 3.1a and table 3.2a). Long term unemployment is <strong>the</strong> share <strong>of</strong> <strong>the</strong> unemployed out<br />
<strong>of</strong> work <strong>at</strong> least 12 months (OECD Employment Outlook, 2002, Table G).<br />
Figure 5: Change in <strong>Unemployment</strong> Benefit Dur<strong>at</strong>ion and <strong>the</strong> Change in Long Term<br />
<strong>Unemployment</strong> for 20 OECD Countries, 1991-2001<br />
30<br />
change in long term unemployment (% point)<br />
Canada<br />
NL<br />
Norway<br />
Denmark<br />
Finland<br />
NZ<br />
20<br />
-10<br />
-20<br />
Sweden<br />
Germany<br />
10<br />
Japan<br />
SWZ<br />
Austria<br />
US<br />
France 0<br />
-50.00 -40.00 -30.00 -20.00 -10.00<br />
Australia<br />
0.00 10.00 20.00 30.00<br />
Portugal<br />
Italy<br />
Belgium<br />
Spain<br />
UK<br />
y = -0.037x - 2.11<br />
R 2 = 0.002<br />
Ireland<br />
-30<br />
change in benefit dur<strong>at</strong>ion index (% point)<br />
Dur<strong>at</strong>ion and long term unemployment for 1991 are defined as <strong>the</strong>y are for 2001 (see Figure 4 for<br />
definitions and sources for 2001). Sources for 1991: benefit dur<strong>at</strong>ion: OECD Jobs Study, 1994, table 8.1;<br />
long term unemployment: OECD Employment Outlook, 1996, St<strong>at</strong>istical Annex Table Q.