A Multiparametric Live-Cell Cytotoxicity analysis using ... - PerkinElmer
A Multiparametric Live-Cell Cytotoxicity analysis using ... - PerkinElmer
A Multiparametric Live-Cell Cytotoxicity analysis using ... - PerkinElmer

Create successful ePaper yourself
Turn your PDF publications into a flip-book with our unique Google optimized e-Paper software.
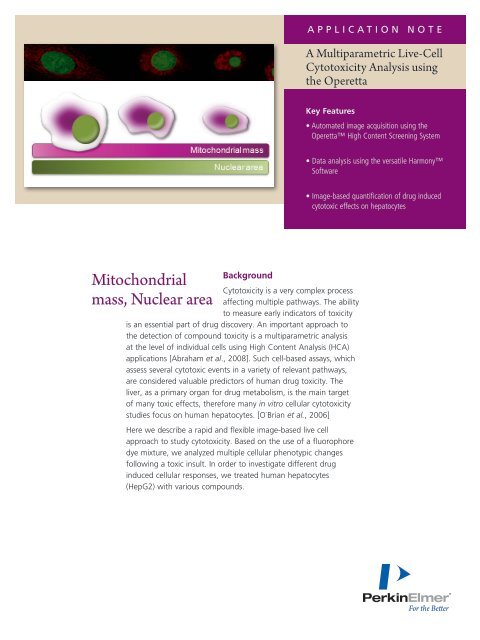
application Note<br />
A <strong>Multiparametric</strong> <strong>Live</strong>-<strong>Cell</strong><br />
<strong>Cytotoxicity</strong> Analysis <strong>using</strong><br />
the Operetta<br />
Key Features<br />
• Automated image acquisition <strong>using</strong> the<br />
Operetta High Content Screening System<br />
• Data <strong>analysis</strong> <strong>using</strong> the versatile Harmony<br />
Software<br />
• Image-based quantification of drug induced<br />
cytotoxic effects on hepatocytes<br />
Mitochondrial<br />
mass, Nuclear area<br />
Background<br />
<strong>Cytotoxicity</strong> is a very complex process<br />
affecting multiple pathways. The ability<br />
to measure early indicators of toxicity<br />
is an essential part of drug discovery. An important approach to<br />
the detection of compound toxicity is a multiparametric <strong>analysis</strong><br />
at the level of individual cells <strong>using</strong> High Content Analysis (HCA)<br />
applications [Abraham et al., 2008]. Such cell-based assays, which<br />
assess several cytotoxic events in a variety of relevant pathways,<br />
are considered valuable predictors of human drug toxicity. The<br />
liver, as a primary organ for drug metabolism, is the main target<br />
of many toxic effects, therefore many in vitro cellular cytotoxicity<br />
studies focus on human hepatocytes. [O`Brian et al., 2006]<br />
Here we describe a rapid and flexible image-based live cell<br />
approach to study cytotoxicity. Based on the use of a fluorophore<br />
dye mixture, we analyzed multiple cellular phenotypic changes<br />
following a toxic insult. In order to investigate different drug<br />
induced cellular responses, we treated human hepatocytes<br />
(HepG2) with various compounds.
Application<br />
To study in vitro cytotoxicity <strong>using</strong> a High Content Screening<br />
approach, we treated HepG2 cells with FCCP 1 , Tacrine 2 or<br />
AAP 3 . The cells were seeded at a density of 5000 cells / well in<br />
384 Collagen I coated <strong>Cell</strong>Carrier microtiter plates and were<br />
cultured overnight. After 24 h incubation with each<br />
compound, cells were stained with a fluorophore dye-cocktail<br />
(diluted in growth medium), containing Hoechst, BOBO-3<br />
and MitoTracker® Deep Red. After 40 min incubation with<br />
the dye cocktail, measurement of the live-cells was performed<br />
on the Operetta equipped with a LWD 20x objective.<br />
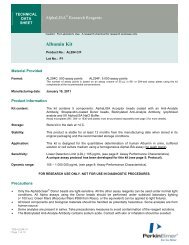
Figure 1 shows images of untreated and FCCP, Tacrine and<br />
AAP treated cells. After a 24 h treatment with each<br />
compound, significant intracellular and morphological<br />
changes of HepG2 cells can be observed.<br />
Hoechst channel<br />
Control<br />
MitoTracker® channel<br />
Control<br />
BOBO-3 channel<br />
Control 30 μM FCCP<br />
1 mM Tacrine<br />
300 μM Tacrine 100 mM AAP<br />
Figure 1. The Hoechst stained nuclei are shown in blue and the MitoTracker®<br />
Deep Red stained mitochondria are shown in red. The images show compound<br />
induced phenotypic changes, and a loss of both mitochondrial signal and cell<br />
number. The treatment of HepG2 cells with each compound results in an<br />
enhanced biogenesis of mitochondria and an increase in mitochondrial mass. A<br />
reduction of nuclear size due to toxic impact is also observed. The images were<br />
acquired on the Operetta <strong>using</strong> the LWD 20x objective.<br />
The acquired images were analyzed with the Harmony<br />
“<strong>Cytotoxicity</strong>-1” module selected from the Ready-Made<br />
Solution(RMS) collection. In addition to the set of RMSs,<br />
Harmony provides a wide range of building blocks to enable<br />
simplified custom image <strong>analysis</strong>. Each clearly defined building<br />
block has primary tuning parameters with optimized values that<br />
can be automatically or manually adjusted with real-time visual<br />
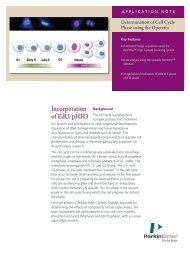
feedback to facilitate the set-up process. Figure 2 illustrates the<br />
image <strong>analysis</strong> strategy of the “<strong>Cytotoxicity</strong>-1” RMS.<br />
Figure 2. Image <strong>analysis</strong> strategy for quantification of compound cytotoxicity.<br />
Top | The determination of the cell count, nuclear intensity and area is based on<br />
the detection of Hoechst stained nuclei.<br />
Middle | A mask generated by finding the cytoplasmic outlines and excluding the<br />
nuclei is applied to determine the mitochondrial mass, calculated by measurement<br />
of the MitoTracker® intensity.<br />
Bottom | The region used to calculate the intensity of BOBO-3 staining is<br />
defined through nuclei detection. By introduction of a threshold (here: 1200),<br />
cells with disrupted membranes were classified as “dead”.<br />
The early effects of cytotoxicity can damage both cell structure<br />
and function. Almost all cellular structures and pathways are<br />
involved in cell proliferation and therefore, determination of the<br />
cell count is a very sensitive indicator of cell stress [O`Brian et al.,<br />
2006]. All three compounds examined here cause significant<br />
decrease in cell count. The sensitivity of this readout is<br />
demonstrated by the very low EC 50<br />
values (Figure 3 A).<br />
Mitochondria are essential for the life of eukaryotic cells and their<br />
responses to toxic impact depend on the type of compound, on<br />
its concentration and on the specific mitochondrial function that<br />
is affected. Here, higher mitochondrial respiration leads to<br />
enhanced biogenesis of mitochondria, which results in increasing<br />
mitochondrial mass after 24 h treatment with each compound<br />
[O`Brian et al., 2006] (Figure 3 B).<br />
2
Nuclear shrinkage and condensation as a result of toxic impact<br />
on cells typically occurs with cell injury. When cells were treated<br />
with FCCP and Tacrine, we observed a dose-dependent<br />
reduction in nuclear size to half of the initial value (Figure 3 C).<br />
This morphological change was accompanied by nuclear<br />
condensation, as determined by increasing nuclear intensity<br />
(Figure 3 D). AAP treatment initially results in a swelling of the<br />
nuclei, caused most probably by compound induced necrosis,<br />
prior to nuclear shrinkage (as described by Mirochnitchenko<br />
et al., 1999). The intensity of the nuclei correlates to the nuclear<br />
size; large nuclei show low intensities and small nuclei show high<br />
intensities (Figure 3 C and 3 D).<br />
A<br />
B<br />
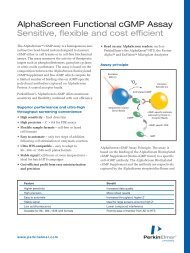
<strong>Cell</strong> membrane integrity is a well-known and common indicator<br />
of cell viability. Here, we measured membrane disruption by<br />
quantifying the influx of an extracellular dye, BOBO-3<br />
(Figure 4). As loss of membrane integrity is a late-stage effect of<br />
cytotoxicity, the EC 50<br />
values calculated by this readout<br />
(Figure 4) are considerably higher than the EC 50<br />
values of all<br />
other readouts (Figure 3 A-D).<br />
A<br />
C<br />
Control 1 mM Tacrine<br />
B<br />
Figure 4. A | False color overlay of<br />
untreated and 1 mM Tacrine treated<br />
cells, showing Hoechst (blue) and<br />
BOBO-3 (green) stained nuclei. <strong>Cell</strong>s<br />
with intact membranes show Hoechst<br />
staining only (left). Loss of membrane<br />
integrity allows the cell-impermeant dye<br />
BOBO-3 to enter the cells and binding<br />
to the DNA (right). B | Dose-response<br />
curves for FCCP and Tacrine deduced<br />
from membrane permeability, show a<br />
significant increase. The cell membrane<br />
disruption caused by high AAP<br />
concentrations is marginal. N = 3 wells.<br />
D<br />
Conclusions<br />
The detection of compound cytotoxicity is an essential part of drug<br />
discovery. Here, we present an in vitro cytotoxicity approach <strong>using</strong><br />
HepG2 cells, which are used as an effective indicator of the human<br />
hepatotoxicity potential of test compounds.<br />
The High Content Analysis approach presented here is a rapid and<br />
robust live cell assay to determine multiple cytotoxic effects<br />
simultaneously. Furthermore, this assay detects early as well as latestage<br />
occurrences of cytotoxicity, as the calculated EC 50<br />
values<br />
clearly demonstrated. Moreover, this HCA approach enables<br />
flexibility of assay design for adding or replacing an organelle dye.<br />
Figure 3. Compound-generated dose-response curves deduced from cell<br />
count (A), mitochondrial mass (B), nuclear area (C) and nuclear<br />
intensity (D).<br />
A | The effects of cytotoxicity on cell proliferation are similar for all three<br />
tested compounds; a significant loss of cells was observed with increasing<br />
concentrations of each compound. B | Compound treatment of HepG2<br />
cells leads to an increase in mitochondrial mass caused by enhanced<br />
biogenesis of mitochondria. C/D | The phenotypic changes induced by<br />
FCCP and Tacrine manifests in nuclear shrinkage accompanied by<br />
nuclear condensation. AAP treatment initially causes nuclear swelling<br />
prior to nuclear shrinkage and condensation. N = 3 wells.<br />
3
1 FCCP is a very potent uncoupler of oxidative phosphorylation in mitochondria, which<br />
functions by degrading the link between the respiratory chain and the phosphorylation system<br />
used to generate ATP.<br />
2 Tacrine is a parasympathomimetic and centrally acting cholinesterase inhibitor used in the<br />
treatment of Alzheimer`s disease. The isozyme cytochrome P450 is involved with the<br />
metabolism of Tacrine in the liver, resulting in an active metabolite, which is associated with a<br />
high frequency of hepatotoxicity.<br />
3 Acetaminophen (AAP) is a widely-used analgesic and antipyretic. It is well-known that it<br />
causes potentially fatal liver damage and hepatic necrosis if overdosed. The toxic effect of<br />
Acetaminophen is primarily due to a highly-reactive intermediary metabolite (NAPQI).<br />
NAPQI is metabolized via the hepatic cytochrome P450 enzyme system and at usual doses<br />
quickly detoxified by conjugation with glutathione.<br />
References<br />
Abraham VC, Towne DL, Waring JF, Warrior U, Burns DJ (2008):<br />
Application of a High Content Multiparameter <strong>Cytotoxicity</strong> Assay to<br />
Prioritize Compounds Based on Toxicity Potential in Humans. Journal<br />
of Biomolecular Screening 13 (6), 527-537.<br />
Mirochnitchenko O, Weisbrot-Lefkowitz M, Reuhl K, Chen L,Yang C,<br />
Inouye M (1999): Acetaminophen Toxicity. The Journal of Biological<br />
Chemistry 274 (15), 10349-10355<br />
O`Brian P, Haskins R (2006): In Vitro <strong>Cytotoxicity</strong> Assessment. Book<br />
Title: High Content Screening: A Powerful Approach to Systems <strong>Cell</strong><br />
Biology and Drug Discovery. Methods in Molecular Biology 356, 415-<br />
425.<br />
Authors<br />
Judith Lucke<br />
Eleni Mumtsidu<br />
<strong>PerkinElmer</strong><br />
<strong>Cell</strong>ular Technologies Germany GmbH<br />
<strong>Cell</strong>ular Imaging & Analysis<br />
Hamburg, DE<br />
<strong>PerkinElmer</strong>, Inc.<br />
940 Winter Street<br />
Waltham, MA 02451 USA<br />
P: (800) 762-4000 or<br />
(+1) 203-925-4602<br />
www.perkinelmer.com<br />
For a complete listing of our global offices, visit www.perkinelmer.com/ContactUs<br />
Copyright ©2009, <strong>PerkinElmer</strong>, Inc. All rights reserved. <strong>PerkinElmer</strong> ® is a registered trademark and Harmony TM and Operetta TM are trademarks of <strong>PerkinElmer</strong>, Inc. Hoechst 33342 and Bobo TM -3 are trademarks and MitroTracker ® Deep Red<br />
is a registered trademark of Invitrogen Corporation. All other trademarks are the property of their respective owners. <strong>PerkinElmer</strong> reserves the right to change this document at any time without notice and disclaims liability for editorial,<br />
pictorial or typographical errors.<br />
008605_02