A Multiparametric Live-Cell Cytotoxicity analysis using ... - PerkinElmer
A Multiparametric Live-Cell Cytotoxicity analysis using ... - PerkinElmer
A Multiparametric Live-Cell Cytotoxicity analysis using ... - PerkinElmer

Create successful ePaper yourself
Turn your PDF publications into a flip-book with our unique Google optimized e-Paper software.
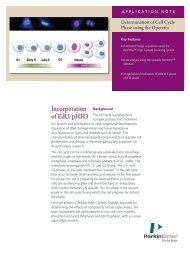
Application<br />
To study in vitro cytotoxicity <strong>using</strong> a High Content Screening<br />
approach, we treated HepG2 cells with FCCP 1 , Tacrine 2 or<br />
AAP 3 . The cells were seeded at a density of 5000 cells / well in<br />
384 Collagen I coated <strong>Cell</strong>Carrier microtiter plates and were<br />
cultured overnight. After 24 h incubation with each<br />
compound, cells were stained with a fluorophore dye-cocktail<br />
(diluted in growth medium), containing Hoechst, BOBO-3<br />
and MitoTracker® Deep Red. After 40 min incubation with<br />
the dye cocktail, measurement of the live-cells was performed<br />
on the Operetta equipped with a LWD 20x objective.<br />
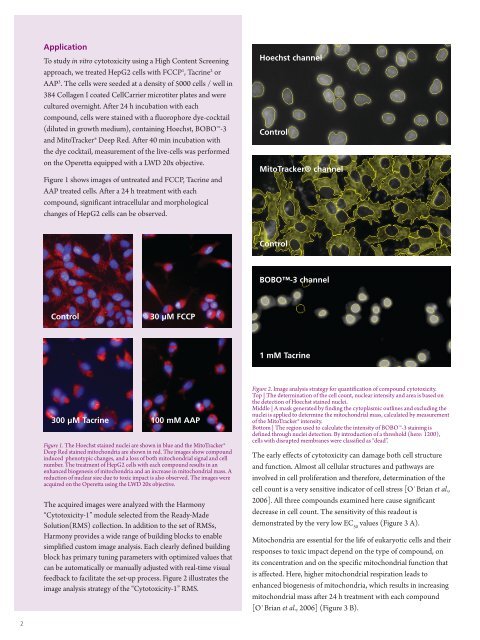
Figure 1 shows images of untreated and FCCP, Tacrine and<br />
AAP treated cells. After a 24 h treatment with each<br />
compound, significant intracellular and morphological<br />
changes of HepG2 cells can be observed.<br />
Hoechst channel<br />
Control<br />
MitoTracker® channel<br />
Control<br />
BOBO-3 channel<br />
Control 30 μM FCCP<br />
1 mM Tacrine<br />
300 μM Tacrine 100 mM AAP<br />
Figure 1. The Hoechst stained nuclei are shown in blue and the MitoTracker®<br />
Deep Red stained mitochondria are shown in red. The images show compound<br />
induced phenotypic changes, and a loss of both mitochondrial signal and cell<br />
number. The treatment of HepG2 cells with each compound results in an<br />
enhanced biogenesis of mitochondria and an increase in mitochondrial mass. A<br />
reduction of nuclear size due to toxic impact is also observed. The images were<br />
acquired on the Operetta <strong>using</strong> the LWD 20x objective.<br />
The acquired images were analyzed with the Harmony<br />
“<strong>Cytotoxicity</strong>-1” module selected from the Ready-Made<br />
Solution(RMS) collection. In addition to the set of RMSs,<br />
Harmony provides a wide range of building blocks to enable<br />
simplified custom image <strong>analysis</strong>. Each clearly defined building<br />
block has primary tuning parameters with optimized values that<br />
can be automatically or manually adjusted with real-time visual<br />
feedback to facilitate the set-up process. Figure 2 illustrates the<br />
image <strong>analysis</strong> strategy of the “<strong>Cytotoxicity</strong>-1” RMS.<br />
Figure 2. Image <strong>analysis</strong> strategy for quantification of compound cytotoxicity.<br />
Top | The determination of the cell count, nuclear intensity and area is based on<br />
the detection of Hoechst stained nuclei.<br />
Middle | A mask generated by finding the cytoplasmic outlines and excluding the<br />
nuclei is applied to determine the mitochondrial mass, calculated by measurement<br />
of the MitoTracker® intensity.<br />
Bottom | The region used to calculate the intensity of BOBO-3 staining is<br />
defined through nuclei detection. By introduction of a threshold (here: 1200),<br />
cells with disrupted membranes were classified as “dead”.<br />
The early effects of cytotoxicity can damage both cell structure<br />
and function. Almost all cellular structures and pathways are<br />
involved in cell proliferation and therefore, determination of the<br />
cell count is a very sensitive indicator of cell stress [O`Brian et al.,<br />
2006]. All three compounds examined here cause significant<br />
decrease in cell count. The sensitivity of this readout is<br />
demonstrated by the very low EC 50<br />
values (Figure 3 A).<br />
Mitochondria are essential for the life of eukaryotic cells and their<br />
responses to toxic impact depend on the type of compound, on<br />
its concentration and on the specific mitochondrial function that<br />
is affected. Here, higher mitochondrial respiration leads to<br />
enhanced biogenesis of mitochondria, which results in increasing<br />
mitochondrial mass after 24 h treatment with each compound<br />
[O`Brian et al., 2006] (Figure 3 B).<br />
2