The Democratic Domino Theory: An Empirical Investigation
The Democratic Domino Theory: An Empirical Investigation
The Democratic Domino Theory: An Empirical Investigation

You also want an ePaper? Increase the reach of your titles
YUMPU automatically turns print PDFs into web optimized ePapers that Google loves.
<strong>The</strong> <strong>Democratic</strong> <strong>Domino</strong> <strong>The</strong>ory: <strong>An</strong> <strong>Empirical</strong><br />
<strong>Investigation</strong><br />
Peter T. Leeson<br />
<strong>An</strong>drea M. Dean<br />
George Mason University<br />
West Virginia University<br />
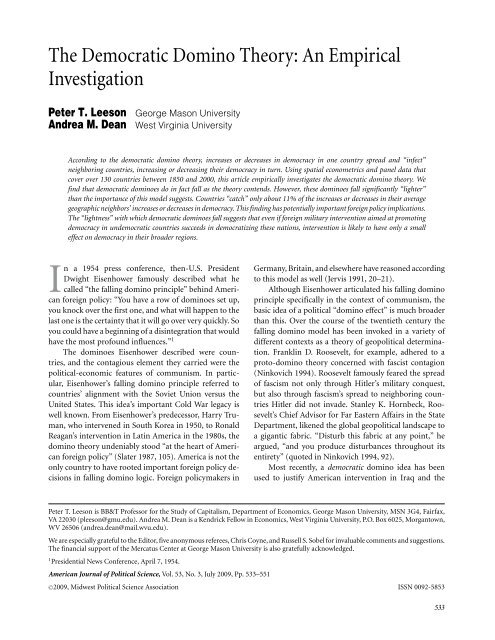
According to the democratic domino theory, increases or decreases in democracy in one country spread and “infect”<br />
neighboring countries, increasing or decreasing their democracy in turn. Using spatial econometrics and panel data that<br />
cover over 130 countries between 1850 and 2000, this article empirically investigates the democratic domino theory. We<br />
find that democratic dominoes do in fact fall as the theory contends. However, these dominoes fall significantly “lighter”<br />
than the importance of this model suggests. Countries “catch” only about 11% of the increases or decreases in their average<br />
geographic neighbors’ increases or decreases in democracy. This finding has potentially important foreign policy implications.<br />
<strong>The</strong> “lightness” with which democratic dominoes fall suggests that even if foreign military intervention aimed at promoting<br />
democracy in undemocratic countries succeeds in democratizing these nations, intervention is likely to have only a small<br />
effect on democracy in their broader regions.<br />
In a 1954 press conference, then-U.S. President<br />
Dwight Eisenhower famously described what he<br />
called “the falling domino principle” behind Americanforeignpolicy:“Youhavearowofdominoessetup,<br />
you knock over the first one, and what will happen to the<br />
last one is the certainty that it will go over very quickly. So<br />
you could have a beginning of a disintegration that would<br />
have the most profound influences.” 1<br />
<strong>The</strong> dominoes Eisenhower described were countries,<br />
and the contagious element they carried were the<br />
political-economic features of communism. In particular,<br />
Eisenhower’s falling domino principle referred to<br />
countries’ alignment with the Soviet Union versus the<br />
United States. This idea’s important Cold War legacy is<br />
well known. From Eisenhower’s predecessor, Harry Truman,<br />
who intervened in South Korea in 1950, to Ronald<br />
Reagan’s intervention in Latin America in the 1980s, the<br />
domino theory undeniably stood “at the heart of American<br />
foreign policy” (Slater 1987, 105). America is not the<br />
only country to have rooted important foreign policy decisions<br />
in falling domino logic. Foreign policymakers in<br />
Germany, Britain, and elsewhere have reasoned according<br />
to this model as well (Jervis 1991, 20–21).<br />
Although Eisenhower articulated his falling domino<br />
principle specifically in the context of communism, the<br />
basic idea of a political “domino effect” is much broader<br />
than this. Over the course of the twentieth century the<br />
falling domino model has been invoked in a variety of<br />
different contexts as a theory of geopolitical determination.<br />
Franklin D. Roosevelt, for example, adhered to a<br />
proto-domino theory concerned with fascist contagion<br />
(Ninkovich 1994). Roosevelt famously feared the spread<br />
of fascism not only through Hitler’s military conquest,<br />
but also through fascism’s spread to neighboring countries<br />
Hitler did not invade. Stanley K. Hornbeck, Roosevelt’s<br />
Chief Advisor for Far Eastern Affairs in the State<br />
Department, likened the global geopolitical landscape to<br />
a gigantic fabric. “Disturb this fabric at any point,” he<br />
argued, “and you produce disturbances throughout its<br />
entirety” (quoted in Ninkovich 1994, 92).<br />
Most recently, a democratic domino idea has been<br />
used to justify American intervention in Iraq and the<br />
Peter T. Leeson is BB&T Professor for the Study of Capitalism, Department of Economics, George Mason University, MSN 3G4, Fairfax,<br />
VA 22030 (pleeson@gmu.edu). <strong>An</strong>drea M. Dean is a Kendrick Fellow in Economics, West Virginia University, P.O. Box 6025, Morgantown,<br />
WV 26506 (andrea.dean@mail.wvu.edu).<br />
We are especially grateful to the Editor, five anonymous referees, Chris Coyne, and Russell S. Sobel for invaluable comments and suggestions.<br />
<strong>The</strong> financial support of the Mercatus Center at George Mason University is also gratefully acknowledged.<br />
1 Presidential News Conference, April 7, 1954.<br />
American Journal of Political Science, Vol. 53, No. 3, July 2009, Pp. 533–551<br />
C○2009, Midwest Political Science Association ISSN 0092-5853<br />
533
534 PETER T. LEESON AND ANDREA M. DEAN<br />
Middle East, which the New Republic called “the most<br />
important foreign policy decision in a generation” (Ackerman<br />
2006). According to George W. Bush, “<strong>The</strong> establishment<br />
of a free Iraq at the heart of the Middle East<br />
will be a watershed event in the global democratic revolution.”<br />
2 By improving democracy in Iraq, it is argued,<br />
American occupation will lead to falling dominoes that<br />
democratize the Middle East.<br />
Although the particular political-economic features<br />
of concern vary across renditions of the domino theory,<br />
the basic logic underlying domino-style reasoning is the<br />
same in each case. In this model, changes in one country’s<br />
political institutions spread to neighboring countries, affecting<br />
these countries’ political institutions similarly,<br />
which spreads to their neighbors, and so on. According<br />
to the democratic domino theory, for instance, increases<br />
in one nation’s democracy lead to increases in its neighbors’<br />
democracy, leading to increases in their neighbors’<br />
democracy, and so on. <strong>The</strong> result is greater democracy<br />
in the region and world. On the other hand, decreases in<br />
democracy in one country may also “infect” neighboring<br />
nations, reducing their democracy, which spreads to their<br />
neighbors, deteriorating global democracy.<br />
This article investigates evidence for the democratic<br />
domino theory. Despite this idea’s importance guiding<br />
global foreign affairs, relatively little research has investigated<br />
whether in fact changes in democracy spread<br />
between geographic neighbors as this theory hypothesizes.<br />
Indeed, surprisingly few papers directly address<br />
the domino theory as a general proposition at all. Several<br />
Cold War–era papers offer their judgments about<br />
whether domino effects will be important in one country<br />
or another and what the broader consequences of<br />
falling dominoes might be in particular nations (see, for<br />
instance, Murphy 1966; Viksnins 1974). A handful of others<br />
argue that the stakes of falling dominoes during the<br />
Cold War were exaggerated (see, for instance, Slater 1987;<br />
Walt 2000). Several papers that consider how the domino<br />
theory metaphor has affected countries’ foreign policy<br />
also exist (see, for instance, Shimko 1994).<br />
Understandably for the time it was written, much<br />
of this research focuses exclusively on Southeast Asia or<br />
confines itself to other “specific dominoes” rather than<br />
on the question of falling dominoes more generally (see,<br />
for instance, Silverman 1975). <strong>An</strong> important exception to<br />
this is the excellent collection of essays compiled by Jervis<br />
and Snyder (1991), which taken together more broadly<br />
2 “President Bush Discusses Freedom in Iraq and the Middle East.”<br />
Remarks to the National Endowment for Democracy at the United<br />
States Chamber of Commerce, November 6, 2003.<br />
consider the domino idea using case studies to examine a<br />
variety of countries and regions.<br />
More recently, a growing literature aims to empirically<br />
evaluate the idea of “democratic diffusion.” <strong>The</strong><br />
first author to systematically address this issue was Starr<br />
(1991), who used Poisson and hazard analysis to consider<br />
whether there may be regional or “neighborhood” effects<br />
of political regime transitions between 1974 and 1987.<br />
Following Starr, Ray (1995), Jaggers and Gurr (1995),<br />
and others considered global trends in democratization<br />
with a particular focus on the forces propelling what<br />
Huntington (1991) described as “the third wave” of democratization<br />
in his classic treatment that considered the<br />
growth of global democracy during the late twentieth century.<br />
O’Loughlin and colleagues’ insightful work marked<br />
an important new approach to empirically addressing<br />
democratic diffusion based on what the authors called a<br />
“spatial-diffusion framework” (1998, 545). <strong>The</strong> authors<br />
used this framework to examine the temporal and spatial<br />
features of democratic diffusion in the post-WWII<br />
period by “map[ping] and graph[ing] changes in the<br />
number and nature of political regimes” (545). Similarly,<br />
Gleditsch and Ward (2000) consider the spatial dynamics<br />
of democracy to investigate the question of whether<br />
democracies are more or less prone to war. More recently,<br />
Starr and Lindborg (2003) have extended Starr’s (1991)<br />
original analysis. <strong>The</strong>ir paper does not use spatial methods<br />
like the other recent scholarship in this area, but it<br />
does expand the time period under consideration to include<br />
data up to 1996. Finally, Gleditsch and Ward (2006)<br />
and Franzese and Hays (2008) have highlighted the importance<br />
of recognizing and explicitly modeling spatial<br />
dependence in empirical analyses concerned with investigating<br />
the spread of democracy.<br />
Despite this important research, as Starr and Lindborg<br />
point out, there are still “only a handful of studies<br />
directed to the ...possibility of [democratic] diffusion effects”<br />
(2003, 491), leaving a number of critical questions<br />
at least partially unanswered. To our knowledge, no one,<br />
for example, has empirically investigated the democratic<br />
domino theory including the nearly full century between<br />
1850 and the end of WWII. Further, although a few of<br />
the papers discussed above have considered general geographic<br />
and temporal correlations in the rise (and fall) of<br />
democracy throughout the world, no one to our knowledge<br />
has actually estimated the rate at which democracy<br />
spreads between countries, if in fact it does so as the<br />
democratic domino theory and some of the initial research<br />
discussed above suggest. In particular, still missing<br />
from the literature is an investigation of the equilibrium<br />
effects of democracy’s spread—i.e., an estimate of the percentage<br />
of changes in democracy countries “catch” from
DEMOCRATIC DOMINO THEORY 535<br />
their geographic neighbors once the inflow and outflow<br />
of democracy changes to and from their neighbors have<br />
been fully accounted for.<br />
Thus, several key questions surrounding the democratic<br />
domino theory’s validity remain. Does democracy<br />
spread, both historically and today? If so, to what extent?<br />
Does democracy spread with the same strength (or<br />
weakness) going back to 1850, in the post-WWII period,<br />
more recently? Could democratizing key countries in undemocratic<br />
portions of the world really lead to greater<br />
democracy in the region and beyond, as American policy<br />
leaders such as George W. Bush have argued?<br />
This article explores these questions by using spatial<br />
econometric methods designed specifically to identify<br />
and measure spatial interdependences, such as the<br />
democratic interdependency postulated by the democratic<br />
domino theory. Our analysis differs from much<br />
previous research that considers “democratic diffusion”<br />
both in its reliance on spatial methods and also because<br />
of the kinds of results our methods deliver—namely, estimates<br />
of democracy’s equilibrium spread rate between<br />
neighbors. To investigate the democratic domino theory<br />
we estimate both spatial autoregressive (SAR) and spatial<br />
error (SEM) models using panel data that span more than<br />
130 countries for the century and a half between 1850 and<br />
2000.<br />
Our results suggest that democracy does in fact spread<br />
as the democratic domino theory contends. However,<br />
democratic dominoes fall significantly “lighter” than foreign<br />
policy applications of this principle pretend. Countries<br />
“catch” only about 11% of their average geographic<br />
neighbors’ changes in democracy. This finding has potentially<br />
important foreign policy implications. <strong>The</strong> “lightness”<br />
with which democratic dominoes fall suggests that<br />
even if foreign military intervention aimed at promoting<br />
democracy in undemocratic countries succeeds in democratizing<br />
these nations, intervention is likely to have<br />
only a small effect on democracy in their broader regions.<br />
This article limits itself to an investigation of the<br />
democratic domino theory—that is, to democratic contagion,<br />
as opposed to other forms of political contagion<br />
also based on domino thinking, such as communist contagion,<br />
or countries’ political alignment with major superpowers,<br />
discussed above. Further, our analysis exclusively<br />
considers the geographic spread of democracy. In most<br />
variations of the domino theory, including the specifically<br />
democratic manifestation propounded most recently by<br />
the U.S. government with respect to the Middle East that<br />
this article explores, geography plays a critical role in this<br />
spread. However, nongeographic domino-type theories<br />
are also possible, and democracy may spread through<br />
other channels unrelated to geography.<br />
Potential Mechanisms of <strong>Democratic</strong><br />
<strong>Domino</strong>es<br />
Simmons, Dobbin, and Garrett (2006) identify four potential<br />
mechanisms, or channels, through which democracy<br />
may spread between countries. Although these<br />
authors are not specifically concerned with a geographybased<br />
domino idea as we are, the mechanisms they identify<br />
are all plausible candidates for geographic democratic<br />
contagion. <strong>The</strong> first such channel is simple Tiebout competition.<br />
Although the transactions costs of migration<br />
are nontrivial between nations and can be very high in<br />
countries that strictly limit mobility, competition between<br />
governments can create strong incentives for geographic<br />
neighbors to increase democratic constraints,<br />
leading prodemocracy changes to spread throughout geographic<br />
regions. If a country strengthens its democracy,<br />
for instance by institutionalizing greater constraints on<br />
executive authority, it is likely to attract additional foreign<br />
business and direct investment as agents seek the<br />
most secure locations to undertake economic activity. 3<br />
<strong>The</strong> firms and citizens that find this move the least costly<br />
are those in neighboring nations that share a border with<br />
the democratizing country. <strong>The</strong>ir movement or potential<br />
movement can pressure neighboring countries to undertake<br />
similar democracy-oriented reforms to avoid losing<br />
their tax base. If these nations’ neighbors in turn democratize<br />
to avoid losing their tax base to their democratizing<br />
neighbors, and so on, the resulting competition can<br />
lead to a contagion effect that creates greater democracy<br />
throughout a region of neighboring countries.<br />
A second potential mechanism of democracy’s spread<br />
between geographic neighbors is through the diffusion of<br />
prodemocracy ideas via a demonstration effect, or what<br />
Simmons, Dobbin, and Garrett call “learning.” Neighboring<br />
countries can observe the activities of the countries<br />
around them and import successful ideas at a lower cost<br />
than if they had to look further abroad to find them. If one<br />
country employs democracy-enhancing ideas, its geographic<br />
neighbors may become more likely to adopt them<br />
as well. Once these countries have adopted democracyenhancing<br />
ideas, their neighbors become more likely to<br />
adopt them, and so on. This process may cause a cascade of<br />
more democracy whereby increases in democracy in one<br />
country spread to countries around it. This “democracy<br />
demonstration effect” could also operate in conjunction<br />
3 Stronger constraints may have formal sources, such as legal<br />
changes, or informal ones, such as improved media monitoring<br />
of politicians’ behavior. On media’s role in this capacity, see, for instance,<br />
Coyne and Leeson (2004, 2009), Leeson and Coyne (2007),<br />
and Leeson (2008).
536 PETER T. LEESON AND ANDREA M. DEAN<br />
with a migration-style mechanism along the lines discussed<br />
above. Democracy advocates in one country, for<br />
example, may penetrate the borders of neighboring countries<br />
that are less democratic, carrying their ideas with<br />
them as well as providing the impetus for domestic<br />
prodemocratic reform.<br />
A third potential channel of democracy’s geographic<br />
spread is through economic communities or zones. As<br />
Pevehouse (2002a, 2002b) points out, economic communities<br />
such as NAFTA and the EU often harmonize<br />
not only their members’ economic policies, but also their<br />
members’ political arrangements, in some cases requiring<br />
members to satisfy certain institutional requirements<br />
as a condition of membership. In many cases admission<br />
to these communities confers benefits on members in the<br />
form of cross-country subsidization, protection alliances,<br />
and so forth. <strong>The</strong>se benefits raise the value of joining<br />
economic zones, creating an incentive for nonmember<br />
nations to increase their level of democracy if, for example,<br />
membership requires institutional constraints that<br />
directly or indirectly serve to limit the executive’s authority.<br />
Since economic communities are often geographically<br />
based, their presence may in this way produce spreading<br />
democracy throughout a region of neighboring countries.<br />
<strong>The</strong> final potential mechanism of democratic contagion<br />
that Simmons, Dobbin, and Garrett highlight is<br />
what they call “emulation.” According to this idea, some<br />
“big player” countries, such as the United States, lead<br />
in terms of political institutions (and policies), which<br />
other countries then follow. If the United States strengthens<br />
its democracy in some fashion, other countries may<br />
do so as well. Like the other channels considered above,<br />
this channel need not be a geographic mechanism of<br />
spreading democracy. If, for instance, Argentina follows<br />
prodemocracy reform in the United States, democracy<br />
may spread but not between geographic neighbors. However,<br />
within various geographic regions there may be local<br />
“big players”—regional leader countries—that neighboring<br />
nations tend to look to in guiding their behavior. In<br />
this way emulation may also be a geographic channel for<br />
democratic dominoes between neighboring countries.<br />
<strong>The</strong>se are only a few of the imaginable mechanisms<br />
through which democratic dominoes might be set in motion.<br />
Surely others could be proposed. Further, while in<br />
principle some of these channels, such as emulation, may<br />
be capable of spreading either increases or decreases in<br />
democracy geographically, others, such as Tiebout competition,<br />
may only be capable of spreading increases in<br />
democracy geographically. Although these channels are<br />
conceptually distinct, separating them empirically is a<br />
different matter. Our interest is in identifying if there is<br />
in fact any significant empirical evidence for democratic<br />
dominoes regardless of their source and, if there is, establishing<br />
how “hard” they fall. It is not our goal, nor<br />
does our empirical strategy allow us, to identify which, if<br />
any, of the specific potential channels of democracy’s geographic<br />
spread have or have not been at work at various<br />
points in history. Although it does not do so in a spatial<br />
econometric framework and is not focused only on<br />
democracy, some existing research has found evidence for<br />
various kinds of “policy diffusion” via each of the channels<br />
pointed to above (see, for instance, Elkins, Guzman,<br />
and Simmons 2006; Gleditsch and Ward 2006; Lee and<br />
Strang 2006; Swank 2006). Future work should attempt to<br />
pinpoint the operation of these and other specific mechanisms<br />
explicitly in the context of the spatial framework<br />
this article employs.<br />
Data and <strong>Empirical</strong> Strategy<br />
Our basic empirical strategy, discussed in detail below, follows<br />
Leeson and Sobel (2007), who investigate “capitalist<br />
contagion” between neighboring countries. We search for<br />
spatial dependence in changes in democracy across geographic<br />
neighbors over time. To do this we construct a<br />
panel of democracy scores for four different time periods:<br />
1851–2001, 1901–2001, 1951–2001, and 1991–2001.<br />
We want to take advantage of the fact that international<br />
democracy scores are available going back to the start of<br />
the nineteenth century. However, the further back our<br />
sample goes the fewer countries it contains. Although<br />
democracy data extend back to 1800, they are only available<br />
for seven countries we can use and none of these<br />
countriesaregeographicneighbors.Thispreventsusfrom<br />
constructing a spatial weight matrix to estimate democracy’s<br />
spread between them. However, the data do permit<br />
us to consider a panel that extends back to 1850, which<br />
consequently constitutes our longest sample.<br />
Considering four different samples that cover different<br />
time periods allows us to maximize the number of<br />
years and number of countries our analysis considers. It<br />
also allows us to see if the process of democratic contagion<br />
described by the democratic domino theory may<br />
have been at work during certain periods but not others.<br />
Appendix A lists all of the countries in each of our<br />
samples. Each sample contains only those countries that<br />
exist from the first year of the sample under consideration<br />
until the last year in the sample. For example, a country<br />
that only came into being in, say, 1920, would not be<br />
included in the 1901–2001 sample. This is why our 1901–<br />
2001 sample, for instance, has fewer observations than<br />
our 1951–2001 sample. To generate spatial estimates, the
DEMOCRATIC DOMINO THEORY 537<br />
spatial weight matrix requires values for all countries in<br />
all years in the sample.<br />
Our data on democracy come from the Polity<br />
IV project (2004), which measures countries’ levels of<br />
democracy annually, beginning with 1850. This measure<br />
ranges from −10, or “total autocracy,” to +10, or “total<br />
democracy.” To measure the extent of democracy across<br />
countries, the Polity IV data consider the presence of<br />
political institutions and procedures through which citizens<br />
can express effective preferences about alternative<br />
policies and leaders and the existence of institutionalized<br />
constraints on the executive’s exercise of power. <strong>The</strong> resulting<br />
democracy measure captures the competitiveness<br />
of political participation, openness and competitiveness<br />
of executive recruitment, and constraints on the chief<br />
executive in each country. Polity IV has constructed a<br />
variable to measure these factors specifically for the purpose<br />
of time-series analysis, which makes each country’s<br />
democracy score comparable over time. We use this measure,<br />
called Polity 2, for our analysis.<br />
Our econometric analysis uses spatial methods,<br />
which are the most natural and effective way to reliably<br />
estimate the spread of democracy between geographic<br />
neighbors. Unlike Ordinary Least Squares, which produce<br />
biased estimates in the face of spatial correlation,<br />
spatial methods are designed specifically to identify and<br />
measure spatial dependence. This makes spatial methods<br />
ideally suited to investigate the democratic domino theory<br />
since, as Danilovic points out, the domino theory is<br />
“premised on this understanding of international events<br />
as spatially interdependent” (2001, 344). If there is strong<br />
spatial dependence between countries’ changes in democracy<br />
as the democratic domino theory contends, spatial<br />
methods will identify it and efficiently estimate this dependence.<br />
We use two spatial models for this purpose,<br />
a spatial autoregressive model (SAR) and a spatial error<br />
model (SEM). Each searches for spatial dependence in a<br />
different way.<br />
For readers unfamiliar with spatial methods it is useful<br />
to think of the SAR model as analogous to an autoregressive<br />
(AR) time-series model but with lags over<br />
geographic distances rather than time. So, for a country<br />
i, onespatiallagreferstoallofi’s contiguous geographic<br />
neighbors, two spatial lags refers to contiguous<br />
geographic neighbors of i’s neighbors (i’s neighbors that<br />
are two countries away), and so on.<br />
<strong>The</strong> SAR model specifies each country’s dependent<br />
variable, in our case changes in democracy, as a function<br />
of the weighted value of the changes in democracy in its<br />
neighbors. It models how explained changes in democracy<br />
spill over onto geographic neighbors. <strong>The</strong> SAR model<br />
allows potential democracy spillovers to flow multidirectionally<br />
rather than unidirectionally as it would in an AR<br />
time-series model. This is important since we are interestedinhowchangesindemocracymayflowintoandout<br />
of multiple countries, influencing the extent of democracy<br />
in each nation.<br />
<strong>The</strong> SEM model is analogous to the moving average<br />
(MA) time-series model for contiguous geographic<br />
neighbors, which includes a spatially correlated error<br />
structure. <strong>The</strong> SEM model specifies each country’s error<br />
term, in our case for changes in democracy, as a function<br />
of the weighted value of the changes-in-democracy error<br />
term of its geographic neighbors. It models how unexplained<br />
changes in democracy spill over onto geographic<br />
neighbors. Like the SAR model, the SEM model allows<br />
for multidirectional flows of influence rather than unidirectional<br />
flows as it would in an MA time-series model.<br />
Our SAR model takes the form:<br />
D t = + WD t + D t−5 + X + t<br />
where D t is an N × 1 vector that measures countries’<br />
changes in democracy between year t and year t − 4.<br />
We consider countries’ changes in democracy over fouryear<br />
periods to allow sufficient time for changes in countries’<br />
democracy to occur. D t −5 is an N × 1vectorthat<br />
measures countries’ lagged levels of democracy—i.e., the<br />
level of democracy that prevailed in each country the year<br />
immediately preceding the four-year period over which<br />
countries’ changes in democracy are calculated. X is an<br />
N × K matrix of exogenous variables, and t is an N × 1<br />
vector of IID random errors. 4<br />
We include countries’ lagged levels of democracy<br />
in order to control for as many factors as possible besides<br />
democratic contagion that might affect changes in<br />
democracy in its geographic neighbors. This variable accountsforthefactthatgeographicneighborsoftensharea<br />
similar colonial origin, legal origin, form of government,<br />
degree of ethnolinguistic fractionalization, and other such<br />
factors that tend to persist over time. It controls for any<br />
features of countries that contribute to their changes in<br />
democracy which were present the year before the period<br />
of tabulated change. <strong>The</strong> lagged democracy variable is also<br />
useful because it allows us to determine whether there is<br />
“democratic convergence” across countries. If countries<br />
with lower levels of democracy in the previous period<br />
grow faster in terms of democracy the following period,<br />
will be negative, suggesting democratic convergence. If<br />
countries with lower levels of democracy in the previous<br />
4 To estimate our SAR model we use the spatial estimation program<br />
for MATLAB from Jim LeSage’s “Econometrics Toolbox,” publicly<br />
available at http://www.spatial-econometrics.com/. We use<br />
the “sar” command, which implements a maximum likelihood<br />
estimation.
538 PETER T. LEESON AND ANDREA M. DEAN<br />
period grow slower in terms of democracy the following<br />
period, will be positive, suggesting “democratic<br />
divergence.”<br />
W is an N × N spatial weight matrix based on firstdegree<br />
contiguity (bordering geographic neighbors). For<br />
example, since the United States has two contiguous geographic<br />
neighbors, Canada and Mexico, each of these<br />
countries receives a weight of 1/2 in the spatial weight matrix,<br />
W, as America’s geographic neighbors. This feature<br />
of the model makes it ideal to test the democratic domino<br />
theory since, as Johnson points out, this theory explicitly<br />
“linked geography to politics by assuming that the political<br />
fate of ...a nation would inevitably affect the fate of<br />
contiguous nations in a continuous chain fashion” (1985,<br />
39). , our parameter of interest in the SAR model, is the<br />
spatial autoregressive coefficient. It measures the spread<br />
of changes in democracy between geographic neighbors.<br />
If democracy spreads as the democratic domino<br />
theory suggests, this coefficient should be positive and<br />
significant.<br />
Our SEM model takes the form:<br />
D t = + D t−5 + X + ε t ; Wε t + t<br />
where our parameter of interest is , the spatial autocorrelation<br />
coefficient, which measures the spread of democracy<br />
using the SEM model.<br />
One nice feature of the geography-based democratic<br />
domino theory for the purposes of empirical investigation<br />
is that, since it is geography-based, we do not need<br />
to worry about the potential for endogeneity bias. Geography<br />
is exogenous. Countries cannot choose their<br />
geographic location and are thus unable to affect who<br />
they have as geographic neighbors. This removes reverse<br />
causality as a concern for our spatial estimates.<br />
<strong>The</strong> biggest disadvantage of investigating the spread<br />
of democracy geographically is the question of how to<br />
deal with islands, which have no contiguous geographic<br />
neighbors. Because of this, in the full sample the geographic<br />
spatial weight matrix contains values of zero when<br />
predicting changes in democracy of islands. 5 We address<br />
this issue in two ways. First, we run our regressions on<br />
the entire sample treating islands as countries without<br />
neighbors and include a binary variable that controls for<br />
island status. Second, as a robustness check we estimate<br />
both spatial models excluding islands from the sample to<br />
5 <strong>The</strong> fact that islands have values of zero in W does not pose a<br />
problem for performing our estimation because W does not enter<br />
directly into the regression. W, recall, is multiplied by D t in the<br />
SAR model, and by t in the SEM model. This matrix multiplication<br />
results in a column vector of values that enter the regression.<br />
In the case of an island, the value in the corresponding row of this<br />
column is zero. Of course, all of the nonislands represented in the<br />
other rows of this column will have nonzero values.<br />
ensure that treating islands this way does not affect our<br />
estimates. 6 <strong>The</strong> results of this robustness check are discussed<br />
in the sixth section, which performs a sensitivity<br />
analysis of our spatial regressions.<br />
Does Democracy Spread? <strong>The</strong><br />
Evidence at a Glance<br />
A preliminary look at the data lends support to the democratic<br />
domino theory. In Figure 1 we create four maps<br />
that display democracy in the world in four time periods<br />
that correspond to the first year in each of our four<br />
samples: 1850, 1900, 1950, and 1990. We color-code countries<br />
according to four democracy/autocracy categories:<br />
countries with democracy scores between −10 and −7<br />
(strong autocracies), those with scores between −6and0<br />
(weak autocracies), countries with scores between 1 and<br />
6 (weak democracies), and those with scores between 7<br />
and 10 (strong democracies). More democratic countries<br />
receive darker shading and less democratic countries receive<br />
lighter shading. <strong>The</strong> white countries are those for<br />
which we do not have democracy scores in certain years.<br />
Two features stand out in Figure 1. First, there is substantial<br />
geographic dependence in democracy. Consider,<br />
for example, democracy in the world in 1990. All of North<br />
America is highly democratic. So, too, are the countries<br />
of South America. All of the countries in Western Europe<br />
are highly democratic, while Central Europe is more<br />
weakly democratic, and the countries of Eastern Europe<br />
are quite undemocratic. Africa is a bit more mixed, but<br />
even here democracy displays strong geographic dependence.<br />
<strong>The</strong> southernmost part of Africa is quite democratic;<br />
the northern region is less democratic than these<br />
countries; and the vast majority of the rest of the continent<br />
is highly undemocratic.<br />
<strong>The</strong> second feature that stands out in Figure 1 is that<br />
changes in democracy over time also display significant<br />
geographic dependence. Consider, for example, the pattern<br />
in the southern part of South America over time.<br />
Figure 1 clearly shows democracy increasing together in<br />
the countries in this region as one moves from the map<br />
for 1950 to the map for 1990 and creeping throughout<br />
the rest of the continent as well. A similar pattern exists<br />
among the nations of Central Europe. Between 1950, in<br />
the throws of the Cold War, and 1990, when communism<br />
6 Because of some missing observations, our sample includes a small<br />
number of “data islands”—countries that have contiguous geographic<br />
neighbors for which data are not available. Our empirical<br />
analysis treats these the same as actual islands.
DEMOCRATIC DOMINO THEORY 539<br />
is collapsing, democracy is clearly increasing among<br />
neighboring countries in this region together.<br />
In the graphics, at least, there is some support for the<br />
democratic domino theory. Regions, rather than isolated<br />
countries, are typically democratic, moderately democratic,<br />
or undemocratic. Furthermore, the most notable<br />
changes in democracy over time appear to occur in bordering<br />
countries, which move together as the democratic<br />
domino theory suggests.<br />
Benchmark Results<br />
While the visual evidence is intriguing, to determine if<br />
democracy spreads as the democratic domino theory contends,<br />
we need to isolate the spread of democracy between<br />
nations econometrically. We begin this task with<br />
our simplest spatial model, which looks for spatial dependence<br />
in changes in democracy between geographic<br />
FIGURE 1<br />
Evidence for the <strong>Democratic</strong> <strong>Domino</strong> <strong>The</strong>ory at a Glance<br />
continued
540 PETER T. LEESON AND ANDREA M. DEAN<br />
FIGURE 1<br />
Continued<br />
neighbors, controlling only for island status. Table 1 contains<br />
our results using our longest sample, which covers<br />
the years between 1851 and 2001. <strong>The</strong> left panel of this<br />
table presents our results using the SAR model, and the<br />
right panel presents our results using the SEM model. In<br />
both panels the first column contains this stripped-down<br />
specification.<br />
<strong>The</strong> spatial coefficients in both models are highly<br />
significant, confirming the strong presence of spatial dependence<br />
in changes in democracy between geographic<br />
neighbors suggested by Figure 1. Unadjusted, a country,<br />
i, whose geographic neighbors on average experience<br />
a one-unit larger increase in democracy than the geographic<br />
neighbors of some other country, j, experiences
DEMOCRATIC DOMINO THEORY 541<br />
TABLE 1 <strong>The</strong> Spread of Democracy, 1851–2001<br />
SAR<br />
SEM<br />
1 2 3 4 1 2 3 4<br />
Rho 0.085 ∗∗∗ 0.078 ∗∗∗ 0.021 ∗∗∗ 0.019 ∗∗∗<br />
(4.660) (4.518) (6.812) (6.466)<br />
Lambda 0.082 ∗∗∗ 0.111 ∗∗∗ 0.008 ∗∗∗ 0.046 ∗∗<br />
(4.560) (15.114) (3.296) (2.224)<br />
Lagged Democracy −0.134 ∗∗∗ −0.336 ∗∗∗ −0.142 ∗∗∗ −0.340 ∗∗∗<br />
Level (15.090) (2.093) (15.701) (26.074)<br />
Constant 0.325 ∗∗∗ 0.439 ∗∗∗ 0.677 1.111 ∗∗ 0.341 ∗∗∗ 0.460 ∗∗∗ 0.685 1.126 ∗∗<br />
(5.157) (7.135) (1.164) (2.093) (5.143) (7.002) (1.174) (2.078)<br />
Log-likelihood −7873.617 −7763.512 −7766.457 −7456.674 −7873.817 −7756.204 −7767.091 −7454.800<br />
R-squared 0.001 0.061 0.068 0.225 0.009 0.077 0.068 0.227<br />
Observations 3358 3358 3358 3358 3358 3358 3358 3358<br />
Notes: Dependent variable: change in democracy (t-statistics in parentheses). Spatial weight matrix: first-order contiguity. ∗∗∗ = 1%,<br />
∗∗ = 5%, ∗ = 10%. Variable included but not reported: island dummy in columns 1 and 2. Columns 3 and 4 include year and country<br />
fixed effects.<br />
a 0.085-unit larger increase in democracy than j. Itdoes<br />
not matter whether we use the SAR or SEM model, which<br />
deliver nearly identical estimates. If one cut a hole in a<br />
map that contained no countries’ names but instead only<br />
their changes in democracy, he could predict the missing<br />
country’s movement in democracy by taking 8.5% of the<br />
average change in democracy in its geographic neighbors<br />
and adding it to the constant in row four.<br />
In the second column of both panels we control for<br />
countries’ lagged levels of democracy. <strong>The</strong> coefficient on<br />
lagged democracy is negative and highly significant, suggesting<br />
there has been “democratic convergence” globally<br />
since 1850. More democratic countries experience<br />
smaller increases in democracy over time than less democratic<br />
countries. Further, controlling for lagged democracy<br />
generates similar spatial coefficients to those above<br />
in both models. In the SAR model the spatial coefficient<br />
falls slightly, and in the SEM model it rises slightly. Countries<br />
“catch” between 8 and 11% of the average change in<br />
democracy in their geographic neighbors.<br />
Columns 3 and 4 replicate columns 1 and 2, only<br />
here we include a comprehensive set of year and country<br />
fixed effects. Our year fixed effects control for any features,<br />
such as global business cycles, oil shocks, etc., that<br />
are common across countries but vary across time. Our<br />
country fixed effects control for any permanent differences<br />
across countries that might be important in contributing<br />
to their changes in democracy over time. 7 Column<br />
3 contains our stripped-down specification; column<br />
7 <strong>An</strong> earlier version of this article used continent dummies to control<br />
for potentially important “geographic effects.” Here, we take a more<br />
comprehensive and informative, albeit admittedly still imperfect,<br />
4 controls for lagged levels of democracy. Including twoway<br />
fixed effects has an important influence on our estimates<br />
of democracy’s spread rate. In both specifications<br />
in both models this spread rate drops significantly. Using<br />
the SAR model, countries “catch” only about 2% of the<br />
average change in democracy in their geographic neighbors.<br />
Using the SEM model, countries “catch” between 1<br />
and 5% of this change. <strong>The</strong>se results are highly significant<br />
but democratic contagion is considerably smaller.<br />
Table 2 considers the same eight specifications for<br />
the sample that covers the years between 1901 and 2001.<br />
<strong>The</strong> democratic contagion described by the democratic<br />
domino theory is as prominent looking only at the twentieth<br />
century as it is considering the period from 1851<br />
to 2001, and in fact is a bit stronger. Without fixed effects<br />
democracy spreads at a rate of about 11% between<br />
neighbors. When fixed effects are included democracy’s<br />
spread rate again falls, here to about 5%. However, in<br />
the two-way fixed effects specification for the SEM model<br />
that also controls for lagged levels of democracy, democracy’s<br />
spread rate regains its former strength of about<br />
12%. Compared to the estimates from the previous sample,<br />
which extended back to the midnineteenth century,<br />
the estimates in Table 2 suggest that democratic dominoes<br />
have fallen somewhat “harder” in the twentieth century<br />
but that their force has remained modest.<br />
Table 3 considers the period between 1951 and 2001,<br />
which delivers results very similar to those for the period<br />
between 1901 and 2001. In the specifications without<br />
approach to this that controls for country fixed effects, income,<br />
income growth, and lagged democracy.
542 PETER T. LEESON AND ANDREA M. DEAN<br />
TABLE 2 <strong>The</strong> Spread of Democracy, 1901–2001<br />
SAR<br />
SEM<br />
1 2 3 4 1 2 3 4<br />
Rho 0.107 ∗∗∗ 0.107 ∗∗∗ 0.058 ∗∗∗ 0.050 ∗∗∗<br />
(14.375) (14.353) (10.841) (10.020)<br />
Lambda 0.107 ∗∗∗ 0.109 ∗∗∗ 0.050 ∗∗∗ 0.118 ∗∗∗<br />
(14.377) (14.514) (10.084) (6.086)<br />
Lagged Democracy 0.088 ∗∗∗ −0.395 ∗∗∗ 0.091 ∗∗∗ −0.413 ∗∗∗<br />
Level (9.141) (26.454) (9.195) (26.765)<br />
Constant 0.389 ∗∗∗ 0.210 ∗∗ 0.647 1.452 ∗∗∗ 0.436 ∗∗∗ 0.250 ∗∗ 0.696 1.545 ∗∗∗<br />
(4.460) (2.378) (1.062) (2.650) (4.457) (2.538) (1.119) (2.687)<br />
Log-likelihood −7046.508 −7005.320 −6954.528 −6640.991 −7046.507 −7004.821 −6955.726 −6630.105<br />
R-squared 0.015 0.043 0.073 0.252 0.015 0.043 0.072 0.261<br />
Observations 2910 2910 2910 2910 2910 2910 2910 2910<br />
Notes: Dependent variable: change in democracy (t-statistics in parentheses). Spatial weight matrix: first-order contiguity. ∗∗∗ = 1%,<br />
∗∗ = 5%, ∗ = 10%. Variable included but not reported: island dummy in columns 1 and 2. Columns 3 and 4 include year and country<br />
fixed effects.<br />
TABLE 3 <strong>The</strong> Spread of Democracy, 1951–2001<br />
SAR<br />
SEM<br />
1 2 3 4 1 2 3 4<br />
Rho 0.115 ∗∗∗ 0.113 ∗∗∗ 0.046 ∗∗ 0.051 ∗∗∗<br />
(17.848) (17.661) (2.462) (12.046)<br />
Lambda 0.114 ∗∗∗ 0.143 ∗∗∗ 0.045 ∗∗ 0.096 ∗∗∗<br />
(17.768) (19.536) (2.421) (16.311)<br />
Lagged Democracy −0.115 ∗∗∗ −0.451 ∗∗∗ −0.127 ∗∗∗ −0.461 ∗∗∗<br />
Level (14.145) (29.404) (15.006) (29.931)<br />
Constant 0.566 ∗∗∗ 0.648 ∗∗∗ 0.396 −0.475 0.639 ∗∗∗ 0.729 ∗∗∗ 0.470 −0.399<br />
(7.967) (9.364) (0.593) (0.792) (7.963) (9.068) (0.694) (0.643)<br />
Log-likelihood −7883.809 −7786.702 −7697.653 −7313.806 −7883.806 −7776.659 −7697.823 −7305.073<br />
R-squared 0.018 0.074 0.119 0.302 0.018 0.083 0.119 0.308<br />
Observations 3290 3290 3290 3290 3290 3290 3290 3290<br />
Notes: Dependent variable: change in democracy (t-statistics in parentheses). Spatial weight matrix: first-order contiguity. ∗∗∗ = 1%,<br />
∗∗ = 5%, ∗ = 10%. Variable included but not reported: island dummy in columns 1 and 2. Columns 3 and 4 include year and country<br />
fixed effects.<br />
fixed effects democracy’s spread rate hovers around 11–<br />
14%. When fixed effects are included democracy’s spread<br />
rate again falls to about 5%. Similarly, as in Table 2, here<br />
also the SEM model that includes fixed effects and controls<br />
for lagged levels of democracy produces a larger<br />
estimate consistent with the specifications that do not<br />
include fixed effects.<br />
Table 4 presents our results using our most recent<br />
sample, which covers the years between 1991 and 2001.<br />
Depending upon the model and specification one looks<br />
at, democracy’s spread rate is between 10 and 17%. Including<br />
year and country fixed effects again reduces this<br />
significantly, here to between 1.4 and 3.5%. When we<br />
control for lagged levels of democracy in column 4 we<br />
get similar, though slightly smaller, results to those above.<br />
Democracy spreads at a rate of between 3 and 4%. In<br />
column 3, however, which includes two-way fixed effects<br />
but does not control for lagged levels of democracy, for<br />
the first time our spatial coefficient loses its significance.<br />
<strong>The</strong> results in Tables 1–4 find significant spatial dependence<br />
in changes in democracy between neighboring<br />
nations. <strong>The</strong> basic principle described by the democratic<br />
domino theory appears to be valid. However, our<br />
estimates also indicate that the strength with which
DEMOCRATIC DOMINO THEORY 543<br />
TABLE 4 <strong>The</strong> Spread of Democracy, 1991–2001<br />
SAR<br />
SEM<br />
1 2 3 4 1 2 3 4<br />
Rho 0.135 ∗∗∗ 0.097 ∗∗∗ 0.014 0.028 ∗∗∗<br />
(3.602) (7.864) (0.288) (4.329)<br />
Lambda 0.132 ∗∗∗ 0.169 ∗∗∗ −0.018 0.036 ∗∗∗<br />
(3.559) (4.636) (0.255) (5.051)<br />
Lagged Democracy −0.187 ∗∗∗ −0.153 ∗∗∗ −0.207 ∗∗∗ −0.152 ∗∗∗<br />
Level (11.927) (5.490) (12.139) (8.612)<br />
Constant 0.839 ∗∗∗ 1.186 ∗∗∗ −5.348 ∗∗∗ −6.058 ∗∗∗ 0.970 ∗∗∗ 1.320 ∗∗∗ −5.441 ∗∗∗ −6.243 ∗∗∗<br />
(6.413) (9.942) (7.047) (7.677) (6.713) (9.247) (5.482) (8.612)<br />
Log-likelihood −2232.099 −2166.390 −1477.112 −1458.236 −2232.099 −2160.803 −1477.065 −1458.096<br />
R-squared 0.023 0.145 0.940 0.943 0.022 0.163 0.940 0.943<br />
Observations 945 945 945 945 945 945 945 945<br />
Notes: Dependent variable: change in democracy (t-statistics in parentheses). Spatial weight matrix: first-order contiguity. ∗∗∗ = 1%,<br />
∗∗ = 5%, ∗ = 10%. Variable included but not reported: island dummy in columns 1 and 2. Columns 3 and 4 include year and country<br />
fixed effects.<br />
democratic dominoes fall has been overstated by those<br />
who have reasoned according to domino effect logic. Although<br />
his comments referred specifically to communist<br />
as opposed to democratic dominoes, President Eisenhower,<br />
for example, argued that dominoes “go over very<br />
quickly” and, when falling in an undesirable direction,<br />
create a “disintegration that would have the most profound<br />
influences.” 8 A spread rate of approximately 11%<br />
(and only about half this size or smaller if we use the<br />
estimates that include two-way fixed effects) is hardly<br />
one that could be described as leading political dominoes<br />
to “go over very quickly” and is not one capable<br />
of producing “the most profound influences.” Perhaps<br />
communist dominoes fall far “harder” than democratic<br />
ones. But democratic dominoes, at least, do not generate<br />
impressive spillover effects.<br />
To see this, consider a simple example, such as the<br />
United States, which has only two first-order contiguous<br />
geographic neighbors, Canada and Mexico. Between 1996<br />
and 2000 democracy in the United States and Canada did<br />
not measurably change and in Mexico increased from 4 to<br />
8, a positive four-unit democracy score change. <strong>The</strong> average<br />
change in democracy in North America was therefore<br />
1.33. Using the estimates from Tables 1–4 we can predict<br />
what the change in democracy would be in these countries<br />
and for North America as a whole if instead the United<br />
States became dramatically less democratic, falling to, say,<br />
the level of democracy in Iran over this four-year period,<br />
which was 3.<br />
8 Presidential News Conference, April 7, 1954.<br />
<strong>The</strong> equation for calculating the difference between<br />
Canada and Mexico’s current changes in democracy and<br />
their changes in democracy under this scenario is simply:<br />
∂F i = w i,j·∂F j . Using a democracy spread rate of<br />
0.11 from Tables 1–4, for Canada, this means its change in<br />
democracy would fall by: (0.11 × 1) × (3 − 10) =−0.77,<br />
making its new change in democracy: 0 − 0.77 =−0.77.<br />
For Mexico this operation is slightly more difficult because<br />
unlike Canada, which has only the United States as<br />
a neighbor, Mexico has three neighbors: the United States,<br />
Guatemala, and Belize. <strong>The</strong> presence of these additional<br />
neighbors softens the fall in Mexico’s democracy increase<br />
that would occur if American democracy fell to the level<br />
in Iran because having more neighbors dilutes the democracy<br />
contagion effect coming from any one neighbor. It is<br />
easy to see this when we calculate the change in Mexico’s<br />
democracy increase: (0.11 × (1/3)) × (3 − 10) =−0.257,<br />
which would make Mexico’s new change in democracy:<br />
4 − 0.257 = 3.74. If the United States had a decrease<br />
in democracy sufficient to make it as undemocratic as<br />
Iran, the average change in North American democracy<br />
would therefore be: (−7 − 0.77 + 3.47)/3 ≈−1.43. This<br />
amounts to a (1.33 −−1.43 = ) 2.76-unit overall reduction<br />
in North America’s average democracy score change<br />
over the period. To put the size of this effect in perspective,<br />
this democracy change decrease is slightly larger than the<br />
current difference in democracy between Mexico and the<br />
United States; slightly smaller than the current difference<br />
in democracy between Russia and the United States; and<br />
2.76 times larger than the current difference in democracy<br />
between France and the United States.
544 PETER T. LEESON AND ANDREA M. DEAN<br />
This effect is not negligible. But given the rather dramatic<br />
fall in democracy associated with the United States<br />
going from one of the most democratic countries in the<br />
world to as undemocratic as Iran, it is quite small. So,<br />
while our estimates indicate that there is a statistically significant<br />
democratic domino effect, its influence on overall<br />
regional democracy is modest. In large part this modesty<br />
stems from the fact that most countries have multiple<br />
neighbors. <strong>The</strong> more neighbors a country has, the more<br />
diluted is the positive or negative “wave” of democratic<br />
change spreading to it from any one neighbor, muting the<br />
“heft” with which democratic dominoes fall.<br />
Our calculation above is computed using a common<br />
spatial coefficient in Tables 1–4 based on the specifications<br />
that did not include year and country fixed effects, about<br />
0.11. If we use the estimates from the two-way fixed effects<br />
specifications, the relevant spatial coefficient is about 0.5<br />
(and even smaller in some specifications), which would<br />
reduce the already modest impact on North America’s<br />
average democracy score change to a 2.49-unit reduction.<br />
Indeed, even if we use the largest spatial coefficient from<br />
any specification in Tables 1–4 (0.17), the democratic<br />
domino effect remains small. In this case, if the United<br />
States fell in terms of democracy to the status of Iran,<br />
North America’s average democracy score change would<br />
fall by 2.86 units.<br />
Sensitivity <strong>An</strong>alysis<br />
In addition to estimating both SAR and SEM models for<br />
multiple samples covering different years, we take several<br />
further steps to ensure the robustness of our core result,<br />
which finds evidence for the democratic domino theory<br />
but suggests that the domino effect is not large. First, we<br />
try controlling for some potentially important domestic<br />
variables that may have an effect on countries’ changes in<br />
democracy. In particular we want to control for countries’<br />
income levels and income growth rates, since these may be<br />
important contributors to countries’ changes in democracy.<br />
In our benchmark regressions in Tables 1–4 we use<br />
a specification that controls for countries’ lagged levels<br />
of democracy to capture any slowly changing factors that<br />
contributed to countries’ previous levels of democracy<br />
and might impact their subsequent changes in democracy.<br />
However, both income and income growth can change<br />
more rapidly. Thus it may be important to control for<br />
these independently.<br />
Tables 5–7 report our results when we do this. Our<br />
GDP per capita (in 1990 Geary-Khamis dollars) and GDP<br />
per capita growth rate data are from Maddison’s dataset.<br />
Data limitations prevent us from estimating the sample<br />
that goes back to 1851. However, we are able to estimate<br />
our 1901–2001, 1951–2001, and 1991–2001 samples. We<br />
try estimating regressions that control only for countries’<br />
GDP per capita, only their GDP per capita growth rate,<br />
and both at the same time. <strong>The</strong> estimates presented in Tables<br />
5–7 include year and country fixed effects. However,<br />
we also reran each of these regressions excluding fixed<br />
effects and found virtually identical results. In the 1901–<br />
2001 sample our spatial estimates remain significant but<br />
drop to 0.01 regardless of the specification one looks at.<br />
In the 1951–2001 sample democracy’s spread rate rises<br />
to about 11%, again regardless of the specification one<br />
considers. Finally, in the 1991–2001 sample democracy’s<br />
estimated spread rate is between 10 and 13%, depending<br />
on the specification. <strong>The</strong> results in Tables 5–7 suggest<br />
that controlling for income and income growth rates does<br />
not matter much for our estimates. <strong>The</strong> estimated spread<br />
rate of democracy in these tables falls within the range<br />
of spread rates estimated in our benchmark regression<br />
in Tables 1–4. It should be emphasized that the modesty<br />
of the contagion effect even after controlling for these<br />
domestic covariates does not imply that the covariates’<br />
effect on countries’ changes in democracy is large or relatively<br />
important. Given the smallness of the coefficient<br />
on GDP per capita, for instance, our results suggest that<br />
even a very large change in income would not have a large<br />
influence on a country’s change in democracy. 9<br />
Second, to address the issue of islands raised above,<br />
which do not have contiguous geographic neighbors, we<br />
rerun all of our benchmark regressions for each of our<br />
four samples on a subsample that excludes islands. Since<br />
they are generally similar to those we find when we do<br />
not exclude islands from the sample, we do not report<br />
these results separately. In some specifications the spatial<br />
coefficient loses significance. But democracy’s spread rate<br />
tends to fall within the range of estimates generated in<br />
Tables 1–4. <strong>The</strong> exception to this is the sample that considers<br />
the period from 1951 to 2001, which is more sensitive<br />
to the exclusion of islands. In this sample, without<br />
islands, the spatial coefficient in the regressions without<br />
fixed effects rises to about 0.33. Notably, however, when<br />
fixed effects are included the spatial coefficient returns to<br />
a level consistent with the “normal” range of estimates<br />
9 This is true even after taking into account GDP per capita’s<br />
equilibrium effect. <strong>The</strong> precise size of this effect in a particular<br />
case will of course depend on the number of neighbors<br />
a country has. But roughly speaking, the spatial multiplier is<br />
(1 − 0.10) −1 = 1/0.9 = 1.11. <strong>The</strong> approximate equilibrium effect<br />
of GDP per capita, then, is only −0.001∗1.11 =−0.0011, which is<br />
very small.
DEMOCRATIC DOMINO THEORY 545<br />
TABLE 5 Controlling for GDP p/c and GDP p/c Growth Rate, 1901–2001<br />
SAR<br />
1 2 3 4 1 2 3 4<br />
Rho 0.011 ∗∗∗ 0.011 ∗∗∗ 0.011 ∗∗∗ 0.010 ∗∗∗<br />
(5.002) (5.011) (5.003) (5.011)<br />
Lambda 0.010 ∗∗∗ 0.011 ∗∗∗ 0.010 ∗∗∗ 0.010 ∗∗∗<br />
(4.799) (4.813) (4.797) (4.812)<br />
GDP p/c −0.001 −0.001 −0.001 −0.001<br />
(0.140) (0.143) (0.139) (0.140)<br />
GDP p/c −0.304 −0.306 −0.288 −0.289<br />
Growth Rate (0.099) (0.100) (0.092) (0.094)<br />
Constant 0.814 0.808 0.812 0.810 0.816 0.809 0.815 0.810<br />
(0.991) (0.985) (0.990) (0.989) (0.992) (0.988) (0.991) (0.990)<br />
Log- −5810.298 −5810.003 −5810.286 5810.001 −5810.298 −5810.004 −5810.285 −5810.002<br />
likelihood<br />
R-squared 0.001 0.001 0.001 0.001 0.001 0.001 0.001 0.001<br />
Observations 1843 1843 1843 1843 1843 1843 1843 1843<br />
Notes: Dependent variable: change in democracy (t-statistics in parentheses). Spatial weight matrix: first-order contiguity. ∗∗∗ = 1%,<br />
∗∗ = 5%, ∗ = 10%. Columns 1–4 include year and country fixed effects.<br />
SEM<br />
TABLE 6 Controlling for GDP p/c and GDP p/c Growth Rate, 1951–2001<br />
SAR<br />
1 2 3 4 1 2 3 4<br />
Rho 0.116 ∗∗∗ 0.113 ∗∗∗ 0.113 ∗∗∗ 0.107 ∗∗∗<br />
(6.682) (17.672) (17.674) (15.892)<br />
Lambda 0.114 ∗∗∗ 0.109 ∗∗∗ 0.108 ∗∗∗ 0.104 ∗∗∗<br />
(15.842) (17.583) (17.586) (15.998)<br />
GDP p/c −0.001 −0.001 −0.001 −0.001<br />
(0.370) (0.382) (0.369) (0.385)<br />
GDP p/c −4.385 ∗∗∗ −4.386 ∗∗∗ −4.395 ∗∗∗ −4.397 ∗∗∗<br />
Growth Rate (4.103) (4.103) (4.056) (4.057)<br />
Constant 0.825 ∗∗∗ 0.827 ∗∗∗ 0.859 ∗∗∗ 0.861 ∗∗∗ 0.826 ∗∗∗ 0.827 ∗∗∗ 0.860 ∗∗∗ 0.861 ∗∗∗<br />
(8.578) (7.781) (9.398) (7.884) (8.580) (7.784) (9.400) (7.885)<br />
Log- −7429.732 −7429.597 −7428.752 −7428.635 −7429.733 −7429.596 −7428.753 −7428.635<br />
likelihood<br />
R-squared 0.019 0.018 0.023 0.023 0.018 0.018 0.022 0.023<br />
Observations 3082 3082 3082 3082 3082 3082 3082 3082<br />
Notes: Dependent variable: change in democracy (t-statistics in parentheses). Spatial weight matrix: first-order contiguity. ∗∗∗ = 1%,<br />
∗∗ = 5%, ∗ = 10%. Columns 1–4 include year and country fixed effects.<br />
SEM<br />
in Tables 1–4, between 0.12 and 0.18, depending on the<br />
model and specification one considers.<br />
Third, we rerun all of our benchmark regressions for<br />
both models in each of our samples looking at countries’<br />
levels of democracy instead of their changes in democracy.<br />
Although the traditional rendering of the democratic<br />
domino theory clearly suggests that it is changes in<br />
democracy that spread between neighbors, considering<br />
levels is another way to evaluate the theory’s basic claim.<br />
We again do not report these results separately since they<br />
do not shed any new light on our question of interest<br />
and simply confirm our finding from above. In some of<br />
the fixed-effects specifications our coefficient of interest<br />
remains small and positive but loses significance. In<br />
our stripped-down specification that does not control for<br />
lagged levels of democracy the spatial coefficient is larger.
546 PETER T. LEESON AND ANDREA M. DEAN<br />
TABLE 7 Controlling for GDP p/c and GDP p/c Growth Rate, 1991–2001<br />
SAR<br />
1 2 3 4 1 2 3 4<br />
Rho 0.126 ∗∗∗ 0.110 ∗∗∗ 0.125 ∗∗∗ 0.098 ∗∗∗<br />
(3.153) (8.035) (3.092) (7.917)<br />
Lambda 0.126 ∗∗∗ 0.108 ∗∗∗ 0.125 ∗∗∗ 0.098 ∗∗∗<br />
(3.155) (8.112) (3.089) (8.003)<br />
GDP p/c −0.001 ∗∗∗ −0.001 ∗∗∗ −0.001 ∗∗∗ −0.001 ∗∗∗<br />
(2.582) (2.385) (2.599) (2.356)<br />
GDP p/c −3.891 ∗∗ −3.277 ∗ −3.883 ∗∗ −3.246 ∗<br />
Growth Rate (2.183) (1.892) (2.115) (1.735)<br />
Constant 0.786 ∗∗∗ 0.991 ∗∗∗ 0.791 ∗∗∗ 1.014 ∗∗∗ 0.893 ∗∗∗ 1.124 ∗∗∗ 0.915 ∗∗∗ 1.127 ∗∗∗<br />
(5.971) (6.176) (6.106) (6.211) (6.002) (6.224) (6.183) (6.483)<br />
Log- −2029.782 −2029.284 −2029.825 −2028.124 −2029.572 −2029.381 −2029.471 −2028.314<br />
likelihood<br />
R-squared 0.020 0.030 0.025 0.035 0.020 0.031 0.026 0.035<br />
Observations 882 882 882 882 882 882 882 882<br />
Notes: Dependent variable: change in democracy (t-statistics in parentheses). Spatial weight matrix: first-order contiguity. ∗∗∗ = 1%,<br />
∗∗ = 5%, ∗ = 10%. Columns 1–4 include year and country fixed effects.<br />
SEM<br />
However, in the fully specified regressions we get similar<br />
results to those in our benchmark regressions. Democracy<br />
does in fact spread between neighbors but the contagion<br />
effect tends to be small.<br />
Fourth, we try rerunning our regressions using a different<br />
method of weighting countries in the spatial weight<br />
matrix, W. As discussed above, since we consider the<br />
democratic domino theory based on the spread of democracy<br />
through geographic neighbors, our main regressions<br />
use first-order contiguity to determine the weight received<br />
by each country in W. However,notallcountries’geographic<br />
neighbors may be equal. In particular, those with<br />
more inhabitants may be more influential than others on<br />
their changes in democracy. For instance, a more populous<br />
country, such as the United States, might have more<br />
effect on Mexico’s changes in democracy than one of Mexico’s<br />
other contiguous neighbors, such as Belize, which is<br />
considerably smaller than the United States. To address<br />
this possibility we also try weighting contiguous neighbors<br />
in the spatial weight matrix according to population<br />
size. As it turns out, this does not matter for the geographic<br />
spread of democracy. We find similar estimates<br />
when we use simple first-order contiguity for the spatial<br />
weight matrix and so do not report the results with population<br />
weighting separately. In the population-weighted<br />
regressions without fixed effects democracy’s spread rate<br />
is about 8 or 9%. When we include two-way fixed effects<br />
this falls to about 7 or 8%.<br />
As a final robustness check we try excluding observations<br />
with “unusual” Polity scores. All of our regressions<br />
use the Polity 2 variable, discussed above, which is simply<br />
the Polity variable modified for the purpose of time-series<br />
analysis. If a country was going through a political transition<br />
in a particular year, the Polity variable would code<br />
this country in a way that does not correspond to the<br />
−10 to +10 democracy/autocracy scale used to measure<br />
a country’s political regime in a “normal” year. For example,<br />
if in year y, country i was going through a political<br />
regime transition, it would be coded with a −88 in the<br />
Polity variable. <strong>The</strong> Polity 2 variable transforms this coding<br />
into a usable Polity score corresponding to the −10 to<br />
+10 scale so that researchers can use this data. To make<br />
sure these “unusual” observations are not influencing our<br />
estimates we rerun our benchmark regressions excluding<br />
them. Once we remove these observations we are only left<br />
with two usable samples, the 1951–2001 sample and the<br />
1991–2001 sample. Our results are similar to those that<br />
do not exclude these observations.<br />
Concluding Remarks<br />
This article empirically investigated the democratic<br />
domino theory using spatial econometrics to estimate a<br />
panel covering more than 130 countries over the last oneand-a-half<br />
centuries. Our results suggest that a democratic<br />
domino effect does in fact exist. However, they<br />
also find that this effect is more modest than the emphasis<br />
on domino reasoning in global foreign affairs<br />
would suggest. Countries “catch” only about 11% of their
DEMOCRATIC DOMINO THEORY 547<br />
average geographic neighbors’ changes in democracy. <strong>The</strong><br />
idea that enhancing democracy in a few strategic nations<br />
could substantially alter the extent of democracy in the<br />
rest of the region, for instance, does not appear to be<br />
correct.<br />
Our results point to several conclusions. First, foreign<br />
policy should not pretend that democratic increases<br />
in one country will lead, in the words of President Bush, to<br />
a “democratic revolution” in the larger region it is situated<br />
in. <strong>The</strong> democratic domino effect is modest, and even in<br />
the presence of only a few geographic neighbors, provided<br />
these neighbors are not also independently increasing in<br />
their democracy, minimally affects changes in democracy<br />
in neighboring countries. In the presence of many geographic<br />
neighbors the vast majority of the spread of any<br />
increase (or decrease) in democracy in one country to its<br />
neighbors is overwhelmed by the independent democracy<br />
changes in these countries’ neighbors. In particular, the<br />
“lightness” with which democratic dominoes fall suggests<br />
that even if foreign military intervention aimed at promoting<br />
democracy in undemocratic countries succeeds<br />
in democratizing these nations, intervention is likely to<br />
have only a small effect on democracy in their broader<br />
regions.<br />
Two questions this article does not explore but are<br />
important for evaluating the efficacy of using foreign<br />
military intervention to promote democracy abroad are<br />
as follows: (1) Is military intervention in fact capable of<br />
democratizing foreign countries the intervener occupies?<br />
(2) If yes, do intervention-created democracy increases<br />
spread to neighboring countries, or do they stop at the<br />
occupied country’s borders? If the answers to questions<br />
one and two are positive, a third question also emerges:<br />
(3) Do intervention-created democracy increases spread<br />
to geographic neighbors at the same rate, a stronger<br />
rate, or a weaker rate than internally created democracy<br />
increases?<br />
Existing research has investigated the first question<br />
for the United States as occupier and finds sobering<br />
results. Although there are a handful of intervention<br />
successes that succeeded in promoting democracy in<br />
these countries, notably American occupations of Austria,<br />
Germany, and Japan following WWII, important<br />
work by Peceny (1999, 2000), Lawson and Thacker (2003),<br />
Edelstein (2004), Enterline and Greig (2005), Bueno de<br />
Mesquita and Downs (2005), Coyne (2007), and others<br />
suggests that most U.S. attempts at imposing liberal<br />
democracy abroad have failed. <strong>The</strong> handful of foreign intervention<br />
success stories that do exist, however, point to<br />
the need for an investigation of the second and third questions<br />
posed above. Some preliminary work suggests the<br />
answer to the second question may be negative, rendering<br />
question three moot (see, for example, Boettke, Coyne,<br />
and Leeson 2008). However, this research does not evaluate<br />
these questions using spatial methods, which will help<br />
to supply firmer answers. <strong>The</strong> analysis this article develops<br />
provides a framework for doing so, which future research<br />
should explore.<br />
Appendix A:<br />
Sample Countries<br />
Country 1851–2001 1901–2001 1951–2001 1991–2001<br />
Albania X X<br />
Algeria<br />
X<br />
<strong>An</strong>gola<br />
X<br />
Argentina X X X X<br />
Australia X ∗ X ∗<br />
Austria X X X X<br />
Bahrain<br />
X ∗<br />
Belgium X X<br />
Benin<br />
X<br />
Bhutan X X<br />
Bolivia X X X X<br />
Brazil X X X<br />
Bulgaria X ∗ X X<br />
Burkina Faso<br />
X<br />
Burundi<br />
X<br />
Cambodia<br />
X<br />
continued
548 PETER T. LEESON AND ANDREA M. DEAN<br />
APPENDIX A:<br />
Continued<br />
Country 1851–2001 1901–2001 1951–2001 1991–2001<br />
Cameroon<br />
X<br />
Canada X X X<br />
Cen. Afr. Rep.<br />
X<br />
Chad<br />
X<br />
Chile X X X X<br />
China X X<br />
Colombia X X X X<br />
Comoros<br />
X ∗<br />
Congo, Dem. R.<br />
X<br />
Congo, Rep. of<br />
X<br />
Costa Rica X ∗ X ∗ X X<br />
Cuba X ∗ X ∗<br />
Cyprus<br />
X ∗<br />
Czech Republic X X<br />
Denmark X ∗ X<br />
Djibouti<br />
X<br />
Dom. Republic X X<br />
Ecuador X X X X<br />
Egypt X X<br />
ElSalvador X X X<br />
Eq. Guinea<br />
X<br />
Ethiopia X ∗ X<br />
Fiji<br />
X ∗<br />
Finland X X<br />
France X X X X<br />
Gabon<br />
X<br />
Gambia<br />
X<br />
Germany<br />
X<br />
Ghana<br />
X<br />
Greece X X<br />
Guatemala X X X X<br />
Guinea<br />
X<br />
Guinea-Bissau<br />
X<br />
Guyana<br />
X<br />
Haiti X X<br />
Honduras X X<br />
Hungary<br />
X<br />
India X X<br />
Indonesia X ∗ X<br />
Iran X ∗ X ∗ X X<br />
Iraq X X<br />
Ireland X X<br />
Israel X X<br />
Italy X X X<br />
Ivory Coast<br />
X<br />
Jamaica<br />
X ∗<br />
Japan<br />
X ∗<br />
Jordan X X<br />
continued
DEMOCRATIC DOMINO THEORY 549<br />
APPENDIX A:<br />
Continued<br />
Country 1851–2001 1901–2001 1951–2001 1991–2001<br />
Kenya<br />
X<br />
Korea, North X X<br />
Korea, South X X<br />
Laos<br />
X<br />
Lesotho<br />
X<br />
Liberia X ∗ X ∗ X ∗ X<br />
Libya<br />
X<br />
Madagascar<br />
X ∗<br />
Malawi<br />
X<br />
Malaysia<br />
X<br />
Mali<br />
X<br />
Mauritania<br />
X<br />
Mauritius<br />
X ∗<br />
Mexico X X X<br />
Mongolia X X<br />
Morocco<br />
X<br />
Mozambique<br />
X<br />
Myanmar X X<br />
Namibia<br />
X<br />
Nepal X ∗ X ∗ X X<br />
Netherlands X X<br />
New Zealand X ∗ X ∗ X ∗<br />
Nicaragua X X<br />
Niger<br />
X<br />
Nigeria<br />
X<br />
Norway X X<br />
Oman X ∗ X ∗ X X<br />
Pakistan X X<br />
Panama X X<br />
Papua N. Guinea<br />
X<br />
Paraguay X X X X<br />
Philippines X ∗ X ∗<br />
Poland X X<br />
Portugal X X X X<br />
Qatar<br />
X<br />
Romania X X<br />
Russia X ∗ X X<br />
Rwanda<br />
X<br />
Saudi Arabia X X<br />
Senegal<br />
X<br />
Sierra Leone<br />
X<br />
Singapore<br />
X ∗<br />
Somalia<br />
X<br />
South Africa X ∗ X<br />
Spain X X X X<br />
Sri Lanka X ∗ X ∗<br />
Sudan<br />
X<br />
Swaziland<br />
X<br />
continued
550 PETER T. LEESON AND ANDREA M. DEAN<br />
APPENDIX A:<br />
Continued<br />
Country 1851–2001 1901–2001 1951–2001 1991–2001<br />
Sweden X ∗ X ∗ X X<br />
Switzerland X X X X<br />
Taiwan X ∗ X ∗<br />
Tanzania<br />
X<br />
Thailand X X<br />
Togo<br />
X<br />
Trin. & Tob.<br />
X ∗<br />
Tunisia<br />
X<br />
Turkey X X<br />
U. Arab Emir. X<br />
Uganda<br />
X<br />
UK X ∗ X ∗ X X<br />
USA X ∗ X X X<br />
Uruguay X X X X<br />
Venezuela X X X<br />
Vietnam<br />
X<br />
Yemen<br />
X<br />
Yugoslavia<br />
X<br />
Zambia<br />
X<br />
Zimbabwe<br />
X<br />
∗ Indicates island status including “data island.”<br />
References<br />
Ackerman, Spencer. 2006. “Hard of Hearing.” <strong>The</strong> New Republic<br />
Online, June 27, 2006.<br />
Boettke,PeterJ.,ChristopherJ.Coyne,andPeterT.Leeson.<br />
2008. “Institutional Stickiness and the New Development<br />
Economics.” American Journal of Economics and Sociology<br />
67(2): 331–58.<br />
Bueno de Mesquita, Bruce, and George W. Downs. 2004. “Why<br />
Gun-Barrel Democracy Doesn’t Work.” Hoover Digest 2.<br />
http://www.hoover.org/publications/digest/3021131.html.<br />
Coyne, Christopher J. 2007. After War: <strong>The</strong> Political Economy<br />
of Exporting Democracy. Stanford, CA: Stanford University<br />
Press.<br />
Coyne, Christopher J., and Peter T. Leeson. 2004. “Read All<br />
About It! Understanding the Role of Media in Economic<br />
Development.” Kyklos 57(1): 21–44.<br />
Coyne, Christopher J., and Peter T. Leeson. 2009. “Media as<br />
a Mechanism of Institutional Change and Reinforcement.”<br />
Kyklos 62(1): 1–14.<br />
Danilovic, Vesna. 2001. “<strong>The</strong> Sources of Credibility in Extended<br />
Deterrence.” Journal of Conflict Resolution 45(3): 341–69.<br />
Edelstein, David M. 2004. “Occupational Hazards: Why Military<br />
Occupations Succeed or Fail.” International Security<br />
29(1): 49–91.<br />
Elkins, Zachary, <strong>An</strong>drew T. Guzman, and Beth A. Simmons.<br />
2006. “Competing for Capital: <strong>The</strong> Diffusion of Bilateral<br />
Investment Treaties, 1960–2000.” International Organization<br />
60(4): 811–46.<br />
Enterline, <strong>An</strong>drew J., and J. Michael Greig. 2005. “Beacons<br />
of Hope? <strong>The</strong> Impact of Imposed Democracy on Regional<br />
Peace, Democracy, and Prosperity.” Journal of Politics 67(4):<br />
1075–98.<br />
Franzese, Robert J., Jr., and Jude C. Hays. 2008. “Interdependence<br />
in Comparative Politics: Substance, <strong>The</strong>ory, Empirics,<br />
Substance.” Journal of Comparative Politics 41(4–5): 742–<br />
80.<br />
Gleditsch, Kristian S., and Michael D. Ward. 2000. “War and<br />
Peace in Space and Time: <strong>The</strong> Role of Democratization.”<br />
International Studies Quarterly 44(1): 1–29.<br />
Gleditsch, Kristian S., and Michael D. Ward. 2006. “Diffusion<br />
and the International Context of Democratization.” International<br />
Organization 60(4): 911–33.<br />
Huntington, Samuel P. 1991. <strong>The</strong> Third Wave: Democratization<br />
in the Late Twentieth Century. Norman: University of Oklahoma<br />
Press.<br />
Jaggers, Keith, and Ted Robert Gurr. 1995. “Tracking Democracy’s<br />
Third Wave with the Polity III Data.” Journal of Peace<br />
Research 32(4): 469–82.<br />
Jervis, Robert. 1991. “<strong>Domino</strong> Beliefs and Strategic Behavior.”<br />
In <strong>Domino</strong>es and Bandwagons: Strategic Beliefs and Great<br />
Power Competition in the Eurasian Rimland, ed.Robert<br />
Jervis and Jack Snyder. Oxford: Oxford University Press,<br />
20–50.<br />
Jervis, Robert, and Jack Snyder, eds. 1991. <strong>Domino</strong>es and Bandwagons:<br />
Strategic Beliefs and Great Power Competition in the<br />
Eurasian Rimland. Oxford: Oxford University Press.<br />
Johnson, Robert H. 1985. “Exaggerating America’s Stakes in<br />
Third World Conflicts.” International Security 10(3): 32–68.
DEMOCRATIC DOMINO THEORY 551<br />
Lawson, Chappell, and Strom Thacker. 2003. “Democracy?<br />
In Iraq?” Hoover Digest 3. Available at http://www.hoover<br />
.org/publications/digest/3057371.html.<br />
Lee, Chang Kil, and David Strang. 2006. “<strong>The</strong> International<br />
Diffusion of Public Sector Downsizing: Network Emulation<br />
and <strong>The</strong>ory-Driven Learning.” International Organization<br />
60(4): 883–909.<br />
Leeson, Peter T. 2008. “Media Freedom, Political Knowledge,<br />
and Participation.” Journal of Economic Perspectives 22(2):<br />
155–69.<br />
Leeson, Peter T., and Christopher J. Coyne. 2007. “<strong>The</strong> Reformers’<br />
Dilemma: Media, Policy Ownership, and Reform.”<br />
European Journal of Law and Economics 23(3): 237–50.<br />
Leeson, Peter T., and Russell S. Sobel. 2007. “Contagious Capitalism.”<br />
George Mason University and West Virginia University.<br />
Mimeo.<br />
Murphy, Rhodes. 1966. “China and the <strong>Domino</strong>es.” Asian Survey<br />
6(9): 510–15.<br />
Ninkovich, Frank. 1994. Modernity and Power: A History of the<br />
<strong>Domino</strong> <strong>The</strong>ory in the 20th Century. Chicago:Universityof<br />
Chicago Press.<br />
O’Loughlin, John, Michael D. Ward, Corey L. Lafdahl, Jordin S.<br />
Cohen,DavidS.Brown,KristianS.Gleditsch,andMichael<br />
Shin. 1998. “<strong>The</strong> Diffusion of Democracy, 1946–1994.” <strong>An</strong>nals<br />
of the Association of American Geographers 88(4): 545–<br />
74.<br />
Peceny, Mark. 1999. “Forcing <strong>The</strong>m to Be Free.” Political Research<br />
Quarterly 52(3): 549–82.<br />
Peceny, Mark. 2000. Democracy at the Point of Bayonets. University<br />
Park, PA: Penn State Press.<br />
Pevehouse, Jon C. 2002a. “Democracy from the Outside-In?<br />
International Organizations and Democratization.” International<br />
Organization 56(3): 514–49.<br />
Pevehouse, Jon C. 2002b. “With a Little Help from My Friends?<br />
Regional Organizations and the Consolidation of Democracy.”<br />
American Journal of Political Science 46(3): 611–<br />
26.<br />
Ray, James Lee. 1995. “Global Trends, State-Specific Factors and<br />
Regime Transitions, 1825–1993.” Journal of Peace Research<br />
32(1): 49–63.<br />
Shimko, Keith L. 1994. “Metaphors and Foreign Policy Decision<br />
Making.” Political Psychology 15(4): 655–71.<br />
Silverman, Jeremy Mark. 1975. “<strong>The</strong> <strong>Domino</strong> <strong>The</strong>ory: Alternative<br />
to a Self-Fulfilling Prophecy.” Asian Survey 15(11):<br />
915–39.<br />
Simmons, Beth A., Frank Dobbin, and Geoffrey Garrett. 2006.<br />
“Introduction: <strong>The</strong> International Diffusion of Liberalism.”<br />
International Organization 60(4): 781–810.<br />
Slater, Jerome. 1987. “<strong>Domino</strong>s in Central America: Will <strong>The</strong>y<br />
Fall? Does It Matter?” International Security 12(2): 105–<br />
34.<br />
Starr, Harvey. 1991. “<strong>Democratic</strong> <strong>Domino</strong>es: Diffusion<br />
Approaches to the Spread of Democracy in the International<br />
System.” Journal of Conflict Resolution 35(2): 356–<br />
81.<br />
Starr, Harvey, and Christina Lindborg. 2003. “<strong>Democratic</strong><br />
<strong>Domino</strong>es Revisited: <strong>The</strong> Hazards of Governmental Transitions,<br />
1974–1996.” Journal of Conflict Resolution 47(4): 490–<br />
519.<br />
Swank, Duane. 2006. “Tax Policy in an Era of Internationalization:<br />
Explaining the Spread of Neoliberalism.” International<br />
Organization 60(4): 847–82.<br />
Viksnins, George J. 1975. “<strong>The</strong> Economic Consequences of<br />
Falling <strong>Domino</strong>es.” Asian Survey 15(11): 940–56.<br />
Walt, Stephen M. 2000. “Fads, Fevers, and Firestorms.” Foreign<br />
Policy 121: 34–42.