Master thesis - UBC Physics & Astronomy
Master thesis - UBC Physics & Astronomy
Master thesis - UBC Physics & Astronomy

Create successful ePaper yourself
Turn your PDF publications into a flip-book with our unique Google optimized e-Paper software.
30 M. Alexandersen : <strong>Master</strong> <strong>thesis</strong><br />
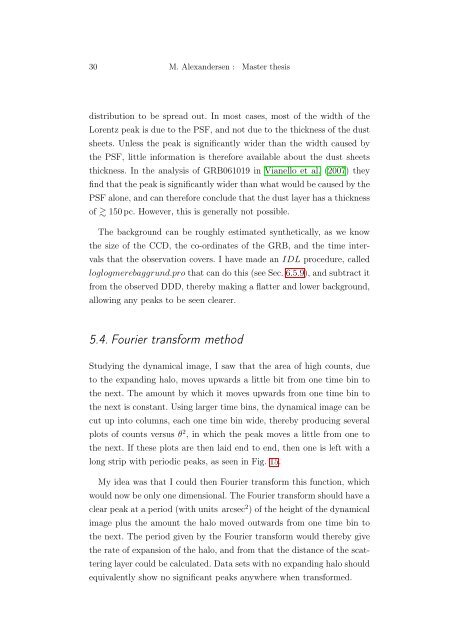
distribution to be spread out. In most cases, most of the width of the<br />
Lorentz peak is due to the PSF, and not due to the thickness of the dust<br />
sheets. Unless the peak is significantly wider than the width caused by<br />
the PSF, little information is therefore available about the dust sheets<br />
thickness. In the analysis of GRB061019 in Vianello et al. (2007) they<br />
find that the peak is significantly wider than what would be caused by the<br />
PSF alone, and can therefore conclude that the dust layer has a thickness<br />
of 150 pc. However, this is generally not possible.<br />
The background can be roughly estimated synthetically, as we know<br />
the size of the CCD, the co-ordinates of the GRB, and the time intervals<br />
that the observation covers. I have made an IDL procedure, called<br />
loglogmerebaggrund.pro that can do this (see Sec. 6.5.9), and subtract it<br />
from the observed DDD, thereby making a flatter and lower background,<br />
allowing any peaks to be seen clearer.<br />
5.4. Fourier transform method<br />
Studying the dynamical image, I saw that the area of high counts, due<br />
to the expanding halo, moves upwards a little bit from one time bin to<br />
the next. The amount by which it moves upwards from one time bin to<br />
the next is constant. Using larger time bins, the dynamical image can be<br />
cut up into columns, each one time bin wide, thereby producing several<br />
plots of counts versus θ 2 , in which the peak moves a little from one to<br />
the next. If these plots are then laid end to end, then one is left with a<br />
long strip with periodic peaks, as seen in Fig. 15.<br />
My idea was that I could then Fourier transform this function, which<br />
would now be only one dimensional. The Fourier transform should have a<br />
clear peak at a period (with units arcsec 2 ) of the height of the dynamical<br />
image plus the amount the halo moved outwards from one time bin to<br />
the next. The period given by the Fourier transform would thereby give<br />
the rate of expansion of the halo, and from that the distance of the scattering<br />
layer could be calculated. Data sets with no expanding halo should<br />
equivalently show no significant peaks anywhere when transformed.