download PDF - Physics
download PDF - Physics
download PDF - Physics

You also want an ePaper? Increase the reach of your titles
YUMPU automatically turns print PDFs into web optimized ePapers that Google loves.
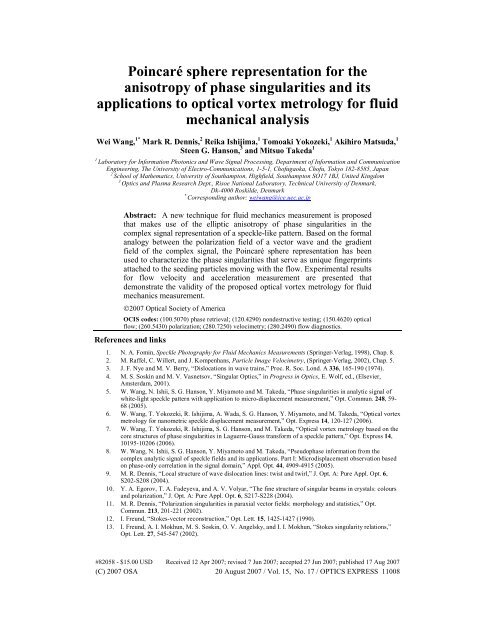
Poincaré sphere representation for the<br />
anisotropy of phase singularities and its<br />
applications to optical vortex metrology for fluid<br />
mechanical analysis<br />
Wei Wang, 1* Mark R. Dennis, 2 Reika Ishijima, 1 Tomoaki Yokozeki, 1 Akihiro Matsuda, 1<br />
Steen G. Hanson, 3 and Mitsuo Takeda 1<br />
1<br />
Laboratory for Information Photonics and Wave Signal Processing, Department of Information and Communication<br />
Engineering, The University of Electro-Communications, 1-5-1, Chofugaoka, Chofu, Tokyo 182-8585, Japan<br />
2<br />
School of Mathematics, University of Southampton, Highfield, Southampton SO17 1BJ, United Kingdom<br />
3<br />
Optics and Plasma Research Dept., Risoe National Laboratory, Technical University of Denmark,<br />
Dk-4000 Roskilde, Denmark<br />
*<br />
Corresponding author: weiwang@ice.uec.ac.jp<br />
Abstract: A new technique for fluid mechanics measurement is proposed<br />
that makes use of the elliptic anisotropy of phase singularities in the<br />
complex signal representation of a speckle-like pattern. Based on the formal<br />
analogy between the polarization field of a vector wave and the gradient<br />
field of the complex signal, the Poincaré sphere representation has been<br />
used to characterize the phase singularities that serve as unique fingerprints<br />
attached to the seeding particles moving with the flow. Experimental results<br />
for flow velocity and acceleration measurement are presented that<br />
demonstrate the validity of the proposed optical vortex metrology for fluid<br />
mechanics measurement.<br />
©2007 Optical Society of America<br />
OCIS codes: (100.5070) phase retrieval; (120.4290) nondestructive testing; (150.4620) optical<br />
flow; (260.5430) polarization; (280.7250) velocimetry; (280.2490) flow diagnostics.<br />
References and links<br />
1. N. A. Fomin, Speckle Photography for Fluid Mechanics Measurements (Springer-Verlag, 1998), Chap. 8.<br />
2. M. Raffel, C. Willert, and J. Kompenhans, Particle Image Velocimetry, (Springer-Verlag, 2002), Chap. 5.<br />
3. J. F. Nye and M. V. Berry, “Dislocations in wave trains,” Proc. R. Soc. Lond. A 336, 165-190 (1974).<br />
4. M. S. Soskin and M. V. Vasnetsov, “Singular Optics,” in Progress in Optics, E. Wolf, ed., (Elsevier,<br />
Amsterdam, 2001).<br />
5. W. Wang, N. Ishii, S. G. Hanson, Y. Miyamoto and M. Takeda, “Phase singularities in analytic signal of<br />
white-light speckle pattern with application to micro-displacement measurement,” Opt. Commun. 248, 59-<br />
68 (2005).<br />
6. W. Wang, T. Yokozeki, R. Ishijima, A. Wada, S. G. Hanson, Y. Miyamoto, and M. Takeda, “Optical vortex<br />
metrology for nanometric speckle displacement measurement,” Opt. Express 14, 120-127 (2006).<br />
7. W. Wang, T. Yokozeki, R. Ishijima, S. G. Hanson, and M. Takeda, “Optical vortex metrology based on the<br />
core structures of phase singularities in Laguerre-Gauss transform of a speckle pattern,” Opt. Express 14,<br />
10195-10206 (2006).<br />
8. W. Wang, N. Ishii, S. G. Hanson, Y. Miyamoto and M. Takeda, “Pseudophase information from the<br />
complex analytic signal of speckle fields and its applications. Part I: Microdisplacement observation based<br />
on phase-only correlation in the signal domain,” Appl. Opt. 44, 4909-4915 (2005).<br />
9. M. R. Dennis, “Local structure of wave dislocation lines: twist and twirl,” J. Opt. A: Pure Appl. Opt. 6,<br />
S202-S208 (2004).<br />
10. Y. A. Egorov, T. A. Fadeyeva, and A. V. Volyar, “The fine structure of singular beams in crystals: colours<br />
and polarization,” J. Opt. A: Pure Appl. Opt. 6, S217-S228 (2004).<br />
11. M. R. Dennis, “Polarization singularities in paraxial vector fields: morphology and statistics,” Opt.<br />
Commun. 213, 201-221 (2002).<br />
12. I. Freund, “Stokes-vector reconstruction,” Opt. Lett. 15, 1425-1427 (1990).<br />
13. I. Freund, A. I. Mokhun, M. S. Soskin, O. V. Angelsky, and I. I. Mokhun, “Stokes singularity relations,”<br />
Opt. Lett. 27, 545-547 (2002).<br />
#82058 - $15.00 USD Received 12 Apr 2007; revised 7 Jun 2007; accepted 27 Jun 2007; published 17 Aug 2007<br />
(C) 2007 OSA 20 August 2007 / Vol. 15, No. 17 / OPTICS EXPRESS 11008
14. A. I. Konukhov and L. A. Melnikov, “Optical vortices in a vector field: the general definition based on the<br />
analogy with topological solitons in a 2D ferromagnet, and examples from the polarization transverse<br />
patterns in a laser,” J. Opt. B: Quantum Semiclass. Opt. 3, S139-S144 (2001).<br />
15. K. G. Larkin, D. J. Bone, and M. A. Oldfield, “Natural demodulation of two-dimensional fringe patterns. I.<br />
General background of the spiral phase quadrature transform,” J. Opt. Soc. Am. A 18, 1862-1870 (2001).<br />
16. C. –S. Guo, Y. –J. Han, J. –B. Xu, and J. Ding, “Radial Hilbert transform with Laguerre-Gaussian spatial<br />
filters,” Opt. Lett. 31, 1394-1396 (2006).<br />
17. M. V. Berry and M. R. Dennis, “Phase singularities in isotropic random waves,” Proc. R. Soc. Lond. A, 456,<br />
2059-2079 (2000).<br />
18. Y. Y. Schechner and J. Shamir, “Parameterization and orbital angular momentum of anisotropic<br />
dislocations,” J. Opt. Soc. Am. A 13, 967-973 (1996).<br />
19. W. Wang, S. G. Hanson, Y. Miyamoto, and M. Takeda, “Experimental investigation of local properties and<br />
statistics of optical vortices in random wave fields,” Phys. Rev. Lett. 94, 103902 (2005).<br />
20. M. Born and E. Wolf, Principles of Optics, (Cambridge University Press, 1999), Chap. 1.<br />
21. M. J. Padgett and J. Courtial, “Poincaré sphere equivalent for light beams containing orbital angular<br />
momentum,” Opt. Lett. 24, 430-432 (1999).<br />
22. N. Steenrod, The Topology of Fibre Bundles (Princeton University Press, 1951), Chap. 20.<br />
23. I. Madsen and J. Tornehave, From Calculus to Cohomology (Cambridge University Press, 1997), Chap. 14.<br />
24. A. Asundi and H. North, “White-light speckle method- Current trends,” Opt. Laser Eng. 29, 159-169 (1998).<br />
1. Introduction<br />
Velocity is one of the most important parameters in fluid mechanics due to its cardinal<br />
influence on transport phenomena. Velocity measurements by using speckle and specklerelated<br />
techniques have been explored extensively, and various techniques have been<br />
developed [1, 2]. Though they differ in specific technical details, these speckle-related<br />
methods have at least two common features, namely, to seed the flow with particles, and to<br />
detect the velocity vectors through cross-correlation of the intensity distributions for the<br />
recorded images. The seeding particles moving with a fluid flow provide kinematic<br />
information at the recording plane, and the local fluid velocity is derived from the ratio<br />
between the measured spacing for the same tracers and the time between exposures. Although<br />
many attempts have been made to extend its applications during the past decades, the most<br />
serious problem for particle image velocimetry lies in the lack of an autonomous method for<br />
high precision tracking of the seeding particles from the recorded speckle-like patterns. Since<br />
the resulting velocity vectors are derived through a cross-correlation over small interrogation<br />
areas of the flow, the spatial resolution for particle image velocimetry has been restricted due<br />
to the fact that the resulting velocity distribution is a spatially averaged representation for the<br />
actual velocity field.<br />
Meanwhile, the concept of singularities in optical fields has been known for a long time,<br />
and their basic properties have received more and more attention since the seminal work of<br />
Nye and Berry in the early 1970s [3,4]. Due to the well-known fact that the phase singularities<br />
are well-defined geometrical points where the corresponding amplitudes always equal zero,<br />
and also due to the fact that the least photon noise is present at the locations of zero optical<br />
field, these topological defects of the wavefronts are optimal encoders for position marking.<br />
Noting that many randomly distributed phase singularities exist in an analytic signalof a<br />
speckle-like pattern, we have proposed a method referred to as Optical Vortex Metrology<br />
(OVM), which makes use of the pseudophase singularities in an analytic signal representation<br />
of the speckle-like pattern for optical metrology [5-7]. In addition to an improved<br />
performance for micro-displacement measurement with nano-scale resolution as demonstrated<br />
in a previous paper [6], the technique based on the pseudophase can be applied to a wider<br />
class of general speckle-like random markings due to the fact that the pseudophase can be<br />
obtained without recourse to interferometry, and thereby opens up new possibilities in a wide<br />
range of applications beyond those known for laser speckle metrology [8].<br />
The purpose of this paper is to propose yet another technique for velocity measurement,<br />
which tracks the pseudophase singularities based on their anisotropic core structures. Rather<br />
than directly correlating the raw intensity distributions of specklegram-like random patterns,<br />
which suffers from the reduced resolution for velocity measurements due to spatial averaging<br />
#82058 - $15.00 USD Received 12 Apr 2007; revised 7 Jun 2007; accepted 27 Jun 2007; published 17 Aug 2007<br />
(C) 2007 OSA 20 August 2007 / Vol. 15, No. 17 / OPTICS EXPRESS 11009
̃<br />
,<br />
̃ ̃<br />
,<br />
̃<br />
through<br />
and the influence of the rotation of the seeding particles, we first generate the 2-D isotropic<br />
complex signal representation for the particle-seeded flow pattern by Laguerre-Gauss filtering.<br />
Next, we detect the core anisotropy of the pseudophase singularities, which serves as the<br />
fingerprint for their identification. Then, we conduct the fluid mechanics measurements by<br />
tracking the registered phase singularities. The key idea of the newly proposed technique is<br />
the unique identification of the matching phase singularities through the geometry of their<br />
anisotropy. In our previous investigation, we arbitrarily adopted the ellipticity, zero crossing<br />
angle and vorticity as the singularity fingerprints [7]. Mathematically, however, these ad hoc<br />
parameters are not the most natural measures, nor are they optimally chosen for the best<br />
performance. Noting that the fingerprint of a pseudophase singularity depends only on the<br />
gradient field of the complex signal, we propose the use of an alternative set of field<br />
parameters, which are mathematically more natural and elegant with an analogy to the Stokes<br />
parameters in polarimetry [9-14]. After parametrizing the anisotropy ellipse of each<br />
pseudophase singularity onto a Poincaré sphere, we can uniquely identify that singularity even<br />
in a complicated environment. We will experimentally demonstrate that even a random<br />
displacement of an object in a disturbed flow can be determined by tracing the registered<br />
pseudophase singularities based on their fingerprints represented by the Stokes-like field<br />
parameters and the Poincaré sphere.<br />
2. Principle<br />
2.1 Complex signal representation of a speckle pattern by isotropic Laguerre-Gauss filtering<br />
Before explaining the proposed technique for labeling the particles used in velocity<br />
measurements, we first briefly review the pseudophase retrieval from the complex-valued<br />
signal representation of a speckle-like pattern along the lines of our previous paper [7].<br />
Let g( xy , ) be the original intensity distribution of the speckle pattern, and let its Fourier<br />
spectrum be G( fx, f<br />
y<br />
) . We can relate g( xy , ) to its isotropic complex signal g( xy , )<br />
a Laguerre-Gauss (L-G) filter. Thus, our definition of a 2-D isotropic complex signal<br />
representation for the speckle-like pattern is<br />
+∞ +∞<br />
g( xy , ) = H ( f, f) ⋅ G( f, f)exp j2 π ( fx+<br />
fy)<br />
dfdf<br />
−∞<br />
∫∫<br />
−∞<br />
⎡<br />
⎤<br />
LG x y x y x ⎣<br />
⎦ y x y<br />
(1)<br />
⎡<br />
⎤<br />
⎣ ⎦ , (2)<br />
where HLG( fx, f<br />
y)<br />
is a Laguerre-Gauss filter in the frequency domain defined as follows:<br />
H ( f , f ) = ( f + jf )exp<br />
2 2 2<br />
− ( f + f ) ω<br />
2<br />
= ρexp( −ρ 2<br />
ω )exp( jβ<br />
)<br />
LG x y x y x y<br />
2 2<br />
where ρ = fx<br />
+ fy<br />
, β = arctan( fy<br />
fx<br />
) are the polar coordinates in the spatial frequency<br />
domain. The spiral phase function, also used in the Riesz transform (vortex transform) [15],<br />
has the unique property that any section through the origin is a signum function with a π<br />
phase jump, and so can be understood as a radial Hilbert transform. The amplitude of the L-G<br />
filter has a typical doughnut-like structure [7,16], serving as a band-pass filter by suppressing<br />
the high spatial frequency components, which are known to be responsible for creating<br />
unstable phase singularities. Therefore, the density of pseudophase singularities can be<br />
controlled by choosing a proper bandwidth of the Laguerre-Gauss function, ω , to adjust the<br />
average size for the speckle-like pattern. After straightforward algebra, we find<br />
g( xy , ) = gxy ( , ) exp[ jθ<br />
( xy , )] = gxy ( , ) ∗hLG<br />
( xy , )<br />
(3)<br />
where ∗ denotes the convolution operation, and hLG<br />
( xyis , ) again a Laguerre-Gauss function<br />
in the spatial signal domain<br />
−1 2 4 2 2 2 2<br />
hLG ( xy , ) = { HLG ( fx , fy<br />
)} = ( jπω)( x+ jy)exp[ − πω( F<br />
x + y)]<br />
(4)<br />
2 4 2 2 2<br />
= ( jπω)[ rexp( −πr ω)exp( jα)] .<br />
#82058 - $15.00 USD Received 12 Apr 2007; revised 7 Jun 2007; accepted 27 Jun 2007; published 17 Aug 2007<br />
(C) 2007 OSA 20 August 2007 / Vol. 15, No. 17 / OPTICS EXPRESS 11010
g̃<br />
̃ ̃<br />
,<br />
that<br />
̃<br />
̃<br />
−1<br />
2 2<br />
where is the inverse Fourier transform, and r = x + y , α = arctan( y x)<br />
are F the<br />
spatial polar coordinates defined as usual. Because the complex signal gxy ( , ) was generated<br />
from the Laguerre-Gauss filter, we call it a complex Laguerre-Gauss signal, or an L-G signal<br />
for short, to stress its difference from the conventional analytic signal derived from Hilbert<br />
transform. The phase θ ( xy , ) of the L-G signal of a speckle-like pattern is referred to as the<br />
pseudophase to distinguish it from the true phase of the optical field responsible for the<br />
speckle pattern. Although it is not the true phase of the complex optical field, the pseudophase<br />
does provide useful information about the object, as will be shown in Section 3.<br />
2.2 Poincaré sphere representation for phase singularity anisotropy<br />
Just as a random speckle intensity pattern imprints marks on a coherently illuminated object<br />
surface, randomly distributed phase singularities in the pseudophase map of the speckle<br />
pattern imprint unique marks on the object surface. Based on the information about the<br />
locations and the core structures of the phase singularities, we have proposed the use of<br />
Optical Vortex Metrology (OVM) for optical metrology [5-7]. To uniquely identify the<br />
corresponding pseudophase singularities before and after displacement, we proposed to use<br />
the ellipticity of the contour ellipse, zero crossing angle, and vorticity as the singularity<br />
fingerprints in our previous investigation. Though we demonstrated the performance of OVM<br />
with large dynamic range and high spatial resolution, these three parameters are not the most<br />
mathematically natural measures. Noting that the local structure of a pseudophase singularity<br />
̃<br />
depends only on the gradient field of the L-G signal ∇g( xy , ) , we propose yet another<br />
fingerprint for the purpose of unique identification.<br />
Usually, the change of the pseudophase around the phase singularities are non-uniform as<br />
a function of the azimuthal angle, and the amplitude contours, which is a typical core structure<br />
around the pseudophase singularity, displays a strongly anisotropic ellipse [17-18]. In the<br />
immediate vicinity of a pseudophase singularity, the real and imaginary parts of the L-G<br />
signal representation of a 2-D speckle-like pattern can be expressed as<br />
Re[ gxy ( , )] = ax+ by+ c, Im[ gxy ( , )] = ax+ by+<br />
c<br />
(5)<br />
r r r i i i<br />
where the coefficients: ak, bk, ck<br />
( k = r, i)<br />
can be obtained by the least-square fitting method<br />
from the detected complex values at the pixel grids surrounding the phase singularity[19].<br />
̃<br />
Meanwhile, the complex vector field ∇g<br />
, which is the associated gradient of the L-G signal<br />
, can be expressed as<br />
∇ g = ( a ) ˆ ( ) ˆ<br />
r<br />
+ jai x+ br + jbi<br />
y<br />
(6)<br />
= ( axˆ+ byˆ) + jax ( ˆ+<br />
byˆ<br />
),<br />
r r i i<br />
where, ˆx and ŷ are unit vectors. Recently, a set of Stokes-like parameters has been proposed<br />
̃<br />
for the complex vector field ∇g<br />
shares similar geometric features associated with the<br />
vector polarization field [9]. Therefore, the parameters, describing the anisotropy ellipse, may<br />
be defined as:<br />
2 2 2 2<br />
S0 = ar + br + ai + bi<br />
, (7.1)<br />
2 2 2 2<br />
S1 = ar + ai −br − bi<br />
, (7.2)<br />
S2 = 2( ab<br />
r r<br />
+ ab<br />
i i)<br />
, (7.3)<br />
S3 = 2( ab<br />
r i<br />
− ab<br />
i r)<br />
, (7.4)<br />
̃<br />
These parameters describing the anisotropic ellipse related to ∇g<br />
, are mathematically<br />
analogous, but physically unrelated, to the Stokes parameters in polarization. For instance, the<br />
sign of S 3 gives the sign (topological charge) of the vortex (i.e. the sense of phase increase<br />
#82058 - $15.00 USD Received 12 Apr 2007; revised 7 Jun 2007; accepted 27 Jun 2007; published 17 Aug 2007<br />
(C) 2007 OSA 20 August 2007 / Vol. 15, No. 17 / OPTICS EXPRESS 11011
around the singularity), analogous to the handedness of polarization. Meanwhile, it follows<br />
from Eq. (7) that only three of them are independent since they are related by the identity:<br />
S = S + S + S . (8)<br />
2 2 2 2<br />
0 1 2 3<br />
Following the same procedure as used for polarization [20], we can represent the<br />
ellipsoidal parameters as in the following equations:<br />
⎛ ⎞ ⎛ ⎞<br />
⎜ ⎟ ⎜ ⎟<br />
⎜ ⎟ ⎜ ⎟<br />
⎝ ⎠ ⎝ ⎠<br />
S S 1 0cos(2 )cos(2 ) (9.1)<br />
S S 2 0cos(2 )sin(2 ) (9.2)<br />
S S sin(2 ) 3 0 (9.3)<br />
Here, ϕ is the azimuth angle between the major semi-axis of the ellipse and the x -axis, and<br />
χ is the ellipticity angle, which is the arctangent of the ratio between the length of the two<br />
axes of the ellipse as shown in Fig. 1(a). Equations (9) indicate a simple geometrical<br />
representation for all the parameters Si<br />
( i = 1,2,3) as components in a three-dimensional<br />
sphere surface occupied in space by the unit vector:<br />
s1 S1<br />
−1<br />
S = s2 = S0 S2<br />
. (10)<br />
s S<br />
3 3<br />
Mathematically, the Poincaré sphere representation for polarization, phase singularity<br />
anisotropy, and elsewhere, such as optical angular momentum [21], can be interpreted the<br />
Hopf fibration (Hopf map) as follows [22]. A normalized, complex two-dimensional vector<br />
can be represented by a point on the 3-sphere (hypersphere) in 4-D. The set of points on this<br />
hypersphere corresponding to the complex vectors equivalent up to phase factors is a circle;<br />
the Hopf mapping identifies these points, and the image space is the 2-sphere in 3-D space.<br />
The Cartesian coordinates of the Hopf map are simply the Stokes parameters [11, 23].<br />
ŝ 3<br />
s 3<br />
<br />
S<br />
χ<br />
ϕ<br />
s 1<br />
2χ<br />
2ϕ<br />
s 2<br />
ŝ 2<br />
ŝ 1<br />
(a)<br />
(b)<br />
Fig. 1. (a). Amplitude contour ellipse for describing the anisotropic core structure of a<br />
pseudophase singularity in a L-G signal; (b) Stokes-like parameters for amplitude contour<br />
ellipse and the Poincaré’s sphere representation.<br />
Figure 1(b) shows the Poincaré sphere representation for the anisotropic core structure of<br />
the pseudophase singularity. Here, s<br />
1<br />
, s<br />
2<br />
, s3<br />
may be regarded as the Cartesian coordinates of a<br />
<br />
point S on a surface of the sphere with unit radius, such that 2ϕ and 2χ are the spherical<br />
angular coordinates of this point. Thus, to every possible state of the anisotropy ellipse for the<br />
#82058 - $15.00 USD Received 12 Apr 2007; revised 7 Jun 2007; accepted 27 Jun 2007; published 17 Aug 2007<br />
(C) 2007 OSA 20 August 2007 / Vol. 15, No. 17 / OPTICS EXPRESS 11012
core structure of a phase singularity, there corresponds one point on the sphere surface, and<br />
vice versa. It is this uniqueness of the core structure serving as the fingerprint of a<br />
pseudophase singularity that enables the correct identification and tracking of the pseudophase<br />
singularity through a complicated movement.<br />
To find the correctly matching pseudophase singularities for the object after displacement,<br />
it is necessary to introduce a similarity measure that gives a criterion for correct identification.<br />
As shown in Fig. 2, the distance along a geodesic line can be chosen as the figure of merit for<br />
the best matching of the pseudophase singularities. The geodesic line is the shortest path<br />
between two points on the sphere surface, also known as an orthodrome, which is a segment<br />
of a great circle. After a straight forward algebra, the merit function based on the distance<br />
along the geodesic line is given by<br />
Δ S = arccos( S⋅S′<br />
) ≤ε<br />
, (11)<br />
where primed parameters are related to the pseudophase singularities after displacement. After<br />
setting an appropriate threshold value ε , and calculating the merit function for each pair of<br />
pseudophase singularities, we can identify the correct counterparts based on the minimum<br />
<br />
value of ΔS . Thus, the in-plane displacement of a particle can be estimated from the<br />
coordinate change ( Δx, Δ y)<br />
of the corresponding pseudophase singularity attached to the<br />
particle, and the linear velocity of the measured flow at a given position can be estimated from<br />
the rate of change for the coordinate of each singularity between two sequential exposures.<br />
Meanwhile, when observed with focus on the seeded particle surface, the change of azimuth<br />
angle ϕ can be directly related to the rotation or spin of each pseudophase singularity<br />
associated with the particle. Therefore, we can also estimate the angular velocity and the<br />
applied torque of the particle spin through the change of the azimuth angle Δ ϕ .<br />
ŝ 3<br />
<br />
Δs<br />
<br />
s<br />
<br />
s′<br />
ŝ 2<br />
ŝ 1<br />
Fig. 2. Orthodrome on Poincaré sphere as the merit function of the best matching for<br />
pseudophase singularities.<br />
3. Experiments<br />
Experiments have been conducted to demonstrate the validity of the proposed principle. In<br />
experiments, tiny pieces of tea leaves were used as the micro-particles floating on the water<br />
surface. The tea leaves moving with the flow are imaged by a Nikon Macro lens ( f = 55mm,<br />
F2.8) onto the image sensor plane of a high-speed camera, FASTCAM-NET500/1000/Max<br />
(PHOTRON) with a pixel size of 7.4μm× 7.4μm . Based on the nominal magnification of the<br />
imaging optics and the pixel separation of the high-speed camera, we estimate that the<br />
displacement by an amount of unit pixel in the image plane corresponds to an object<br />
#82058 - $15.00 USD Received 12 Apr 2007; revised 7 Jun 2007; accepted 27 Jun 2007; published 17 Aug 2007<br />
(C) 2007 OSA 20 August 2007 / Vol. 15, No. 17 / OPTICS EXPRESS 11013
displacement of 42.4μm . Under the illumination by a halogen lamp, sequences of the water<br />
flow seeded by tea leaves were recorded at a frame rate of 125 frames per second. Though we<br />
have referred to the observed random pattern as a speckle-like pattern, strictly it is not a<br />
generic speckle pattern of interference nature, but rather represents the image of the floating<br />
particles with random shapes. This means that our experiment also serves as a demonstration<br />
that the proposed technique can be applied to a wider class of random patterns including nongeneric<br />
speckle patterns observed on an object illuminated by incoherent light [24]. From<br />
every recorded image, we generated an isotropic complex L-G signal by Laguerre-Gauss<br />
filtering, and retrieved the pseudophase information. In the experiment, we carefully adjusted<br />
the density of the pseudophase singularities by choosing a proper bandwidth of the Laguerre-<br />
Gauss filter ω = 10 pixels in Eq. (2), so that the pseudophase singularities on the water surface<br />
are clearly separated, and each tea leaf corresponds to one pseudophase singularity. After<br />
identifying the corresponding pseudophase singularities through their fingerprints as described<br />
above, and determining their coordinates for every two consecutive pictures, we conducted<br />
the velocity measurement and the flow analysis.<br />
(a)<br />
(b)<br />
(c)<br />
(d)<br />
Fig. 3. Recorded images, (a) and (b), of the floating tea leaves on the water surface at different<br />
instants of time separated by 8 ms and the corresponding L-G signals, (c) and (d), with positive<br />
and negative pseudophase singularities indicated by red and green dots.<br />
Two examples of the recorded images for the floating tea leaves at different instants of<br />
time are shown in Figs. 3(a) and 3(b). The image in Fig. 3(b) was recorded after 8 ms from the<br />
recording of Fig. 3(a). The corresponding amplitude distributions of the generated L-G signals<br />
of the recorded images are shown in Figs. 3(c) and 3(d), where the locations of the positively<br />
and negatively signed pseudophase singularities are indicated by points in red and green,<br />
respectively. In these figures, we can observe that every tea leaf has experienced a different<br />
#82058 - $15.00 USD Received 12 Apr 2007; revised 7 Jun 2007; accepted 27 Jun 2007; published 17 Aug 2007<br />
(C) 2007 OSA 20 August 2007 / Vol. 15, No. 17 / OPTICS EXPRESS 11014
amount of movement during the recording period, and the pseudophase singularities have<br />
maintained their spatial structures even after being translated with respect to each other by an<br />
amount corresponding to its complicated movement. As expected, for most of the<br />
pseudophase singularities we were able to find their correct counterparts through their unique<br />
fingerprints represented on the Poincaré sphere. The coordinate differences between the<br />
corresponding pseudophase singularities gave a good estimate for the movements of the<br />
floating leaves, and can be used for kinematic analysis of fluids, provided that we use only<br />
successfully matched phase singularities.<br />
However, we also found that some pseudophase singularities failed to find their matching<br />
counterparts. This phenomenon may be attributed to the following: because of the distortion<br />
of the appearance of the tea leaves during flow, the recorded images begin to change their<br />
shapes; in other words, speckle decorrelation increases when the time interval between two<br />
recorded images is large. This gives rise to the creation or annihilation of singularities in the<br />
pseudophase map. Meanwhile, the local shape change in the recorded images also introduces<br />
the distortions of the core structures of the pseudophase singularities, which occurs<br />
particularly near annihilations. These newly created or annihilated pseudophase singularities<br />
have no counterparts to match in the pseudophase map. Furthermore, the distortion of the core<br />
structure for the pseudophase singularities increases the difficulty in finding the correct<br />
counterparts for calculation of their coordinate difference.<br />
Fig. 4. Distribution of anisotropic pseudophase singularities on Poincaré sphere<br />
Based on the generated complex L-G signal representation of recorded tea images, we can<br />
obtain the Stokes-like parameters around each pseudophase singularities and displayed them<br />
on the surface of Poincaré sphere as shown in Fig. 4. As anticipated, each pseudophase<br />
singularity has its unique anisotropic core structures with different ellipticity and azimuth<br />
angles from each other, and these ellipticity and azimuth angles have almost uniform<br />
distribution on Poincaré sphere with slight concentration at the two poles. It is this uniqueness<br />
of the anisotropy that enables the correct identification and the tracking of the complicated<br />
movement of pseudophase singularities through its fingerprints expressed by the Stokes-like<br />
parameter. Figure 5 shows an example for the in-plane movements of phase singularities,<br />
where the locations of phase singularities before and after displacement are indicated by open<br />
circles and filled squares, respectively. In this identification process to find the correct<br />
counterparts for pseudophase singularities, the threshold value in Eq. (11) was selected<br />
as ε = 0.1 , and the search was performed in the neighborhood area within 30× 30 square<br />
pixels; this is because the recording speed of the high-speed camera is much faster than the<br />
#82058 - $15.00 USD Received 12 Apr 2007; revised 7 Jun 2007; accepted 27 Jun 2007; published 17 Aug 2007<br />
(C) 2007 OSA 20 August 2007 / Vol. 15, No. 17 / OPTICS EXPRESS 11015
fluid velocity so that the phase singularities do not move more than 30 pixels between<br />
successive frames. After identifying the corresponding pseudophase singularities for each pair<br />
of consecutive images making use of their Poincaré sphere representation of the core<br />
structures as fingerprints, we traced the complicated movement of the pseudophase<br />
singularities. Figure 6 shows an example of the trajectories for the selected four tea leaves for<br />
99 frames of recorded images, where the arrows indicate their movement directions at<br />
different instants of time. As expected when blowing the water surface, the central flow had a<br />
large velocity and pushed the tea leaves aside, so that these floating particles at the left and<br />
right part of the water have counterclockwise and clockwise movements, respectively, being<br />
pushed back by the wall of the circular container. We also found that some phase singularities<br />
changed the directions of their movement abruptly due to collision between leaves, as shown<br />
trajectory C in Fig. 6.<br />
Fig. 5. Displacement of pseudophase singularities; singularities before and after displacement<br />
are indicated by open circles and filled squares, respectively.<br />
B<br />
C<br />
D<br />
A<br />
Fig. 6. Trajectories of different tea leaves on the water surface.<br />
From the coordinate changes ( Δx, Δ y)<br />
for each registered pseudophase singularity, we<br />
obtained the 2-D displacement distances along x - and y -directions for each time interval<br />
between exposures Δ t . Therefore, the horizontal and vertical components of velocity can be<br />
expressed as: vx<br />
=Δx Δ t , and v y =Δy Δ t , where the time interval is Δ t = 8ms in this<br />
example. Figure 7(a) shows an example of the velocity history for tea leaf A in Fig. 6, where<br />
2 2 1 2<br />
the dash dot line, dashed line, and the solid line indicate v x , v y , and v = ( vx<br />
+ vy)<br />
,<br />
#82058 - $15.00 USD Received 12 Apr 2007; revised 7 Jun 2007; accepted 27 Jun 2007; published 17 Aug 2007<br />
(C) 2007 OSA 20 August 2007 / Vol. 15, No. 17 / OPTICS EXPRESS 11016
espectively. As anticipated, the tea leaf velocity has a fluctuating structure due to the<br />
advection with the water. At the beginning of the measurement, the vertical component of the<br />
velocity v y played a dominant role with a relatively larger value than the horizontal part of<br />
velocity. As time goes by, the two velocity components decrease, and the tea leaf finally cease<br />
their movement due to fluid damping. After calculating the finite difference for the horizontal<br />
and vertical velocity components, we obtained the variation of the tea leaf acceleration as<br />
shown in Fig. 7(b). Under the reasonable assumption that the mass of the particle is constant<br />
during the recording process, Fig. 7(b) provides a local force diagrams for the tea leaf A at the<br />
different instants of time. From the solid curve for the acceleration sum, we can also observe<br />
the local acceleration peaks stemming from the collision force that the tea leaf received from<br />
other tea leaves during its random movements.<br />
v = v + v<br />
2 2<br />
x y<br />
v x<br />
v y<br />
(a)<br />
2 2<br />
x y<br />
a = a + a<br />
a x<br />
a y<br />
(b)<br />
Fig. 7. Measurement results of the velocity (a) and acceleration (b) for the tea leaf A in Fig. 6.<br />
Meanwhile, we also obtained the spinning angular displacement Δ ϕ around the center of<br />
the phase singularity from the change of azimuth angle for each registered pseudophase<br />
singularity, and estimated the spin angular velocity based on: Ω=Δϕ<br />
Δ t as shown in Fig.<br />
8(a). After the calculation of the finite difference for the spin angular velocity, we obtained<br />
the history of the spin angular acceleration in Fig. 8(b), that is proportional to the applied<br />
#82058 - $15.00 USD Received 12 Apr 2007; revised 7 Jun 2007; accepted 27 Jun 2007; published 17 Aug 2007<br />
(C) 2007 OSA 20 August 2007 / Vol. 15, No. 17 / OPTICS EXPRESS 11017
torque on the tea leaf A because of the constant moment of inertia. Therefore, Figs 7 and 8<br />
serve as an experimental demonstration of the validity of the proposed Optical Vortex<br />
Metrology for fluid mechanics measurement based on the anisotropic core structure of<br />
pseudophase singularities.<br />
(a)<br />
(b)<br />
Fig. 8. Measurement results of the spin angular velocity (a) and spin angular acceleration (b)<br />
for the tea leaf A in Fig. 6.<br />
4. Conclusions<br />
In summary, we have proposed a technique for fluid kinematic analysis based on the<br />
improved Optical Vortex Metrology, which makes use of the elliptic anisotropy of the<br />
pseudophase singularities in the complex L-G signal representation of a speckle-like pattern.<br />
In analogy with the polarization of the vector wave field, a set of Stokes-like parameters has<br />
been applied for the description of the gradient field of the complex L-G signal around a<br />
pseudophase singularity, and the Poincaré sphere representation has been used as unique<br />
fingerprints attached to the seeding particles moving with the flow. Experiments have been<br />
performed that demonstrate the validity of the proposed technique applied for fluid dynamical<br />
measurements. Furthermore, the registration of the pseudophase singularities based on their<br />
anisotropic core structures facilitate quantitative characterization of the local structures of the<br />
#82058 - $15.00 USD Received 12 Apr 2007; revised 7 Jun 2007; accepted 27 Jun 2007; published 17 Aug 2007<br />
(C) 2007 OSA 20 August 2007 / Vol. 15, No. 17 / OPTICS EXPRESS 11018
individual particles, and thus introduces new opportunities to explore other potential<br />
applications of the concept of phase singularities in experimental mechanics.<br />
Acknowledgment<br />
Part of this work was supported by Grant-in-Aid of JSPS B(2) No.18360034, Grant-in-Aid of<br />
JSPS Fellow 15.52421, and by The 21st Century Center of Excellence(COE) Program on<br />
“Innovation of Coherent Optical Science” granted to The University of Electro-<br />
Communications. MRD is a Royal Society University Research Fellow.<br />
#82058 - $15.00 USD Received 12 Apr 2007; revised 7 Jun 2007; accepted 27 Jun 2007; published 17 Aug 2007<br />
(C) 2007 OSA 20 August 2007 / Vol. 15, No. 17 / OPTICS EXPRESS 11019