Experiment 18 Ohm's Law
Experiment 18 Ohm's Law
Experiment 18 Ohm's Law

You also want an ePaper? Increase the reach of your titles
YUMPU automatically turns print PDFs into web optimized ePapers that Google loves.
<strong>Experiment</strong> <strong>18</strong><br />
Ohm’s <strong>Law</strong><br />
Advance Reading:<br />
(Serway and Jewett) Chapter 27<br />
Sections 27-1, 27-2 and 27-6<br />
Equipment:<br />
1 universal circuit board<br />
1 1-15 volt power supply<br />
2 DMMs with leads<br />
1 150 Ω resistor<br />
1 330 Ω resistor<br />
1 560 Ω resistor<br />
1 jumper (i.e., shunt)<br />
1 14 volt light bulb and socket 2 wire leads<br />
Objective:<br />
The object of this lab is to examine the<br />
relationship called <strong>Ohm's</strong> <strong>Law</strong> by<br />
determining the current versus potential<br />
relationship of resistors and a light bulb.<br />
Additionally, students will be introduced to<br />
the resistor color code.<br />
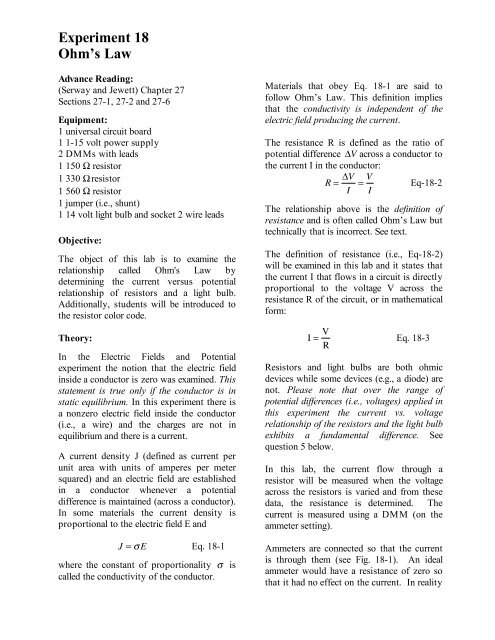
Materials that obey Eq. <strong>18</strong>-1 are said to<br />
follow Ohm’s <strong>Law</strong>. This definition implies<br />
that the conductivity is independent of the<br />
electric field producing the current.<br />
The resistance R is defined as the ratio of<br />
potential difference !V across a conductor to<br />
the current I in the conductor:<br />
R = !V I<br />
= V I<br />
Eq-<strong>18</strong>-2<br />
The relationship above is the definition of<br />
resistance and is often called Ohm’s <strong>Law</strong> but<br />
technically that is incorrect. See text.<br />
The definition of resistance (i.e., Eq-<strong>18</strong>-2)<br />
will be examined in this lab and it states that<br />
the current I that flows in a circuit is directly<br />
proportional to the voltage V across the<br />
resistance R of the circuit, or in mathematical<br />
form:<br />
Theory:<br />
I = V R<br />
Eq. <strong>18</strong>-3<br />
In the Electric Fields and Potential<br />
experiment the notion that the electric field<br />
inside a conductor is zero was examined. This<br />
statement is true only if the conductor is in<br />
static equilibrium. In this experiment there is<br />
a nonzero electric field inside the conductor<br />
(i.e., a wire) and the charges are not in<br />
equilibrium and there is a current.<br />
A current density J (defined as current per<br />
unit area with units of amperes per meter<br />
squared) and an electric field are established<br />
in a conductor whenever a potential<br />
difference is maintained (across a conductor).<br />
In some materials the current density is<br />
proportional to the electric field E and<br />
J = ! E Eq. <strong>18</strong>-1<br />
where the constant of proportionality ! is<br />
called the conductivity of the conductor.<br />
Resistors and light bulbs are both ohmic<br />
devices while some devices (e.g., a diode) are<br />
not. Please note that over the range of<br />
potential differences (i.e., voltages) applied in<br />
this experiment the current vs. voltage<br />
relationship of the resistors and the light bulb<br />
exhibits a fundamental difference. See<br />
question 5 below.<br />
In this lab, the current flow through a<br />
resistor will be measured when the voltage<br />
across the resistors is varied and from these<br />
data, the resistance is determined. The<br />
current is measured using a DMM (on the<br />
ammeter setting).<br />
Ammeters are connected so that the current<br />
is through them (see Fig. <strong>18</strong>-1). An ideal<br />
ammeter would have a resistance of zero so<br />
that it had no effect on the current. In reality
ammeters have some resistance. On the other<br />
hand, the ideal voltmeter (the DMM in this<br />
case) has an infinite resistance.<br />
(approximately 10 7 Ω for your DMM) This<br />
keeps the voltmeter from becoming an<br />
alternate path of current flow around the<br />
circuit element being measured.<br />
The potential difference will be measured<br />
with the Digital multimeter, as in the Electric<br />
Field experiment. Voltmeters are connected<br />
in parallel to resistive elements in the circuit<br />
so that it measures the potential difference on<br />
each side of the element. The ideal voltmeter<br />
has an infinite resistance so that only a<br />
minuscule amount of current is through the<br />
voltmeter.<br />
+<br />
First Digit<br />
Second Digit<br />
Multiplier<br />
Figure <strong>18</strong>-2<br />
Tolerance<br />
Color Number Multiplier<br />
Black 0 10 0<br />
Brown 1 10 1<br />
Red 2 10 2<br />
Orange 3 10 3<br />
Yellow 4 10 4<br />
Green 5 10 5<br />
Blue 6 10 6<br />
Violet 7 10 7<br />
Gray 8 10 8<br />
White 9 10 9<br />
0-15v<br />
Power<br />
Supply<br />
R<br />
Tolerance<br />
Gold 5%<br />
Silver 10%<br />
no band 20%<br />
-<br />
Figure <strong>18</strong>-3<br />
Resistor Color Code<br />
A<br />
Figure <strong>18</strong>-1<br />
There is a color coding scheme used to<br />
identify the value of the resistance of a<br />
resistor. The first two color bands give the<br />
first two digits in the resistance value. The<br />
third band gives the multiplier for the first<br />
two in powers of ten. The last color is the<br />
tolerance. For example, a resistor that has<br />
two red bands and a black multiplier band,<br />
has a resistance of 22Ω. The figures below<br />
give the color code.<br />
Procedure:<br />
1. Make a simple series circuit with the 150<br />
Ω (as shown in fig. <strong>18</strong>-1), using the power<br />
supply, milliammeter (DMM), shunt, and<br />
wire leads. Have the circuit approved by<br />
your instructor before turning anything<br />
on.<br />
CAUTION: NEVER HOOK AN<br />
AMMETER IN PARALLEL WITH A<br />
POWER SUPPLY. IT HAS A<br />
RESISTANCE CLOSE TO ZERO AND<br />
COULD BE DAMAGED or blow a fuse.<br />
2. Plug in the power supply and adjust the<br />
voltage until the DMM reads a one-volt<br />
potential difference across the resistor.
Using the 2 nd DMM measure the current. Set<br />
DMM on 200 milliamp setting.<br />
3. Increase the voltage in one-volt increments<br />
up to 12 volts, measuring the current through<br />
the resistor at each voltage level. Record all<br />
values of current I in amperes and voltage V<br />
in volts.<br />
4. Repeat this procedure for the<br />
330 Ω and 560 Ω resistors.<br />
5. Graph I vs. V and plot a best-fit line for<br />
each of the resistors on the same graph.<br />
Calculate the slope of each line. From these<br />
slopes, obtain the value of the resistances R<br />
for the resistors. Be sure to label each of the<br />
slopes appropriately.<br />
6. Measure the resistance of each resistor<br />
using the ohmmeter function of the DMM.<br />
Do this by placing the input wires in the<br />
correct holes on the DMM and turning the<br />
dial to the ohms (Ω) position. The DMM<br />
provides a potential difference between the<br />
leads and measures the amount of current<br />
through the resistance. Be sure and write<br />
down color code values, including tolerances.<br />
(see figure <strong>18</strong>-2).<br />
of the resistors? If they do not, what might<br />
be the reason for this?<br />
2. Calculate the cost of running the light bulb<br />
you used in lab at 12 volts for one year. Go<br />
online or use an electric bill to determine the<br />
cost of a kilowatt-hour of electricity.<br />
Calculate the cost of a computer left on for<br />
one year. Give type of computer (i.e.,<br />
laptop, desktop and maker if you use your<br />
own computer). Show all work.<br />
3. The power output of a circuit is given by<br />
P = i 2 R = V 2<br />
= iV Eq. <strong>18</strong>-3<br />
R<br />
Calculate the power output of each resistive<br />
element when a potential of 12 volts is<br />
applied.<br />
4. Verify dimensionally that equation <strong>18</strong>-3 is<br />
correct. What are the units of power output?<br />
5. Is the graph of I vs. V for the light bulb<br />
linear? What type of curve fit did your light<br />
bulb have? What does this tell you about the<br />
resistance of a light bulb as the filament gets<br />
hotter?<br />
7. Replace the resistors with the light bulb<br />
and repeat step 3 (except for light bulb use<br />
0.2-volts increments up to one volt and then<br />
one-volt increments up to 12 volts). Plot a<br />
graph of I vs. V for the light bulb, only this<br />
time curve fit the data using a best fit<br />
curve.<br />
Questions/Conclusions:<br />
1. Calculate the percent difference between<br />
the color code value and the experimental<br />
value found in this experiment for each<br />
resistor. Do these values fall within the<br />
bounds of the precision printed on the sides