Min-protein oscillations in Escherichia coli with spontaneous ...
Min-protein oscillations in Escherichia coli with spontaneous ...
Min-protein oscillations in Escherichia coli with spontaneous ...

You also want an ePaper? Increase the reach of your titles
YUMPU automatically turns print PDFs into web optimized ePapers that Google loves.
PHYSICAL REVIEW E 73, 021904 2006<br />
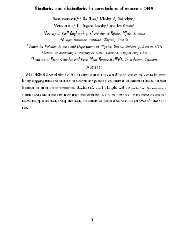
<strong>M<strong>in</strong></strong>-<strong>prote<strong>in</strong></strong> <strong>oscillations</strong> <strong>in</strong> <strong>Escherichia</strong> <strong>coli</strong> <strong>with</strong> <strong>spontaneous</strong> formation of two-stranded filaments<br />
<strong>in</strong> a three-dimensional stochastic reaction-diffusion model<br />
Nenad Pav<strong>in</strong>, 1 Hana Čipčić Paljetak, 2 and Vladimir Krstić 1<br />
1 Department of Physics, Faculty of Science, University of Zagreb, Zagreb, Croatia<br />
2 PLIVA Research Institute Ltd., Zagreb, Croatia<br />
Received 31 May 2005; revised manuscript received 28 November 2005; published 13 February 2006<br />
We <strong>in</strong>troduce a three-dimensional stochastic reaction-diffusion model to describe <strong>M<strong>in</strong></strong>D/<strong>M<strong>in</strong></strong>E dynamical<br />
structures <strong>in</strong> <strong>Escherichia</strong> <strong>coli</strong>. This model <strong>spontaneous</strong>ly generates pole-to-pole <strong>oscillations</strong> of the membraneassociated<br />
<strong>M<strong>in</strong></strong>D <strong>prote<strong>in</strong></strong>s, <strong>M<strong>in</strong></strong>E r<strong>in</strong>g, as well as filaments of the membrane-associated <strong>M<strong>in</strong></strong>D <strong>prote<strong>in</strong></strong>s. Experimental<br />
data suggest <strong>M<strong>in</strong></strong>D filaments are two-stranded. In order to model them we assume that each membraneassociated<br />
<strong>M<strong>in</strong></strong>D <strong>prote<strong>in</strong></strong> can form up to three bonds <strong>with</strong> adjacent membrane-associated <strong>M<strong>in</strong></strong>D molecules and<br />
that <strong>M<strong>in</strong></strong>E <strong>in</strong>duced hydrolysis strongly depends on the number of bonds <strong>M<strong>in</strong></strong>D has established.<br />
DOI: 10.1103/PhysRevE.73.021904<br />
PACS numbers: 87.17.Ee, 87.16.Ac, 87.16.Ka<br />
A division site <strong>in</strong> the rod-shaped bacterium E. <strong>coli</strong> is determ<strong>in</strong>ed<br />
by the location of the FtsZ-r<strong>in</strong>g 1. Two major<br />
factors known to be important for placement of the FtsZ r<strong>in</strong>g<br />
are nucleoid occlusion and <strong>M<strong>in</strong></strong>-<strong>prote<strong>in</strong></strong> <strong>oscillations</strong> 2.<br />
Nucleoid occlusion restricts possible division sites to regions<br />
void of DNA—near the center and poles of the cell—while<br />
rapid pole-to-pole <strong>M<strong>in</strong></strong> <strong>oscillations</strong> exclude poles as the possible<br />
division site 3,4.<br />
The <strong>M<strong>in</strong></strong> system consists of three <strong>prote<strong>in</strong></strong>s: <strong>M<strong>in</strong></strong>C, <strong>M<strong>in</strong></strong>D,<br />
and <strong>M<strong>in</strong></strong>E. <strong>M<strong>in</strong></strong>D and <strong>M<strong>in</strong></strong>E <strong>prote<strong>in</strong></strong>s generate pole-to-pole<br />
<strong>oscillations</strong>, while <strong>M<strong>in</strong></strong>C <strong>prote<strong>in</strong></strong>s are be<strong>in</strong>g recruited to the<br />
membrane by <strong>M<strong>in</strong></strong>D and hence follow the same oscillatory<br />
pattern 5. Whereas <strong>M<strong>in</strong></strong>C <strong>in</strong>hibits polymerization of FtsZ<br />
6, pole-to-pole <strong>oscillations</strong> prevent asymmetric cell division.<br />
<strong>M<strong>in</strong></strong>D <strong>prote<strong>in</strong></strong>s <strong>in</strong> the ATP-bound form <strong>M<strong>in</strong></strong>D:ATP<br />
attach to the membrane and presumably form two-stranded<br />
filaments arranged <strong>in</strong>to a helix 7–9. <strong>M<strong>in</strong></strong>E <strong>prote<strong>in</strong></strong>s function<br />
as homodimers 10; they attach to the membrane-associated<br />
<strong>M<strong>in</strong></strong>D:ATP where they <strong>in</strong>duce ATP hydrolysis, releas<strong>in</strong>g subsequently<br />
<strong>M<strong>in</strong></strong>D:ADP, <strong>M<strong>in</strong></strong>E, and phosphate <strong>in</strong>to the cytoplasm.<br />
The released <strong>M<strong>in</strong></strong>D:ADP cannot b<strong>in</strong>d to the membrane,<br />
until a nucleotide exchange takes place 7.<br />
There are several analytical 11–17 and stochastic models<br />
18 that successfully reproduce <strong>M<strong>in</strong></strong> <strong>oscillations</strong>. In this<br />
work we <strong>in</strong>troduce the three-dimensional stochastic model.<br />
Our model, <strong>in</strong> contrast to others, takes <strong>in</strong>to account a f<strong>in</strong>ite<br />
size of <strong>M<strong>in</strong></strong> molecules and their spatial organization on the<br />
membrane.<br />
1 Cytoplasmic <strong>M<strong>in</strong></strong>D:ATP freely diffuses; when near the<br />
membrane it tries to attach to it <strong>in</strong> two ways: i either <strong>in</strong>dependently<br />
of other <strong>M<strong>in</strong></strong>D:ATP molecules already attached,<br />
ii or it tries to become a part of a double cha<strong>in</strong> of <strong>M<strong>in</strong></strong>D-<br />
:ATP molecules two-stranded filament already formed on<br />
the membrane.<br />
2 <strong>M<strong>in</strong></strong>E freely diffuses through cytoplasm. It does not<br />
attach to the membrane nor cytoplasmic <strong>M<strong>in</strong></strong>D. However,<br />
<strong>M<strong>in</strong></strong>E can attach to the membrane-associated <strong>M<strong>in</strong></strong>D:ATP<br />
form<strong>in</strong>g a <strong>M<strong>in</strong></strong>E-<strong>M<strong>in</strong></strong>D:ATP complex.<br />
3 <strong>M<strong>in</strong></strong>E <strong>prote<strong>in</strong></strong> <strong>in</strong> the membrane-associated <strong>M<strong>in</strong></strong>E-<br />
<strong>M<strong>in</strong></strong>D:ATP complex stimulates detachment of the complex<br />
from the membrane by <strong>in</strong>duc<strong>in</strong>g ATP hydrolysis, releas<strong>in</strong>g<br />
subsequently <strong>M<strong>in</strong></strong>D:ADP, <strong>M<strong>in</strong></strong>E, and phosphate <strong>in</strong>to the cytoplasm.<br />
4 The <strong>M<strong>in</strong></strong>D:ADP complex cannot attach to the membrane<br />
until it is transformed back <strong>in</strong>to <strong>M<strong>in</strong></strong>D:ATP by nucleotide<br />
exchange.<br />
In our model each molecule is treated as a po<strong>in</strong>tlike particle,<br />
except when on the membrane where the molecule size<br />
is taken <strong>in</strong>to account.<br />
The diffusion process <strong>in</strong> three-dimensional space is described<br />
us<strong>in</strong>g Smoluchowski dynamics 19,20. A molecule<br />
starts from a well-def<strong>in</strong>ed position r at time t and diffuses<br />
THE MODEL AND SIMULATIONS<br />
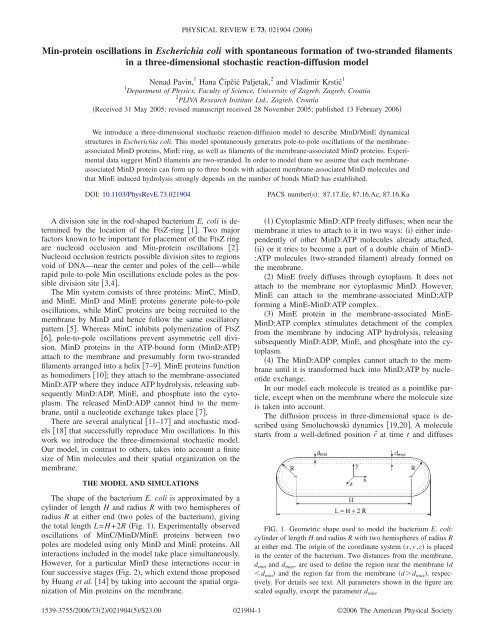
The shape of the bacterium E. <strong>coli</strong> is approximated by a<br />
cyl<strong>in</strong>der of length H and radius R <strong>with</strong> two hemispheres of<br />
radius R at either end two poles of the bacterium, giv<strong>in</strong>g<br />
the total length L=H+2R Fig. 1. Experimentally observed<br />
<strong>oscillations</strong> of <strong>M<strong>in</strong></strong>C/<strong>M<strong>in</strong></strong>D/<strong>M<strong>in</strong></strong>E <strong>prote<strong>in</strong></strong>s between two<br />
poles are modeled us<strong>in</strong>g only <strong>M<strong>in</strong></strong>D and <strong>M<strong>in</strong></strong>E <strong>prote<strong>in</strong></strong>s. All<br />
<strong>in</strong>teractions <strong>in</strong>cluded <strong>in</strong> the model take place simultaneously.<br />
However, for a particular <strong>M<strong>in</strong></strong>D these <strong>in</strong>teractions occur <strong>in</strong><br />
four successive stages Fig. 2, which extend those proposed<br />
by Huang et al. 14 by tak<strong>in</strong>g <strong>in</strong>to account the spatial organization<br />
of <strong>M<strong>in</strong></strong> <strong>prote<strong>in</strong></strong>s on the membrane.<br />
FIG. 1. Geometric shape used to model the bacterium E. <strong>coli</strong>:<br />
cyl<strong>in</strong>der of length H and radius R <strong>with</strong> two hemispheres of radius R<br />
at either end. The orig<strong>in</strong> of the coord<strong>in</strong>ate system x,y,z is placed<br />
<strong>in</strong> the center of the bacterium. Two distances from the membrane,<br />
d m<strong>in</strong> and d max , are used to def<strong>in</strong>e the region near the membrane d<br />
d m<strong>in</strong> and the region far from the membrane dd max , respectively.<br />
For details see text. All parameters shown <strong>in</strong> the figure are<br />
scaled equally, except the parameter d m<strong>in</strong> .<br />
1539-3755/2006/732/0219045/$23.00<br />
021904-1<br />
©2006 The American Physical Society
PAVIN, PALJETAK, AND KRSTIĆ<br />
PHYSICAL REVIEW E 73, 021904 2006<br />
FIG. 2. Schematic representation of four stages <strong>in</strong> <strong>M<strong>in</strong></strong>D/<strong>M<strong>in</strong></strong>E <strong>prote<strong>in</strong></strong>s dynamics. 1. <strong>M<strong>in</strong></strong>D:ATP b<strong>in</strong>ds to the <strong>in</strong>ner layer of the<br />
cytoplasmic membrane; 2. <strong>M<strong>in</strong></strong>E b<strong>in</strong>ds to the membrane-associated <strong>M<strong>in</strong></strong>D:ATP; 3. <strong>M<strong>in</strong></strong>E <strong>in</strong>duces ATP hydrolysis, releas<strong>in</strong>g subsequently<br />
<strong>M<strong>in</strong></strong>D:ADP, <strong>M<strong>in</strong></strong>E, and phosphate <strong>in</strong>to the cytoplasm; 4 <strong>M<strong>in</strong></strong>D:ADP is converted back <strong>in</strong>to <strong>M<strong>in</strong></strong>D:ATP by nucleotide exchange.<br />
dur<strong>in</strong>g a time t. Probability density for f<strong>in</strong>d<strong>in</strong>g a molecule<br />
at time t+t at a position r+r is described by<br />
pr + r,t + t = G s xG s yG s z,<br />
1<br />
G s x 1<br />
s 2<br />
exp− x2<br />
2s 2 , 2<br />
s 2Dt,<br />
where G s x is a normalized Gaussian distribution <strong>with</strong> deviation<br />
s diffusion length, and diffusion coefficient D.<br />
The position of the molecule at time t+t is obta<strong>in</strong>ed by<br />
add<strong>in</strong>g random displacement to the current position where<br />
distribution of random displacements obeys 1. Generally,<br />
time steps t do not have to be kept constant. In our simulation<br />
we use adaptive t <strong>in</strong> order to focus computational<br />
effort on important time segments. Because diffusion and<br />
unimolecular reactions are the only processes that take place<br />
<strong>in</strong> the region far away from the membrane, one can use<br />
longer time step <strong>in</strong> that region than <strong>in</strong> the region near the<br />
membrane where, <strong>in</strong> addition, bimolecular processes occur.<br />
These two regions are def<strong>in</strong>ed us<strong>in</strong>g two free model parameters<br />
d m<strong>in</strong> and d max —characteristic distances from the membrane<br />
Fig. 1. In the region far away from the membrane<br />
dd max time step used is significantly longer than time<br />
3<br />
step used <strong>in</strong> the region near the membrane dd m<strong>in</strong> .Inthe<br />
transitional region d m<strong>in</strong> dd max time step is gradually decreased<br />
when approach<strong>in</strong>g the membrane, to avoid that molecules<br />
enter<strong>in</strong>g the region near the membrane diffuse too far,<br />
avoid<strong>in</strong>g on their path bimolecular reactions. For the same<br />
reason, time step t <strong>in</strong> the region near the membrane has to<br />
be chosen such that condition s 2Dtdm<strong>in</strong> is satisfied.<br />
In our model, parameter d m<strong>in</strong> is also used as the reaction<br />
radius parameter for all bimolecular reactions. Hence, the<br />
cytoplasmic <strong>M<strong>in</strong></strong>D:ATP molecule can attach to the membrane<br />
only when it is <strong>in</strong> the region near the membrane. Probability<br />
for this reaction is given by the simple <strong>in</strong>tuitive formula:<br />
p D = D<br />
t<br />
d m<strong>in</strong><br />
.<br />
The probability is proportional to time step t—the longer<br />
you wait it is more probable for a reaction to take place—and<br />
<strong>in</strong>versely proportional to d m<strong>in</strong> to ensure that the number of<br />
reactions tak<strong>in</strong>g place depends only on the reaction rate parameter<br />
D and not on the model parameter d m<strong>in</strong> used to<br />
def<strong>in</strong>e the near membrane region. If the reaction occurs, the<br />
molecule attaches to the membrane <strong>with</strong> random orientation.<br />
However, our model forbids this reaction to take place if the<br />
4<br />
021904-2
MIN-PROTEIN OSCILLATIONS IN <strong>Escherichia</strong> <strong>coli</strong>…<br />
PHYSICAL REVIEW E 73, 021904 2006<br />
position where the molecule should b<strong>in</strong>d is already occupied<br />
by another <strong>M<strong>in</strong></strong>D:ATP.<br />
Additionally, cytoplasmic <strong>M<strong>in</strong></strong>D:ATP can react <strong>with</strong> <strong>M<strong>in</strong></strong>-<br />
D:ATP molecules already attached to the membrane. Experimental<br />
data suggest that <strong>M<strong>in</strong></strong>D:ATP attached to the membrane<br />
polymerizes <strong>in</strong>to two-stranded filaments 7–9.<br />
Lack<strong>in</strong>g experimental data on the <strong>in</strong>teraction between<br />
membrane-associated <strong>M<strong>in</strong></strong>D:ATP molecules, we utilize the<br />
simplest assumption <strong>in</strong> which each <strong>M<strong>in</strong></strong>D:ATP molecule can<br />
form up to three bonds <strong>with</strong> adjacent <strong>M<strong>in</strong></strong>D:ATP molecules<br />
Fig. 2. The probability for cytoplasmic <strong>M<strong>in</strong></strong>D:ATP to occupy<br />
any free attachment site that is <strong>with</strong><strong>in</strong> reaction radius<br />
rd m<strong>in</strong> depends on the reaction rate Dd :<br />
t<br />
p Dd = Dd<br />
V ; V = 2 3 d 3<br />
m<strong>in</strong>. 5<br />
An attachment of <strong>M<strong>in</strong></strong>E to the membrane-associated<br />
<strong>M<strong>in</strong></strong>D:ATP complex can take place if molecules are <strong>with</strong><strong>in</strong><br />
the <strong>in</strong>teraction radius rd m<strong>in</strong> and there is no <strong>M<strong>in</strong></strong>E molecule<br />
already attached. The probability for this reaction is<br />
p E = E<br />
t<br />
V ;<br />
V = 2 3 d 3<br />
m<strong>in</strong>. 6<br />
<strong>M<strong>in</strong></strong>E <strong>prote<strong>in</strong></strong> <strong>in</strong> the membrane-associated <strong>M<strong>in</strong></strong>E-<br />
<strong>M<strong>in</strong></strong>D:ATP complex stimulates detachment of the complex<br />
from the membrane by <strong>in</strong>duc<strong>in</strong>g ATP hydrolysis. The probability<br />
for this reaction might depend on the number of<br />
bonds particular <strong>M<strong>in</strong></strong>D:ATP has formed <strong>with</strong> its <strong>M<strong>in</strong></strong>D:ATP<br />
neighbors, and we assume that the number of bonds established<br />
decreases the reaction probability. Let i de<br />
, i<br />
=0,1,2,3 stand for the detachment reaction rate when the<br />
<strong>M<strong>in</strong></strong>D molecule has i bonds established. Hence,<br />
0 de 1 de 2 de 3 de ,<br />
and the probability for this reaction is<br />
p i de =1−exp− i de t.<br />
8<br />
The transformation of <strong>M<strong>in</strong></strong>D:ADP <strong>in</strong>to <strong>M<strong>in</strong></strong>D:ATP by<br />
nucleotide exchange is treated as unimolecular reaction <strong>with</strong><br />
reaction rate ADP→ATP D . Hence, the probability for this reaction<br />
dur<strong>in</strong>g time <strong>in</strong>terval t is<br />
p D ADP→ATP =1−exp− D ADP→ATP t.<br />
RESULTS AND DISCUSSION<br />
In our numerical simulations we have fixed parameters<br />
related to the geometry of the cell Fig. 1 to R=0.5 m<br />
one-half cell width and L=4 m cell length. Diffusion<br />
constants for cytoplasmic <strong>M<strong>in</strong></strong>D and <strong>M<strong>in</strong></strong>E <strong>prote<strong>in</strong></strong>s that are<br />
used, are <strong>in</strong> good agreement <strong>with</strong> measured values for E. <strong>coli</strong><br />
<strong>prote<strong>in</strong></strong>s of similar size 21:<br />
D D = D E = 2.5 m 2 /sec.<br />
10<br />
Reaction rate parameters are chosen such that experimentally<br />
observed <strong>oscillations</strong> are reproduced:<br />
D = 0.01 m/sec,<br />
Dd = 0.003 m 3 /sec,<br />
7<br />
9<br />
FIG. 3. a Orthogonal projection of the membrane-associated<br />
<strong>M<strong>in</strong></strong>D <strong>prote<strong>in</strong></strong>s onto a plane parallel to the l<strong>in</strong>e connect<strong>in</strong>g two poles<br />
of the bacterium. Each projected <strong>prote<strong>in</strong></strong> is represented <strong>with</strong> a dot.<br />
Five time frames are shown. They refer to times 0, 1 4 T, 2 4 T, 3 4 T,T;<br />
where T80 sec is the period of oscillation obta<strong>in</strong>ed <strong>with</strong> parameters<br />
specified <strong>in</strong> the text. b A portion of a is enlarged to clearly<br />
show two-stranded filaments.<br />
E = 0.02 m 3 /sec, D ADP→ATP = 1/sec. 11<br />
These parameters are similar to the parameters that Huang et<br />
al. 14 used <strong>in</strong> their analytical model. However, they use<br />
only one hydrolysis rate parameter, while <strong>in</strong> our model there<br />
are four— i de<br />
, i=0,1,2,3—which obey 7 <strong>with</strong> the ratio:<br />
0 de : 1 de : 2 de : 3 de = 540:135:45:1,<br />
0 de = 7.2 sec −1 .<br />
12<br />
Other ratios have been tested also. It is found that it is essential<br />
to take 3 de<br />
significantly smaller than 2 de<br />
<strong>in</strong> order to<br />
generate <strong>oscillations</strong>, whose period primarily and strongly<br />
depends on the parameter 0 de<br />
. In the case when all i de<br />
were<br />
taken to be identical, the <strong>oscillations</strong> could not be produced<br />
even if other parameters of the model were varied substantially.<br />
In our simulation we use 4000 <strong>M<strong>in</strong></strong>D molecules and 1400<br />
<strong>M<strong>in</strong></strong>E homodimers, reflect<strong>in</strong>g the <strong>in</strong> vivo situation 22. The<br />
two-stranded filament width and the <strong>M<strong>in</strong></strong>D monomer length<br />
are fixed to 6 and 5 nm, respectively 8. The model is<br />
evolved <strong>in</strong> time <strong>with</strong> time step t=410 −5 sec for processes<br />
far from the membrane d max =0.1 m and t=8<br />
10 −7 sec for processes near the membrane d m<strong>in</strong><br />
=0.01 m. In the transitional region time steps are gradually<br />
decreased when approach<strong>in</strong>g the membrane. We have<br />
tested the simulation by significantly vary<strong>in</strong>g parameters d m<strong>in</strong><br />
and t and the same results were obta<strong>in</strong>ed.<br />
With these parameters we have reproduced pole-to-pole<br />
<strong>M<strong>in</strong></strong>D/<strong>M<strong>in</strong></strong>E <strong>oscillations</strong> Figs. 3 and 4 <strong>with</strong> the period T<br />
80 sec, which is compatible <strong>with</strong> experimentally observed<br />
range 30–120 sec 5. Initially, all <strong>M<strong>in</strong></strong>E and <strong>M<strong>in</strong></strong>D are<br />
placed <strong>in</strong> the center of the bacterium. Other <strong>in</strong>itial distributions<br />
were tried e.g., uniform distribution, and the same<br />
type of <strong>oscillations</strong> always appeared after the transient period<br />
last<strong>in</strong>g up to one oscillation cycle.<br />
021904-3
PAVIN, PALJETAK, AND KRSTIĆ<br />
PHYSICAL REVIEW E 73, 021904 2006<br />
FIG. 5. Dependence of the oscillation period on the total number<br />
of <strong>M<strong>in</strong></strong>D and <strong>M<strong>in</strong></strong>E molecules, and the cell length. Po<strong>in</strong>ts marked<br />
by are obta<strong>in</strong>ed <strong>with</strong> parameters used to generate Fig. 3. In a<br />
and b parameters are varied one at a time while keep<strong>in</strong>g the others<br />
fixed. In c, <strong>in</strong>stead of keep<strong>in</strong>g the number of <strong>M<strong>in</strong></strong>D and <strong>M<strong>in</strong></strong>E<br />
fixed, their concentrations are fixed at values used <strong>in</strong> Fig. 3 while<br />
cell length is varied.<br />
FIG. 4. a Histogram for the number of the membraneassociated<br />
<strong>M<strong>in</strong></strong>D <strong>M<strong>in</strong></strong>E <strong>prote<strong>in</strong></strong>s versus x-coord<strong>in</strong>ate, for the same<br />
time frames as <strong>in</strong> Fig. 3. Size of the b<strong>in</strong> used is 0.08 m. b Time<br />
average of the number of the membrane-associated <strong>M<strong>in</strong></strong>D <strong>M<strong>in</strong></strong>E<br />
<strong>prote<strong>in</strong></strong>s over three periods.<br />
Distributions of the membrane-associated <strong>M<strong>in</strong></strong>D/<strong>M<strong>in</strong></strong>E<br />
<strong>prote<strong>in</strong></strong>s do not oscillate <strong>in</strong> phase—<strong>M<strong>in</strong></strong>E distribution lags<br />
after <strong>M<strong>in</strong></strong>D distribution Fig. 4. This phenomenon has been<br />
seen <strong>in</strong> experiments, and it was described as an oscillat<strong>in</strong>g<br />
<strong>M<strong>in</strong></strong>E r<strong>in</strong>g 22. However, when time-averaged both distributions<br />
have a m<strong>in</strong>imum <strong>in</strong> the middle of the cell Fig. 4b<br />
which reflects distribution necessary for proper cell division.<br />
This m<strong>in</strong>imum is experimentally observed only <strong>in</strong> the case of<br />
the <strong>M<strong>in</strong></strong>D <strong>prote<strong>in</strong></strong> oscillation 16. For the time-averaged<br />
<strong>M<strong>in</strong></strong>E distribution there are only model predictions and they<br />
disagree on this po<strong>in</strong>t; e.g., there are models which predict,<br />
<strong>in</strong> contrast to our model prediction, that the time-averaged<br />
<strong>M<strong>in</strong></strong>E distribution has a maximum <strong>in</strong> the middle of the cell<br />
12,18.<br />
To confirm its robustness, the model was additionally<br />
tested for a variety of experimentally observed phenomena.<br />
Fu et al. 23 have found experimentally that the oscillation<br />
period <strong>in</strong>creases <strong>with</strong> the cell length. The overexpression experiments<br />
reveal that the oscillation period <strong>in</strong>creases <strong>with</strong> the<br />
amount of <strong>M<strong>in</strong></strong>D, and decreases <strong>with</strong> the amount of <strong>M<strong>in</strong></strong>E<br />
5. All these phenomena are reproduced <strong>with</strong> our model<br />
Fig. 5. Consistent <strong>with</strong> experiments 5, <strong>in</strong> the case of filamentous<br />
cells the zebra-striped oscillation pattern is obta<strong>in</strong>ed<br />
<strong>spontaneous</strong>ly Fig. 6, start<strong>in</strong>g <strong>with</strong> uniform distributions of<br />
<strong>M<strong>in</strong></strong>D and <strong>M<strong>in</strong></strong>E.<br />
In our model, <strong>M<strong>in</strong></strong>D <strong>prote<strong>in</strong></strong>s attached to the membrane<br />
predom<strong>in</strong>ately form two-stranded filaments Fig. 3b. This<br />
i<br />
is achieved by impos<strong>in</strong>g the ratio 12 to the parameters de<br />
which are responsible for dynamics of both formation and<br />
decomposition of two-stranded filaments. The imposed ratio<br />
strongly favors two-stranded configurations over a group of<br />
s<strong>in</strong>gle molecules—the probability for a group of s<strong>in</strong>gle molecules<br />
to be detached from the membrane is considerably<br />
greater than that for the same group of molecules, but <strong>in</strong> the<br />
form of the two-stranded filament.<br />
The filament appears as an alive object. It is degraded and<br />
rebuilt constantly. When it grows <strong>in</strong> size the build<strong>in</strong>g process<br />
dom<strong>in</strong>ates over the degrad<strong>in</strong>g process. Both processes preferentially<br />
take place at the filament’s end. <strong>M<strong>in</strong></strong>D molecules<br />
located at the end of the filament can form one or two bonds<br />
<strong>with</strong> its neighbors, while other <strong>M<strong>in</strong></strong>D molecules have probably<br />
established three bonds. Because of 12 it is more probable<br />
for <strong>M<strong>in</strong></strong>E to detach <strong>M<strong>in</strong></strong>D molecules locate the filament’s<br />
end. If the build<strong>in</strong>g process dom<strong>in</strong>ates over the<br />
degrad<strong>in</strong>g process, detached <strong>M<strong>in</strong></strong>D molecules will probably<br />
be replaced <strong>with</strong> cytoplasmic <strong>M<strong>in</strong></strong>D:ATP molecules.<br />
However, as the concentration of <strong>M<strong>in</strong></strong>D molecules attached<br />
to the membrane reaches its peak, the concentration<br />
of cytoplasmic <strong>M<strong>in</strong></strong>D:ATP goes to its m<strong>in</strong>imum. At that time<br />
the degrad<strong>in</strong>g process dom<strong>in</strong>ates over the build<strong>in</strong>g process.<br />
Cytoplasmic <strong>M<strong>in</strong></strong>E molecules cont<strong>in</strong>ue to attach to the <strong>M<strong>in</strong></strong>D<br />
molecules of the two-stranded filament. <strong>M<strong>in</strong></strong>D released <strong>in</strong>to<br />
cytoplasm by <strong>M<strong>in</strong></strong>E is <strong>in</strong> the form of the <strong>M<strong>in</strong></strong>D:ADP complex<br />
and cannot b<strong>in</strong>d to the membrane. However, <strong>M<strong>in</strong></strong>E released<br />
<strong>in</strong>to the cytoplasm by the same process attach to free<br />
attachment sites on the filament, thus speed<strong>in</strong>g up its decomposition.<br />
FIG. 6. Space-time plot of the membrane-associated <strong>M<strong>in</strong></strong>D <strong>prote<strong>in</strong></strong>s<br />
<strong>in</strong> the filamentous cell L=15 m. Each <strong>M<strong>in</strong></strong>D is represented<br />
<strong>with</strong> a dot. For the sake of clearness, we have reduced the number<br />
of dots by a factor of 100. Concentrations of <strong>M<strong>in</strong></strong>D and <strong>M<strong>in</strong></strong>E, plus<br />
all the rema<strong>in</strong><strong>in</strong>g model parameters are fixed at values used to obta<strong>in</strong><br />
results <strong>in</strong> Fig. 3.<br />
021904-4
MIN-PROTEIN OSCILLATIONS IN <strong>Escherichia</strong> <strong>coli</strong>…<br />
PHYSICAL REVIEW E 73, 021904 2006<br />
FIG. 7. Membrane-associated <strong>M<strong>in</strong></strong>D <strong>prote<strong>in</strong></strong>s <strong>oscillations</strong>; only a s<strong>in</strong>gle time frame is given. Parameter values are the same as those used<br />
<strong>in</strong> Fig. 3, except Dd =0.02 m 3 /sec, D =0.0005 m/sec, and 0 de<br />
=11.0 sec −1 parameters 1 de<br />
, 2 de<br />
, 3 de<br />
were modified to obey 12.<br />
Two- stranded <strong>M<strong>in</strong></strong>D filaments are longer then those obta<strong>in</strong>ed <strong>in</strong> Fig. 3.<br />
The average length of filaments obta<strong>in</strong>ed <strong>with</strong> our model<br />
depends on the model parameters, particularly on Dd and<br />
D . If we <strong>in</strong>crease the parameter Dd and/or decrease the<br />
parameter D , the probability for attach<strong>in</strong>g <strong>M<strong>in</strong></strong>D to the filament<br />
already formed on the membrane regulated by Dd <br />
will <strong>in</strong>crease <strong>with</strong> respect to the probability for start<strong>in</strong>g a<br />
new filament formation regulated by D . Hence, the average<br />
length of filaments is <strong>in</strong>creased Fig. 7. In order to keep<br />
the period of oscillation similar to the period for the case<br />
shown <strong>in</strong> Fig. 3, hydrolysis rate parameters were modified:<br />
0 de<br />
=11.0 sec −1 , while the same ratio 12 was obeyed.<br />
In conclusion, we have <strong>in</strong>troduced 3D stochastic reactiondiffusion<br />
model to describe <strong>M<strong>in</strong></strong>D/<strong>M<strong>in</strong></strong>E dynamical structures<br />
<strong>in</strong> E. <strong>coli</strong>. In particular, our model <strong>spontaneous</strong>ly generates<br />
two-stranded filaments us<strong>in</strong>g a few simple physical<br />
assumptions.<br />
ACKNOWLEDGMENTS<br />
We thank Ivana Šarić for technical support, and Goran<br />
Mitrović for carefully read<strong>in</strong>g our manuscript.<br />
1 J. Lutkenhaus, Curr. Op<strong>in</strong>. Microbiol. 5, 548 2002.<br />
2 X. C. Yu and W. Margol<strong>in</strong>, Mol. Microbiol. 32, 315 1999.<br />
3 P. A. J. de Boer, R. E. Crossley, and L. I. Rothfield, Cell 56,<br />
641 1989.<br />
4 E. Bi and J. Lutkenhaus, J. Bacteriol. 175, 1118 1993.<br />
5 D. M. Rask<strong>in</strong> and P. A. J. de Boer, Proc. Natl. Acad. Sci.<br />
U.S.A. 96, 4971 1999.<br />
6 Z. Hu, A. Mukherjee, S. Pichoff, and J. Lutkenhaus, Proc.<br />
Natl. Acad. Sci. U.S.A. 96, 14819 1999.<br />
7 Z. Hu, E. P. Gogol, and J. Lutkenhaus, Proc. Natl. Acad. Sci.<br />
U.S.A. 99, 6761 2002.<br />
8 K. Suefuji, R. Valluzzi, and D. RayChaudhuri, Proc. Natl.<br />
Acad. Sci. U.S.A. 99, 16776 2002.<br />
9 Y.-L. Shih, T. Le, and L. Rothfield, Proc. Natl. Acad. Sci.<br />
U.S.A. 100, 7865 2003.<br />
10 G. F. K<strong>in</strong>g et al., Nat. Struct. Biol. 7, 1013 2000.<br />
11 H. Me<strong>in</strong>hardt and P. A. J. de Boer, Proc. Natl. Acad. Sci.<br />
U.S.A. 98, 14202 2001.<br />
12 M. Howard, A. D. Rutenberg, and S. de Vet, Phys. Rev. Lett.<br />
87, 278102 2001.<br />
13 K. Kruse, Biophys. J. 82, 618 2002.<br />
14 K. C. Huang, Y. Meir, and N. S. W<strong>in</strong>green, Proc. Natl. Acad.<br />
Sci. U.S.A. 100, 12724 2003.<br />
15 R. V. Kulkarni, K. C. Huang, M. Kloster, and N. S. W<strong>in</strong>green,<br />
Phys. Rev. Lett. 93, 228103 2004.<br />
16 G. Meacci and K. Kruse, Phys. Biol. 2, 892005.<br />
17 D. A. Drew, M. J. Osborn, and L. I. Rothfield, Proc. Natl.<br />
Acad. Sci. U.S.A. 102, 61142005.<br />
18 M. Howard and A. D. Rutenberg, Phys. Rev. Lett. 90, 128102<br />
2003.<br />
19 M. von Smoluchowski, Z. Phys. Chem., Stoechiom. Verwandtschaftsl.<br />
92, 129 1917.<br />
20 S. S. Andrews and D. Bray, Phys. Biol. 1, 137 2004.<br />
21 M. B. Elowitz, M. G. Surette, P.-E. Wolf, J. B. Stock, and S.<br />
Leibler, J. Bacteriol. 181, 197 1999.<br />
22 Y.-L. Shih, X. Fu, G. F. K<strong>in</strong>g, T. Le, and L. I. Rothfield,<br />
EMBO J. 21, 3347 2002.<br />
23 X. Fu, Y.-L. Shih, Y. Zhang, and L. I. Rothfield, Proc. Natl.<br />
Acad. Sci. U.S.A. 98, 980 2001.<br />
021904-5