Millikan writeup - Physics
Millikan writeup - Physics
Millikan writeup - Physics
You also want an ePaper? Increase the reach of your titles
YUMPU automatically turns print PDFs into web optimized ePapers that Google loves.
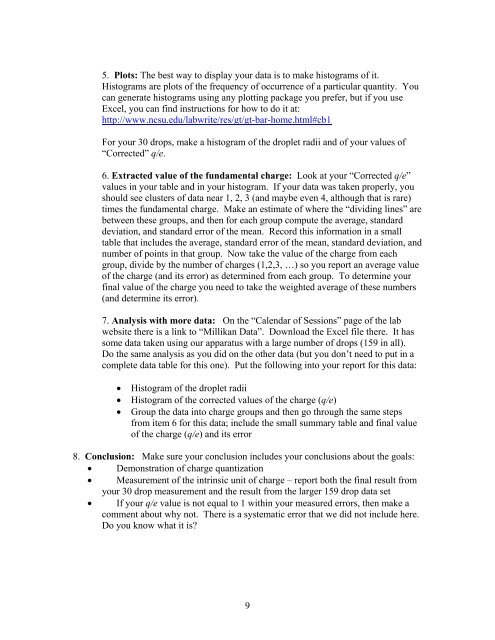
5. Plots: The best way to display your data is to make histograms of it.<br />
Histograms are plots of the frequency of occurrence of a particular quantity. You<br />
can generate histograms using any plotting package you prefer, but if you use<br />
Excel, you can find instructions for how to do it at:<br />
http://www.ncsu.edu/labwrite/res/gt/gt-bar-home.html#cb1<br />
For your 30 drops, make a histogram of the droplet radii and of your values of<br />
“Corrected” q/e.<br />
6. Extracted value of the fundamental charge: Look at your “Corrected q/e”<br />
values in your table and in your histogram. If your data was taken properly, you<br />
should see clusters of data near 1, 2, 3 (and maybe even 4, although that is rare)<br />
times the fundamental charge. Make an estimate of where the “dividing lines” are<br />
between these groups, and then for each group compute the average, standard<br />
deviation, and standard error of the mean. Record this information in a small<br />
table that includes the average, standard error of the mean, standard deviation, and<br />
number of points in that group. Now take the value of the charge from each<br />
group, divide by the number of charges (1,2,3, …) so you report an average value<br />
of the charge (and its error) as determined from each group. To determine your<br />
final value of the charge you need to take the weighted average of these numbers<br />
(and determine its error).<br />
7. Analysis with more data: On the “Calendar of Sessions” page of the lab<br />
website there is a link to “<strong>Millikan</strong> Data”. Download the Excel file there. It has<br />
some data taken using our apparatus with a large number of drops (159 in all).<br />
Do the same analysis as you did on the other data (but you don’t need to put in a<br />
complete data table for this one). Put the following into your report for this data:<br />
<br />
<br />
<br />
Histogram of the droplet radii<br />
Histogram of the corrected values of the charge (q/e)<br />
Group the data into charge groups and then go through the same steps<br />
from item 6 for this data; include the small summary table and final value<br />
of the charge (q/e) and its error<br />
8. Conclusion: Make sure your conclusion includes your conclusions about the goals:<br />
Demonstration of charge quantization<br />
Measurement of the intrinsic unit of charge – report both the final result from<br />
your 30 drop measurement and the result from the larger 159 drop data set<br />
If your q/e value is not equal to 1 within your measured errors, then make a<br />
comment about why not. There is a systematic error that we did not include here.<br />
Do you know what it is?<br />
9


