The need for cross section data for medical x-ray - Carleton University
The need for cross section data for medical x-ray - Carleton University
The need for cross section data for medical x-ray - Carleton University

You also want an ePaper? Increase the reach of your titles
YUMPU automatically turns print PDFs into web optimized ePapers that Google loves.
THE NEED FOR CROSS SECTION DATA<br />
FOR MEDICAL X-RAY SCATTER IMAGING<br />
PAUL C. JOHNS 1,2 , MATTHEW P. WISMAYER 1 , & ROBERT J. LECLAIR 3<br />
1<br />
Dept. of Physics, <strong>Carleton</strong> <strong>University</strong>, Ottawa, Ontario<br />
2<br />
Dept. of Radiology, <strong>University</strong> of Ottawa<br />
3<br />
Dept. of Physics & Astronomy, Laurentian <strong>University</strong>, Sudbury, Ontario<br />
Email: johns@physics.carleton.ca Web pages: http://www.physics.carleton.ca/~johns<br />
leclair@laurentian.ca<br />
http://laurentian.ca/physics/facstaff/leclair.html<br />
Presented at the<br />
5th Annual Canadian Light Source Users’ Meeting, Saskatoon, Saskatchewan, Canada,<br />
16 November 2002.
P.C. Johns, M.P. Wismayer, R.J Leclair - Poster # 14 at the 5th Annual Canadian Light Source Users’ Meeting, Saskatoon, Canada, 16 November 2002.<br />
2.<br />
ABSTRACT<br />
Several labs throughout the world are working on a novel x-<strong>ray</strong> imaging technique, <strong>for</strong> <strong>medical</strong> diagnosis,<br />
which uses the scattered radiation rather than the transmitted primary. In <strong>medical</strong> x-<strong>ray</strong> imaging, up to<br />
90% of the photons approaching the image receptor have been coherently or incoherently scattered.<br />
Coherent scatter is particularly interesting because the x-<strong>ray</strong> diffraction <strong>cross</strong> <strong>section</strong>s of various tissues<br />
can be quite different <strong>for</strong> specific angles and photon energies. Our numerical modelling predicts that <strong>for</strong><br />
several examinations, such as in neuroradiology and in breast imaging, utilizing the <strong>for</strong>ward-scattered x<br />
<strong>ray</strong>s will provide more in<strong>for</strong>mation than using the primary x <strong>ray</strong>s, <strong>for</strong> the same patient radiation dose. In<br />
order to optimize the design of these new imaging systems, there is a <strong>need</strong> to catalogue the differential<br />
scatter <strong>cross</strong> <strong>section</strong>s or <strong>for</strong>m factors over as wide a range of x = λ -1 sin θ/2 as is possible. Current work<br />
on measuring the <strong>cross</strong> <strong>section</strong>s or <strong>for</strong>m factors will be summarized. <strong>The</strong> potential of synchrotron radiation<br />
to provide more accurate measurements will be discussed.
P.C. Johns, M.P. Wismayer, R.J Leclair - Poster # 14 at the 5th Annual Canadian Light Source Users’ Meeting, Saskatoon, Canada, 16 November 2002.<br />
3.<br />
1. INTRODUCTION<br />
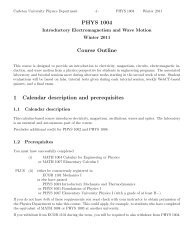
<strong>The</strong> basis of diagnostic radiology conventionally has been to <strong>for</strong>m projection images using x-<strong>ray</strong> photons, using<br />
the geometry of Figure 1. <strong>The</strong> spatial distribution of energy absorbed by the receptor <strong>for</strong>ms the image. <strong>The</strong><br />
radiation from a diagnostic x-<strong>ray</strong> tube spans a range of energy per photon from E . 16 keV up to that corresponding<br />
to the potential, usually # 150 kV.<br />
X-Ray Tube<br />
Primary<br />
Photon<br />
Patient<br />
Scattered<br />
Photon<br />
Anti Scatter<br />
Grid<br />
FIGURE 1. Standard projection<br />
x-<strong>ray</strong> geometry.<br />
X-Ray<br />
Intensity<br />
}<br />
Scatter<br />
Image<br />
Receptor<br />
Position
P.C. Johns, M.P. Wismayer, R.J Leclair - Poster # 14 at the 5th Annual Canadian Light Source Users’ Meeting, Saskatoon, Canada, 16 November 2002.<br />
4.<br />
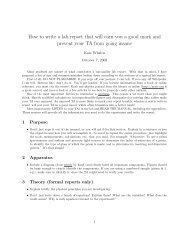
Attenuation in the patient is via three processes: photoelectric absorption, inelastic or incoherent (often called<br />
Compton) scattering, and elastic or coherent scattering. For E > 25 keV, over 50% of the interactions in tissues are<br />
scatterings. 1 Figure 2 shows the <strong>cross</strong> <strong>section</strong>s <strong>for</strong> these 3 processes in water versus photon energy.<br />
H 2<br />
O<br />
Interaction Cross Section ( cm 2 / e − )<br />
0.6<br />
0.4<br />
0.2<br />
0.8 x 10 −24 ↑<br />
incoherent<br />
← photoelectric<br />
Photon Energy (keV)<br />
0.3337 x 10 24 electrons / cm 3<br />
FIGURE 2. X-<strong>ray</strong> interaction <strong>cross</strong> <strong>section</strong>s <strong>for</strong><br />
water in the photon energy range of diagnostic<br />
radiology. (Data from Ref. 2).<br />
0<br />
↑<br />
coherent<br />
10 50 100 150
P.C. Johns, M.P. Wismayer, R.J Leclair - Poster # 14 at the 5th Annual Canadian Light Source Users’ Meeting, Saskatoon, Canada, 16 November 2002.<br />
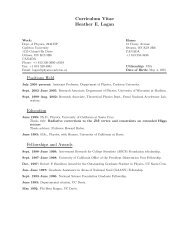
Figure 3 shows <strong>for</strong> the two scattering processes, <strong>for</strong> H 2 O, the differential <strong>cross</strong> <strong>section</strong>s per unit angle versus<br />
scattering angle θ. <strong>The</strong> incoherent <strong>cross</strong> <strong>section</strong> is reduced <strong>for</strong> θ . 0 because of the atomic binding of electrons.<br />
<strong>The</strong> coherent <strong>cross</strong> <strong>section</strong> is strongly peaked at a small θ and at 25 keVexceeds that <strong>for</strong> incoherent <strong>for</strong> θ < 24.6 o .<br />
For lower E this angle is larger. Hence, radiation which reaches the image receptor after one scattering has a large<br />
coherent-scattered component. 5-7<br />
5.<br />
H 2<br />
O 25 keV<br />
FIGURE 3. Cross <strong>section</strong>s at 25 keV <strong>for</strong> x-<strong>ray</strong><br />
scattering in H 2 O at angle θ into a ring of<br />
infinitesimal width dθ. <strong>The</strong> integrals of these<br />
curves are the total scatter <strong>cross</strong> <strong>section</strong>s.<br />
[Sources of <strong>for</strong>m factors used: coherent -<br />
Ref. 3 (25 o C), incoherent - Ref. 4].<br />
dσ/dθ ( cm 2 / e − / radian )<br />
0.5 x 10 −24 0.4<br />
total<br />
0.3<br />
↓<br />
0.2<br />
coherent<br />
0.1<br />
↓<br />
↑<br />
incoherent<br />
0<br />
0 30 60 90 120 150 180<br />
θ, Scattering Angle (degrees)
P.C. Johns, M.P. Wismayer, R.J Leclair - Poster # 14 at the 5th Annual Canadian Light Source Users’ Meeting, Saskatoon, Canada, 16 November 2002.<br />
In conventional projection imaging, most of the photons approaching the image receptor have been scattered in the<br />
patient; the scatter-to-primary ratio can be as high as 10 (Ref. 8). Scatter can significantly degrade projection image<br />
quality [contrast (C) and signal-to-noise ratio (SNR)]. <strong>The</strong> usual fix is geometric rejection using an antiscatter grid<br />
of miniature Pb septa arranged like a venetian blind.<br />
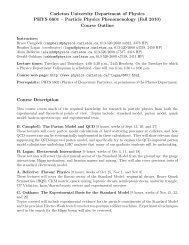
An alternate approach is to use the scattered x <strong>ray</strong>s. Previous investigators have demonstrated imaging <strong>for</strong> medicine<br />
using the <strong>for</strong>ward scatter 9-11 and backscatter, 12,13 and the use of <strong>for</strong>ward scatter <strong>for</strong> non-destructive testing. 14,15 In<br />
principle, simultaneous measurements of <strong>for</strong>ward scatter, backscatter, and transmitted primary x <strong>ray</strong>s could be<br />
made, as in Fig. 4.<br />
X-<strong>ray</strong> tube<br />
focal spot<br />
Target object<br />
6.<br />
Concentric<br />
annular detectors<br />
<strong>for</strong> <strong>for</strong>ward scatter<br />
∗<br />
hν o<br />
FIGURE 4. Concept <strong>for</strong> simultaneous<br />
measurement of primary plus<br />
two types of scatter leaving the<br />
patient.<br />
Annular detector<br />
<strong>for</strong> backscatter<br />
Background<br />
object<br />
L<br />
d<br />
Detector <strong>for</strong><br />
transmitted<br />
radiation
P.C. Johns, M.P. Wismayer, R.J Leclair - Poster # 14 at the 5th Annual Canadian Light Source Users’ Meeting, Saskatoon, Canada, 16 November 2002.<br />
7.<br />
2. SCATTERING FORM FACTORS<br />
<strong>The</strong> differential <strong>cross</strong> <strong>section</strong> per unit solid angle <strong>for</strong> Thomson scattering from a free electron at angle θ is<br />
2<br />
d<br />
eσ<br />
Thomson<br />
re<br />
2<br />
= + θ , (1)<br />
dΩ<br />
2 ( 1 cos )<br />
where r e is the classical electron radius. For multielectron systems, the scattered waves interfere. <strong>The</strong> coherent<br />
scattering <strong>cross</strong> <strong>section</strong> per electron per steradian is<br />
d σ<br />
dΩ<br />
e coh e<br />
2<br />
2<br />
r<br />
2<br />
F x Z<br />
= + θ<br />
2 ( 1 cos ) ( , )<br />
Z<br />
, (2)<br />
where Z is the atomic number, and F(x,Z) is the coherent scatter <strong>for</strong>m factor <strong>for</strong> element Z. Note 0 # F(x,Z) # Z.<br />
<strong>The</strong> parameter x arises from considerations similar to Bragg’s law <strong>for</strong> crystalline specimens, and is<br />
x<br />
1 θ E θ<br />
= sin = sin<br />
λ 2 hc 2<br />
Contours of x are shown in Figure 5.<br />
. (3)<br />
For compounds or mixtures, the simplest model is the Independent Atom Model (IAM),<br />
2 2<br />
FIAM<br />
( x) = ∑ niF ( x, Zi<br />
)<br />
i<br />
, (4)<br />
where n i is the number fraction of element i. In fact, the scattered waves from different atoms interfere, and the<br />
IAM is valid only at large x, which corresponds to intra-atomic interference. Except <strong>for</strong> materials with very simple<br />
structure, F(x) is difficult or impossible to calculate and must be measured.
P.C. Johns, M.P. Wismayer, R.J Leclair - Poster # 14 at the 5th Annual Canadian Light Source Users’ Meeting, Saskatoon, Canada, 16 November 2002.<br />
For incoherent scattering,<br />
8.<br />
d<br />
σ<br />
dΩ<br />
e incoh e<br />
2<br />
r<br />
F<br />
SxZ<br />
2<br />
= + θ<br />
KN<br />
2 ( 1 cos ) ( , )<br />
Z<br />
, (5)<br />
where F KN is the Klein-Nishina factor and S(x) is the incoherent scattering function. For this type of scattering it<br />
is legitimate to sum the contributions from each atom independently.<br />
FIGURE 5. Shown are lines of equal x value, as per<br />
Eq.(3), in terms of x-<strong>ray</strong> photon energy E and scattering<br />
angle θ. <strong>The</strong> shaded region is that which is practical to<br />
access in radiology.
P.C. Johns, M.P. Wismayer, R.J Leclair - Poster # 14 at the 5th Annual Canadian Light Source Users’ Meeting, Saskatoon, Canada, 16 November 2002.<br />
9.<br />
3. MODEL OF X-RAY SCATTER IMAGING<br />
To date, it has been difficult to compare quantitatively the per<strong>for</strong>mance of scatter imaging to primary imaging, and<br />
to compare different scatter imaging approaches to each other. For primary imaging the standard analysis tool is<br />
the model of Motz and Danos. 16 We have <strong>for</strong>mulated analogous models <strong>for</strong> scatter imaging 17 and used them to<br />
quantify the ultimate per<strong>for</strong>mance of scatter imaging based on the fundamental input parameters, namely dσ/dΩ,<br />
independent of the engineering of a particular apparatus. <strong>The</strong> models are semi-analytic and intentionally simple.<br />
For a given photon fluence entering the patient, the models calculate C and SNR, where the "signal" in the SNR<br />
calculation is the difference in measurement between two objects that are to be distinguished. We analysed both<br />
<strong>for</strong>ward scatter (2 o -12 o ) and backscatter (158 o -178 o ) imaging. We also calculated C and SNR assuming hypothetical<br />
capture of all scatter over 4π steradians. Our <strong>for</strong>ward-scatter model is illustrated in Figure 6 and was verified<br />
experimentally using polyenergetic beams and plastic targets. 18<br />
Figure 7 shows numerical predictions <strong>for</strong> distinguishing white from g<strong>ray</strong> brain matter in neuroradiology.<br />
Conventional CT scanners can just barely do this, as the primary contrast is only . 0.5 %. Two small targets of<br />
white and g<strong>ray</strong> matter are modelled to be inside a sphere of water, radius R = 7.5 cm. Shown are maximum<br />
achievable values of SNR, where the maximum is obtained by optimizing E. Using <strong>for</strong>ward scatter gives a better<br />
SNR than using primary <strong>for</strong> all target sizes d < 40 mm. Also, using only the <strong>for</strong>ward scatter gives a better SNR than<br />
using all the scatter. Although there are less photons available in the <strong>for</strong>mer case, so that the fractional Poisson<br />
counting noise is greater, the difference in total scatter <strong>cross</strong> <strong>section</strong> is larger, and there<strong>for</strong>e so is the SNR of the<br />
white/g<strong>ray</strong> matter difference. <strong>The</strong>se results are <strong>for</strong> monoenergetic beams. Calculations using typical <strong>medical</strong><br />
polyenergetic spectra show that the SNR reduction due to spectral blurring is modest. 20
P.C. Johns, M.P. Wismayer, R.J Leclair - Poster # 14 at the 5th Annual Canadian Light Source Users’ Meeting, Saskatoon, Canada, 16 November 2002.<br />
10.<br />
SNR max<br />
10 2<br />
10 1<br />
10 0<br />
10 -1<br />
Total Scatter<br />
Forward Scatter<br />
Backscatter<br />
10 -2<br />
10 -3<br />
Primary<br />
White/G<strong>ray</strong> Matter<br />
0.01 0.1 1 10 40<br />
d, Thickness (mm)<br />
FIGURE 6. Geometry <strong>for</strong> modelling <strong>for</strong>ward-scatter<br />
imaging. 17 Two materials of thickness d at the centre<br />
of a spherical water phantom of radius R are to be<br />
distinguished by their scatter signals.<br />
FIGURE 7. <strong>The</strong> maximum SNR over all energies <strong>for</strong><br />
distinguishing white matter from g<strong>ray</strong> matter, of<br />
thickness d, <strong>cross</strong> <strong>section</strong>al area 1.0 mm 2 , inside a 15<br />
cm diameter spherical H 2 O phantom. Incident energy<br />
fluence fixed at 1.88 x 10 11 keV cm -2 . (For details see<br />
Leclair & Johns 19 ).
P.C. Johns, M.P. Wismayer, R.J Leclair - Poster # 14 at the 5th Annual Canadian Light Source Users’ Meeting, Saskatoon, Canada, 16 November 2002.<br />
11.<br />
Figure 8(a) shows SNR as a function of d <strong>for</strong> the optimum x<br />
range of x min = 0.8 nm -1 to x max = 1.28 nm -1 <strong>for</strong> finding breast<br />
tumours in normal fibroglandular tissue. Figure 8(b) shows<br />
values of SNR <strong>for</strong> several polyenergetic beams. <strong>The</strong> angular<br />
ranges were chosen such that the average momentum transfer<br />
argument was from 0.8 to 1.28 nm -1 . Figures 8(a) and (b) both<br />
predict an advantage of using scatter <strong>for</strong> breast cancer<br />
detection.<br />
SNR<br />
Low-angle<br />
scatter model<br />
35 keV<br />
Primary<br />
model<br />
19 keV<br />
(a)<br />
FIGURE 8. Predicted SNR values 21 as a function of d <strong>for</strong><br />
imaging of carcinoma versus fibroglandular structures<br />
each of <strong>cross</strong> <strong>section</strong>al area 0.196 mm 2 using (a)<br />
monoenergetic beams and (b) polyenergetic beams. <strong>The</strong><br />
glandular dose is held constant at 2 mGy and a photon<br />
counting detector is assumed.<br />
SNR<br />
Primary<br />
Top: 30 kV Mo<br />
Bottom: 30 kV W<br />
Scatter<br />
Top: 60 kV W<br />
Middle: 30 kV W<br />
Bottom: 80 kV W<br />
Scatter<br />
(30 kV Mo)<br />
(b)<br />
d, thickness (mm)
P.C. Johns, M.P. Wismayer, R.J Leclair - Poster # 14 at the 5th Annual Canadian Light Source Users’ Meeting, Saskatoon, Canada, 16 November 2002.<br />
Table 1. Summary of selected literature on x-<strong>ray</strong> diffraction signatures of tissues and phantom materials.<br />
Reference Technology Measured† Comments<br />
Narten 3 (1970) diffractometer, Mo anode with H 2 O at 4, 20, 25, 50, 75, 100, 150, 200 o C,<br />
monochromator, 17.4 keV. <strong>The</strong>rmodynamic<br />
plus D 2 O at 4 o C. Other work includes CCl 4 .<br />
estimate <strong>for</strong> x 6<br />
0.<br />
Kosanetzky et al 22<br />
(1987)<br />
Evans et al 23 (1991)<br />
diffractometer, Co anode with<br />
monochromator, 6.935 keV<br />
60 kVp Cu anode spectrum,<br />
heavily filtered, 46 keV average,<br />
with multi-wire prop. counter<br />
70 kVp W spectrum, θ = 6 o ,<br />
HPGe energy dispersion<br />
diffractometer without<br />
Royle & Speller 25 (1995)<br />
[+ Ref.24 (1992)]<br />
Tartari et al 26 (1997)<br />
monochromator, corrected.<br />
Peplow & Verghese 27 synchrotron (NSLS Brookhaven),<br />
(1998)<br />
monoenergetic 8 keV and 20<br />
Kidane, Speller, Royle,<br />
& Hanby 28 (1999)<br />
keV, angular dispersion<br />
80 kVp W spectrum, θ = 6 o ,<br />
HPGe energy dispersion<br />
Lewis et al 29 (2000) synchrotron (Daresbury),<br />
monoenergetic 8.05 keV<br />
Desouky et al 30 (2001) diffractometer, Cu anode with<br />
monochromator, 8.047 keV<br />
Poletti et al 31 (2002) diffractometer, Mo anode with<br />
monochromator, 17.44 keV<br />
H 2 O, C 5 H 8 O 2 , C 16 H 14 O 3 , C 8 H 8 , C 6 H 11 NO,<br />
C 2 H 4 , blood, muscle, fat, liver, tendon, bone,<br />
white matter, g<strong>ray</strong> matter.<br />
H 2 O, C 5 H 8 O 2 , olive oil, blood, breast tissues:<br />
adipose, fibroglandular, benign tumour,<br />
carcinoma, fibrocystic disease, fibroadenoma.<br />
Provides the gold standard <strong>for</strong> H 2 O.<br />
Tabulated F 2 <strong>for</strong> 0 # x # 12.7 nm -1 .<br />
Groundbreaking study <strong>for</strong> biological<br />
materials, plastics. Cross <strong>section</strong>s given<br />
graphically <strong>for</strong> 0.25 # x # 4.3 nm -1 .<br />
Results spectrally blurred. Only<br />
tabulated peak position in θ, peak<br />
FWHM, and peak-to-large-angle ratio.<br />
bone: femoral heads.<br />
Looked at bone-to-marrow peak ratio as<br />
indicator of bone mineral density.<br />
C 5 H 8 O 2 , fat. F tabulated out to x = 6.2 nm -1 .<br />
Minimum x value on graphs . 0.17 nm -1 .<br />
H 2 O, C 5 H 8 O 2 , C 16 H 14 O 3 , kapton, fat, muscle, F obtained out to x = 10 nm -1 .<br />
kidney, liver, pig heart, blood, <strong>for</strong>malin (10% Minimum x value ranged from 0.42 to<br />
<strong>for</strong>maldehyde in H 2 O), breast tissue in <strong>for</strong>malin 1.08 nm -1 , sample dependent.<br />
100 breast tissue samples:<br />
adipose, fibrosis, fibroglandular, benign,<br />
fibrocystic, fibroadenoma, carcinoma.<br />
Peak positions tabulated. Graphs of F<br />
<strong>for</strong> most tissue types shown <strong>for</strong><br />
0.8 # x # 3.25 nm -1 .<br />
breast tissues: core biopsy samples of tumour “small-angle” experiment re collagen<br />
and normal (reduction mammoplasty). structure, very low x. F not obtained.<br />
biological samples freeze-dried to remove H 2 O: Tabulated peak positions in 2, FWHM of<br />
blood constituents, albumin, milk powder, other peaks. Only graphed counts vs. 2.<br />
H 2 O, C 5 H 8 O 2 , C 6 H 11 NO, C 2 H 4 , breast phantom F tabulated out to x = 8.0 nm -1 .<br />
materials (3 from CIRS, 1 from RMI), breast Minimum x value measured not stated.<br />
tissues: adipose, glandular.<br />
Fernández et al 32 (2002) synchrotron (ESRF Grenoble),<br />
monoenergetic 12.5 keV<br />
breast tissues: adipose, connective tissue,<br />
cancer.<br />
"small-angle" experiment re collagen<br />
structure, x - 0.005 nm -1 . F not obtained.<br />
HStoichiometric <strong>for</strong>mulae: C 5 H 8 O 2 = PMMA (poly methyl methacrylate) C 16 H 14 O 3 = polycarbonate ("Lexan") C 8 H 8 = polystyrene<br />
("Lucite", "Perspex") C 6 H 11 NO = nylon C 2 H 4 = polyethylene<br />
12.
P.C. Johns, M.P. Wismayer, R.J Leclair - Poster # 14 at the 5th Annual Canadian Light Source Users’ Meeting, Saskatoon, Canada, 16 November 2002.<br />
13.<br />
4. MEASUREMENT OF CROSS SECTIONS<br />
4.1 MOTIVATION<br />
Optimizing the design of x-<strong>ray</strong> scatter imaging systems requires knowledge of scatter <strong>cross</strong> <strong>section</strong>s. From Figure<br />
5, taking 16 # E # 140 keV and 0.5 o # θ # 179 o as practical limits <strong>for</strong> scatter imaging in diagnostic radiology, there<br />
is a <strong>need</strong> to have a library of F values <strong>for</strong> tissues and phantom materials from x - 0.1 nm -1 through to the IAM<br />
region, x $10 nm -1 .<br />
While a number of groups have measured d e σ/dΩ or F at some values of x <strong>for</strong> H 2 O, plastics and tissues (Table 1),<br />
there is variation in the values reported. Furthermore, the literature is considerably short of spanning the range of<br />
x <strong>need</strong>ed. For example, we used the diffraction <strong>data</strong> measured by Kidane et al 28 <strong>for</strong> the breast imaging simulations<br />
shown above. Due to the limited range of x measured our simulations could not go below 0.8 nm -1 . Based upon<br />
the measurements done by Lewis et al 29 with synchrotron radiation it is anticipated that capturing scattered x <strong>ray</strong>s<br />
in the range of 0.02 nm -1 to 0.1 nm -1 will provide useful diagnostic in<strong>for</strong>mation. Perhaps a signal comprising a large<br />
range of x from 0.02 to 1.28 nm -1 could maximize the amount of diagnostic in<strong>for</strong>mation. But the <strong>cross</strong> <strong>section</strong>s <strong>need</strong><br />
to be measured to know <strong>for</strong> sure. For these reasons we have commenced our own measurements. 33<br />
4.2 ANGLE-DISPERSIVE APPROACH<br />
We have used two diffractometers made available to us by the National Research Council of Canada: Rigaku (Co<br />
radiation, 6.93 keV), and Scintag (Cu, 8.02 keV). Using two machines, at different energies, allows methodology<br />
developed on one to be checked on the other. Results can be applied at all energies via Eq.(3), e.g. 32 o at 8 keV<br />
] 5 o at 50 keV (x = 1.8 nm -1 ).
P.C. Johns, M.P. Wismayer, R.J Leclair - Poster # 14 at the 5th Annual Canadian Light Source Users’ Meeting, Saskatoon, Canada, 16 November 2002.<br />
14.<br />
2.5<br />
Rigaku diffractometer<br />
Scintag diffractometer<br />
Narten<br />
Kosanetzky et al<br />
Peplow & Verghese<br />
IAM<br />
F(x) ( free e − / bound e − ) 0.5<br />
2.0<br />
1.5<br />
1.0<br />
FIGURE 9. Comparison of coherent<br />
scatter <strong>for</strong>m factor <strong>for</strong> H 2 O measured<br />
by us (Rigaku and Scintag<br />
machines), Narten, 3 Kosanetzky et<br />
al, 22 and Peplow & Verghese 27 . <strong>The</strong><br />
IAM curve is theoretical, and<br />
assumes no inter-atomic interference.<br />
0.5<br />
0<br />
0 1 2 3 4 5 6 7<br />
x ( nm −1 )
P.C. Johns, M.P. Wismayer, R.J Leclair - Poster # 14 at the 5th Annual Canadian Light Source Users’ Meeting, Saskatoon, Canada, 16 November 2002.<br />
We have found that accurately measuring diffraction from amorphous materials on such machines is difficult. <strong>The</strong><br />
machines are designed <strong>for</strong> accurate peak location but continuous background and θ-dependent efficiencies interfere<br />
with amorphous sample <strong>data</strong>. For crystalline samples these are of less concern because the local background can<br />
be subtracted from each peak. Figure 9 shows a comparison of our results <strong>for</strong> water 34 with that of others. <strong>The</strong><br />
variation can significantly alter predicted values of C and SNR <strong>for</strong> x-<strong>ray</strong> scatter images, and thus has impact on the<br />
design of scatter imaging systems. This variation must be resolved.<br />
15.<br />
4.3 ENERGY-DISPERSIVE APPROACH<br />
Instead of a pure angle-dispersive reflection measurement one can use a mixture of angle dispersion and energy<br />
dispersion in transmission mode. This is an extension of the method utilized by R. Speller’s lab. 24,25,28 This<br />
approach is demonstrated in Figure 10, which shows our preliminary results <strong>for</strong> κ, the ratio of the fraction of the<br />
incident photons that is scattered towards the detector to that which is transmitted as primary. <strong>The</strong> plots show κ<br />
as a function of energy, obtained at 80 kV <strong>for</strong> PMMA and nylon, at four angles. Energies from 30 to 70 keV were<br />
used in the analysis. Quite reasonable agreement between experiment and prediction (using the <strong>data</strong> of Kosanetzky<br />
et al 22 ) was obtained. Note that no scaling was per<strong>for</strong>med on our experimental <strong>data</strong> be<strong>for</strong>e the comparison.<br />
<strong>The</strong> parameter κ is linearly related to the <strong>cross</strong> <strong>section</strong>s per solid angle through some transmission factors, which<br />
are calculable, and in the limit of small sample thickness approach unity. Once κ is obtained, the coherent <strong>cross</strong><br />
<strong>section</strong> d e σ coh /dΩ can be found by subtracting the calculated incoherent component, and the <strong>for</strong>m factor F(x)<br />
extracted as per Eq.(2).
P.C. Johns, M.P. Wismayer, R.J Leclair - Poster # 14 at the 5th Annual Canadian Light Source Users’ Meeting, Saskatoon, Canada, 16 November 2002.<br />
16.<br />
<br />
=8 o<br />
<br />
=6 o<br />
FIGURE 10. X-<strong>ray</strong> scatter signatures<br />
of PMMA and nylon measured<br />
at four different angles using an 80<br />
kV x-<strong>ray</strong> spectrum. 21 <strong>The</strong> solid and<br />
dashed lines are the predicted results<br />
<strong>for</strong> PMMA and nylon, respectively.<br />
<strong>The</strong> solid and open circles are the<br />
corresponding experimental results.<br />
<br />
=2 o =4 o<br />
-1<br />
x(nm )
P.C. Johns, M.P. Wismayer, R.J Leclair - Poster # 14 at the 5th Annual Canadian Light Source Users’ Meeting, Saskatoon, Canada, 16 November 2002.<br />
17.<br />
5. SYNCHROTRON RADIATION AS MEANS TO MEASURE<br />
CROSS SECTIONS<br />
<strong>The</strong> CLS offers the following potential advantages <strong>for</strong> the measurement of <strong>for</strong>m factors of tissues and phantom<br />
materials:<br />
• high intensity Y faster measurement Y less sample drying during measurement<br />
• a larger range of x can be investigated. Low-angle x-<strong>ray</strong> optics permit measurements at very small θ and hence<br />
small x that are impossible on a diffractometer<br />
• better control of sample background and θ-dependent effects<br />
• immediate proximity of an academic <strong>medical</strong> centre<br />
• furthermore, <strong>for</strong> Canadian researchers, there will be no <strong>need</strong> to take tissue specimens a<strong>cross</strong> a national border<br />
Either the angular-dispersive or energy-dispersive approach can be implemented. Since a range in x of over a factor<br />
of 100 is desired, probably a hybrid approach will be <strong>need</strong>ed. Angle-dispersive measurements could be made at<br />
a small number of specific energies, and the results tiled together versus x.
P.C. Johns, M.P. Wismayer, R.J Leclair - Poster # 14 at the 5th Annual Canadian Light Source Users’ Meeting, Saskatoon, Canada, 16 November 2002.<br />
18.<br />
6. CONCLUSIONS<br />
By treating scattered radiation as an additional in<strong>for</strong>mation source rather than as a nuisance to be suppressed, a new<br />
dimension is added to x-<strong>ray</strong> imaging. Our calculations predict that in some cases, such as neuroradiology and<br />
mammography, scatter images will have better C and SNR than projection images, <strong>for</strong> the same radiation dose.<br />
Alternatively, the SNR of conventional imaging could be matched by scatter imaging at lower dose. Better <strong>data</strong><br />
<strong>for</strong> tissue scattering <strong>cross</strong> <strong>section</strong>s are <strong>need</strong>ed. Synchrotron radiation appears to offer advantages <strong>for</strong> making these<br />
measurements.<br />
ACKNOWLEDGEMENTS<br />
This work was funded by the Natural Sciences and Engineering Research Council of Canada. <strong>The</strong> third author<br />
acknowledges the support of the Laurentian <strong>University</strong> Research Fund. We thank Jim Sliwka <strong>for</strong> technical support.<br />
We are grateful to Dr. Gary Enright and his staff at the Steacie Institute of Molecular Science, National Research<br />
Council of Canada, Ottawa, <strong>for</strong> making x-<strong>ray</strong> diffractometers available to us and <strong>for</strong> assistance in their use.
P.C. Johns, M.P. Wismayer, R.J Leclair - Poster # 14 at the 5th Annual Canadian Light Source Users’ Meeting, Saskatoon, Canada, 16 November 2002.<br />
19.<br />
REFERENCES<br />
1. M.J. Yaffe and P.C. Johns, “Scattered radiation in diagnostic radiology: Magnitudes, effects, and methods of reduction”, J. Applied<br />
Photographic Engineering 9, 184-195, 1983.<br />
2. E.F. Plechaty, D.E. Cullen, and R.J. Howerton, Tables and graphs of photon interaction <strong>cross</strong> <strong>section</strong>s from 1.0 keV to 100 MeV derived<br />
from the LLL Evaluated Nuclear Data Library, Lawrence Livermore Laboratory Report No. UCRL-50400, Vol. 6, Rev. 1 (1975).<br />
3. A.H. Narten,“X-<strong>ray</strong> diffraction <strong>data</strong> on liquid water in the temperature range 4 o C-200 o C”, Oak Ridge National Laboratory Report<br />
ORNL-4578 (1970).<br />
4. J.H. Hubbell, W.J. Veigele, E.A. Briggs, R.T. Brown, D.T. Cromer. amd R.J. Howerton, “Atomic <strong>for</strong>m factors, incoherent scattering<br />
functions, and photon scattering <strong>cross</strong> <strong>section</strong>s”, J. Phys. Chem. Ref. Data 4, 471-538, 1975 (Erratum: 6, 615-616,1977).<br />
5. P.C. Johns and M.J. Yaffe, “Coherent scatter in diagnostic radiology”, Medical Physics 10, 40-50, 1983.<br />
6. L.R.M. Morin and A. Berroir, “Calculation of x-<strong>ray</strong> single scattering in diagnostic radiology”, Phys. Med. Biol. 28, 789-797, 1983.<br />
7. E.P. Muntz, T. Fewell, R. Jennings, and H. Bernstein, “On the significance of very small angle scattered radiation to radiographic<br />
imaging at low energies”, Medical Physics 10, 819-823, 1983.<br />
8. R.H. Morgan, “An analysis of the physical factors controlling the diagnostic quality of roentgen images. Part III. Contrast and the<br />
intensity distribution function of a roentgen image”, American Journal of Roentgenology 55, 67-89, 1946.<br />
9. G. Harding and J. Kosanetzky, “Status and outlook of coherent-x-<strong>ray</strong> scatter imaging”, J. Optical Soc. of America A 4, 933-944, 1987.<br />
10. M.S. Westmore, A. Fenster, and I.A. Cunningham,“Angular-dependent coherent scatter measured with a diagnostic x-<strong>ray</strong> image<br />
intensifier-based imaging system”, Medical Physics 23,723-733, 1996.<br />
11. U. Kleuker, P. Suortti, W. Weyrich, and P. Spanne, “Feasibility study of x-<strong>ray</strong> diffraction computed tomography <strong>for</strong> <strong>medical</strong> imaging”,<br />
Physics in Medicine and Biology 43, 2911-2923, 1998.<br />
12. B.C. Towe and A.M. Jacobs, “X-<strong>ray</strong> backscatter imaging”, IEEE Trans. Bio<strong>medical</strong> Engineering BME-28, 646-654, 1981.<br />
13. M.D. Herr, J.J. McInerney, D.G. Lamser, and G.L. Copenhaver, “A flying spot x-<strong>ray</strong> system <strong>for</strong> Compton backscatter imaging”, IEEE<br />
Trans. Medical Imaging 13, 461-469, 1994.<br />
14. R.D. Luggar and W.B. Gilboy, “Applications of Rayleigh scattered photons to substance identification”, Nuclear Instruments and<br />
Methods in Physics Research A 353, 650-653, 1994.<br />
15. I.D. Jupp, P.T. Durrant, D. Ramsden, T. Carter, G. Dermody, I.B. Pleasants, and D. Burrows, “<strong>The</strong> non-invasive inspection of baggage<br />
using coherent x-<strong>ray</strong> scattering”, IEEE Trans. Nuclear Science 47, 1987-1994, 2000.<br />
16. J.W. Motz and M. Danos, “Image in<strong>for</strong>mation content and patient exposure”, Medical Physics 5, 8-22, 1978.<br />
17. R.J. Leclair and P.C. Johns, “A semi-analytic model to investigate the potential applications of x-<strong>ray</strong> scatter imaging”, Medical Physics<br />
25, 1008-1020, 1998.
P.C. Johns, M.P. Wismayer, R.J Leclair - Poster # 14 at the 5th Annual Canadian Light Source Users’ Meeting, Saskatoon, Canada, 16 November 2002.<br />
18. R.J. Leclair and P.C. Johns, “X-<strong>ray</strong> <strong>for</strong>ward-scatter imaging: Experimental validation of model”, Medical Physics 28, 210-219, 2001.<br />
19. R.J. Leclair and P.C. Johns, “Fundamental in<strong>for</strong>mation content accessible with <strong>medical</strong> x-<strong>ray</strong> scatter imaging”, Proc. SPIE 3659,<br />
672-681, 1999.<br />
20. R.J. Leclair and P.C. Johns, “Analysis of spectral blur effects in x-<strong>ray</strong> scatter imaging”, Medical Physics 26, 1811-1816, 1999.<br />
21. R.J. Leclair and P.C. Johns, “Optimum momentum transfer arguments <strong>for</strong> x-<strong>ray</strong> <strong>for</strong>ward scatter imaging”, Medical Physics 29,<br />
(December 2002)(in press).<br />
22. J. Kosanetzky, B. Knoerr, G. Harding and U. Neitzel, “X-<strong>ray</strong> diffraction measurements of some plastic materials and body tissues”,<br />
Medical Physics 14, 526-532, 1987.<br />
23. S.H. Evans, D.A. Bradley, D.R. Dance, J.E. Bateman, and C.H. Jones, “Measurement of small-angle photon scattering <strong>for</strong> some breast<br />
tissues and tissue substitute materials”, Physics in Medicine and Biology 36, 7-18, 1991.<br />
24. R.D.Speller and G.J. Royle, "Tissue characterization using low angle x-<strong>ray</strong> scattering", J. X-Ray Science and Technology 3, 77-84, 1992.<br />
25. J. Royle and R.D. Speller, “Quantitative x-<strong>ray</strong> diffraction analysis of bone and marrow volumes in excised femoral head samples”,<br />
Physics in Medicine and Biology 40, 1487-1498, 1995.<br />
26. A. Tartari, E. Casnati, C. Bonifazzi, and C.Baraldi, “Molecular differential <strong>cross</strong> <strong>section</strong>s <strong>for</strong> x-<strong>ray</strong> coherent scattering in fat and<br />
polymethyl methacrylate”, Physics in Medicine and Biology 42, 2551-2560, 1997.<br />
27. D.E. Peplow and K. Verghese, “Measured molecular coherent scattering <strong>for</strong>m factors of animal tissues, plastics and human breast<br />
tissue”, Physics in Medicine and Biology 43, 2431-2452, 1998.<br />
28. G. Kidane, R.D. Speller, G.J. Royle, and A.M. Hanby, “X-<strong>ray</strong> scatter signatures <strong>for</strong> normal and neoplastic breas tissues”, Physics in<br />
Medicine and Biology 44, 1791-1802, 1999.<br />
29. R.A. Lewis, K.D. Rogers, C.J. Hall, E. Towns-Andrews, S. Slawson, A. Evans, S.E. Pinder, I.O. Ellis, C.R.M.Boggis, A.P. Hufton and<br />
D.R. Dance, "Breast cancer diagnosis using scattered X-<strong>ray</strong>s,'' J. Synchrotron Rad. 7, 348-352, 2000.<br />
30. O.S. Desouky, W.M. Elshemey, N.S. Selim, and A.H. Ashour, "Analysis of low-angle x-<strong>ray</strong> scattering peaks from lyophilized biological<br />
samples", Physics in Medicine and Biology 46, 2099-2106, 2001.<br />
31. M.E. Poletti, O.D. Gonçalves, and I. Mazzaro, "X-<strong>ray</strong> scattering from human breast tissues and breast-equivalent materials", Physics in<br />
Medicine and Biology 47, 47-63, 2002.<br />
32. M. Fernández, J. Keyriläinen, R. Serimaa, M. Torkkeli, M.-L. Karjalainen-Lindsberg, M. Tenhunen, W. Thomlinson, V. Urban, and<br />
P. Suortti, "Small-angle x-<strong>ray</strong> scattering studies of human breast tissue samples", Physics in Medicine and Biology 47, 577-592, 2002.<br />
33. P.C. Johns, C. Buffet, S. Decossas, R.R. Scharf, and R.J. Leclair, “Measurement of x-<strong>ray</strong> scattering properties of biological materials”,<br />
Proc. Can. Org. of Medical Physicists Conf., 235-237 (1999)[Abstract: Medical Physics 26, 1435, 1999].<br />
34. P.C. Johns and M.P. Wismayer, “Measurement of coherent scattering <strong>for</strong>m factors <strong>for</strong> radiology”, 2001 RSNA Conference,<br />
Paper # 462 [Abstract: Radiology 221(P), 336, 2001].<br />
20.