Source of the Rare-Earth Element Peak in r-Process Nucleosynthesis
Source of the Rare-Earth Element Peak in r-Process Nucleosynthesis
Source of the Rare-Earth Element Peak in r-Process Nucleosynthesis

You also want an ePaper? Increase the reach of your titles
YUMPU automatically turns print PDFs into web optimized ePapers that Google loves.
VOLUME 79, NUMBER 10 PHYSICAL REVIEW LETTERS 8SEPTEMBER 1997<br />
number Z, <strong>the</strong>re is an isotope with maximum abundance;<br />
<strong>the</strong> collection <strong>of</strong> all such isotopes def<strong>in</strong>es <strong>the</strong> path at<br />
that time. As long as b-decay rates are much less than<br />
neutron-capture or dis<strong>in</strong>tegration rates and <strong>the</strong> system is <strong>in</strong><br />
n, g-g, n equilibrium, <strong>the</strong> path’s location follows from<br />
<strong>the</strong> requirement that <strong>the</strong> average free energy be stationary<br />
under <strong>the</strong> transfer <strong>of</strong> a neutron from a nucleus to <strong>the</strong> freeneutron<br />
bath. This <strong>in</strong> turn means roughly that for every<br />
Z <strong>the</strong> isotope with maximum abundance has a neutron<br />
separation <strong>of</strong><br />
( √ !<br />
rN A Y n 2p ¯h 2 32<br />
)<br />
S n Z, N max 2kT ln<br />
, (1)<br />
2 m n kT<br />
where N max is <strong>the</strong> neutron number <strong>of</strong> <strong>the</strong> isotope, T is<br />
<strong>the</strong> temperature, r is <strong>the</strong> mass density, N A is Avagadro’s<br />
number, Y n is <strong>the</strong> abundance <strong>of</strong> free neutrons per nucleon,<br />
and m n is <strong>the</strong> neutron’s mass. Equation (1) shows that<br />
for given T, r, and Y n , <strong>the</strong> equilibrium path always lies<br />
along a contour <strong>of</strong> constant separation energy.<br />
The high-entropy r-process calculations <strong>of</strong> Refs. [9,10]<br />
alluded to above were performed with<strong>in</strong> <strong>the</strong> context <strong>of</strong> detailed<br />
supernova simulations. To get a clear picture <strong>of</strong><br />
<strong>the</strong> dynamics <strong>of</strong> <strong>the</strong> r-process path, here we simply parametrize<br />
<strong>the</strong> dependence <strong>of</strong> temperature on time (with<br />
r~T 3 and assum<strong>in</strong>g a simple constant outflow velocity<br />
[11]) to roughly match <strong>the</strong> results <strong>of</strong> <strong>the</strong> more complicated<br />
calculations. We <strong>the</strong>n solve <strong>the</strong> network differential<br />
equations (described <strong>in</strong> Ref. [1]) that determ<strong>in</strong>e <strong>the</strong> time<br />
development <strong>of</strong> nucleosyn<strong>the</strong>sis. The <strong>in</strong>puts, besides <strong>the</strong><br />
temperature and density, are <strong>the</strong> <strong>in</strong>itial mass fractions <strong>of</strong><br />
neutrons and preexist<strong>in</strong>g “seed” nuclei, and calculated neutron<br />
capture rates [1], neutron separation energies [12], and<br />
b-decay rates [12]. The seed nuclei quickly come <strong>in</strong>to<br />
n, g-g, n equilibrium and <strong>the</strong>n undergo <strong>the</strong> usual b-<br />
decay and neutron-capture sequence. We run <strong>the</strong> simulations<br />
through freeze-out until only stable nuclei rema<strong>in</strong>.<br />
The treatment is fully dynamical <strong>in</strong> that neutron capture<br />
and photodis<strong>in</strong>tegration cont<strong>in</strong>ue to compete with b decay<br />
throughout <strong>the</strong> entire process, even when equilibrium<br />
no longer obta<strong>in</strong>s. In <strong>the</strong> more detailed supernova<br />
simulations, <strong>the</strong> high-entropy r process occurs over several<br />
seconds, and many r-process components comb<strong>in</strong>e<br />
to give <strong>the</strong> f<strong>in</strong>al abundance distribution (see, e.g., Fig. 15<br />
<strong>of</strong> Ref. [10]). The calculations presented here treat just<br />
<strong>the</strong> components with <strong>the</strong> highest <strong>in</strong>itial neutronseed nucleus<br />
ratios, because <strong>the</strong>y are responsible for <strong>the</strong> REE peak.<br />
These components are also responsible for <strong>the</strong> large peak<br />
at A 195 <strong>in</strong> <strong>the</strong> more detailed simulations. In fact, no<br />
matter what <strong>the</strong> precise conditions <strong>in</strong> <strong>the</strong> supernova, virtually<br />
any high-entropy r-process component that produces<br />
<strong>the</strong> A 195 peak with sufficient abundance and <strong>in</strong> <strong>the</strong> correct<br />
location also makes a REE peak [11] if freeze-out is<br />
treated dynamically.<br />
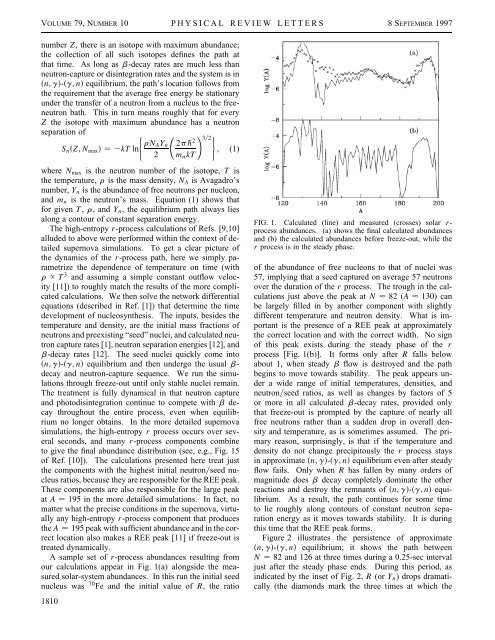
A sample set <strong>of</strong> r-process abundances result<strong>in</strong>g from<br />
our calculations appear <strong>in</strong> Fig. 1(a) alongside <strong>the</strong> measured<br />
solar-system abundances. In this run <strong>the</strong> <strong>in</strong>itial seed<br />
nucleus was 70 Fe and <strong>the</strong> <strong>in</strong>itial value <strong>of</strong> R, <strong>the</strong> ratio<br />
1810<br />
FIG. 1. Calculated (l<strong>in</strong>e) and measured (crosses) solar r-<br />
process abundances. (a) shows <strong>the</strong> f<strong>in</strong>al calculated abundances<br />
and (b) <strong>the</strong> calculated abundances before freeze-out, while <strong>the</strong><br />
r process is <strong>in</strong> <strong>the</strong> steady phase.<br />
<strong>of</strong> <strong>the</strong> abundance <strong>of</strong> free nucleons to that <strong>of</strong> nuclei was<br />
57, imply<strong>in</strong>g that a seed captured on average 57 neutrons<br />
over <strong>the</strong> duration <strong>of</strong> <strong>the</strong> r process. The trough <strong>in</strong> <strong>the</strong> calculations<br />
just above <strong>the</strong> peak at N 82 (A 130) can<br />
be largely filled <strong>in</strong> by ano<strong>the</strong>r component with slightly<br />
different temperature and neutron density. What is important<br />
is <strong>the</strong> presence <strong>of</strong> a REE peak at approximately<br />
<strong>the</strong> correct location and with <strong>the</strong> correct width. No sign<br />
<strong>of</strong> this peak exists dur<strong>in</strong>g <strong>the</strong> steady phase <strong>of</strong> <strong>the</strong> r<br />
process [Fig. 1(b)]. It forms only after R falls below<br />
about 1, when steady b flow is destroyed and <strong>the</strong> path<br />
beg<strong>in</strong>s to move towards stability. The peak appears under<br />
a wide range <strong>of</strong> <strong>in</strong>itial temperatures, densities, and<br />
neutronseed ratios, as well as changes by factors <strong>of</strong> 5<br />
or more <strong>in</strong> all calculated b-decay rates, provided only<br />
that freeze-out is prompted by <strong>the</strong> capture <strong>of</strong> nearly all<br />
free neutrons ra<strong>the</strong>r than a sudden drop <strong>in</strong> overall density<br />
and temperature, as is sometimes assumed. The primary<br />
reason, surpris<strong>in</strong>gly, is that if <strong>the</strong> temperature and<br />
density do not change precipitously <strong>the</strong> r process stays<br />
<strong>in</strong> approximate n, g-g, n equilibrium even after steady<br />
flow fails. Only when R has fallen by many orders <strong>of</strong><br />
magnitude does b decay completely dom<strong>in</strong>ate <strong>the</strong> o<strong>the</strong>r<br />
reactions and destroy <strong>the</strong> remnants <strong>of</strong> n, g-g, n equilibrium.<br />
As a result, <strong>the</strong> path cont<strong>in</strong>ues for some time<br />
to lie roughly along contours <strong>of</strong> constant neutron separation<br />
energy as it moves towards stability. It is dur<strong>in</strong>g<br />
this time that <strong>the</strong> REE peak forms.<br />
Figure 2 illustrates <strong>the</strong> persistence <strong>of</strong> approximate<br />
n, g-g, n equilibrium; it shows <strong>the</strong> path between<br />
N 82 and 126 at three times dur<strong>in</strong>g a 0.25-sec <strong>in</strong>terval<br />
just after <strong>the</strong> steady phase ends. Dur<strong>in</strong>g this period, as<br />
<strong>in</strong>dicated by <strong>the</strong> <strong>in</strong>set <strong>of</strong> Fig. 2, R (or Y n ) drops dramatically<br />
(<strong>the</strong> diamonds mark <strong>the</strong> three times at which <strong>the</strong>