Inhibition of Bacterial Growth In Vitro Following ... - Physical Therapy
Inhibition of Bacterial Growth In Vitro Following ... - Physical Therapy
Inhibition of Bacterial Growth In Vitro Following ... - Physical Therapy

Create successful ePaper yourself
Turn your PDF publications into a flip-book with our unique Google optimized e-Paper software.
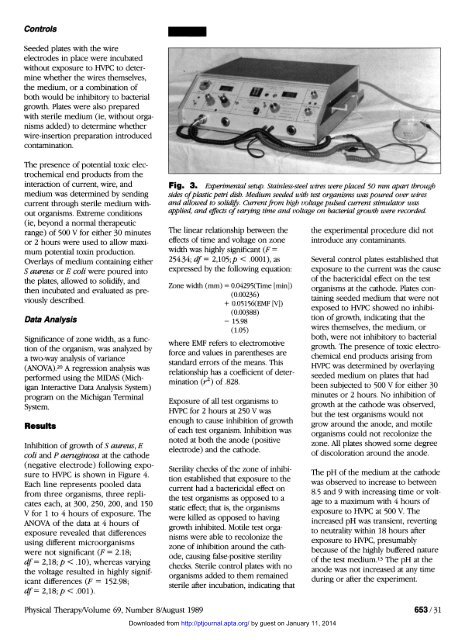
Controls<br />
Seeded plates with the wire<br />
electrodes in place were incubated<br />
without exposure to HVPC to determine<br />
whether the wires themselves,<br />
the medium, or a combination <strong>of</strong><br />
both would be inhibitory to bacterial<br />
growth. Plates were also prepared<br />
with sterile medium (ie, without organisms<br />
added) to determine whether<br />
wire-insertion preparation introduced<br />
contamination.<br />
The presence <strong>of</strong> potential toxic electrochemical<br />
end products from the<br />
interaction <strong>of</strong> current, wire, and<br />
medium was determined by sending<br />
current through sterile medium without<br />
organisms. Extreme conditions<br />
(ie, beyond a normal therapeutic<br />
range) <strong>of</strong> 500 V for either 30 minutes<br />
or 2 hours were used to allow maximum<br />
potential toxin production.<br />
Overlays <strong>of</strong> medium containing either<br />
S aureus or E coli were poured into<br />
the plates, allowed to solidify, and<br />
then incubated and evaluated as previously<br />
described.<br />
Data Analysis<br />
Significance <strong>of</strong> zone width, as a function<br />
<strong>of</strong> the organism, was analyzed by<br />
a two-way analysis <strong>of</strong> variance<br />
(ANOVA). 20 A regression analysis was<br />
performed using the MIDAS (Michigan<br />
<strong>In</strong>teractive Data Analysis System)<br />
program on the Michigan Terminal<br />
System.<br />
Results<br />
<strong><strong>In</strong>hibition</strong> <strong>of</strong> growth <strong>of</strong> S aureus, E<br />
coli and P aeruginosa at the cathode<br />
(negative electrode) following exposure<br />
to HVPC is shown in Figure 4.<br />
Each line represents pooled data<br />
from three organisms, three replicates<br />
each, at 300, 250, 200, and 150<br />
V for 1 to 4 hours <strong>of</strong> exposure. The<br />
ANOVA <strong>of</strong> the data at 4 hours <strong>of</strong><br />
exposure revealed that differences<br />
using different microorganisms<br />
were not significant (F = 2.18;<br />
df = 2,18; p < .10), whereas varying<br />
the voltage resulted in highly significant<br />
differences (F = 152.98;<br />
df= 2,18; p