Agenda and supporting papers - Plymouth Hospitals NHS Trust
Agenda and supporting papers - Plymouth Hospitals NHS Trust
Agenda and supporting papers - Plymouth Hospitals NHS Trust

You also want an ePaper? Increase the reach of your titles
YUMPU automatically turns print PDFs into web optimized ePapers that Google loves.
Item 8<br />
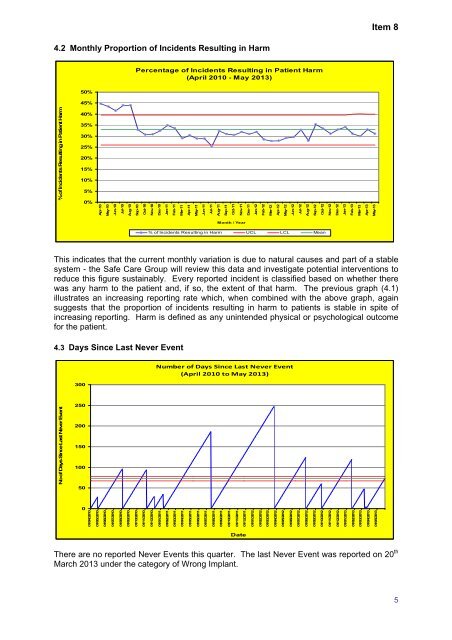
4.2 Monthly Proportion of Incidents Resulting in Harm<br />
Percentage of Incidents Resulting in Patient Harm<br />
(April 2010 - May 2013)<br />
50%<br />
45%<br />
% of Incidents Resulting in Patient Harm<br />
40%<br />
35%<br />
30%<br />
25%<br />
20%<br />
15%<br />
10%<br />
5%<br />
0%<br />
Apr-10<br />
May-10<br />
Jun-10<br />
Jul-10<br />
Aug-10<br />
Sep-10<br />
Oct-10<br />
Nov-10<br />
Dec-10<br />
Jan-11<br />
Feb-11<br />
Mar-11<br />
Apr-11<br />
May-11<br />
Jun-11<br />
Jul-11<br />
Aug-11<br />
Sep-11<br />
Oct-11<br />
Nov-11<br />
Dec-11<br />
Jan-12<br />
Feb-12<br />
Mar-12<br />
Apr-12<br />
May-12<br />
Jun-12<br />
Jul-12<br />
Aug-12<br />
Sep-12<br />
Oct-12<br />
Nov-12<br />
Dec-12<br />
Jan-13<br />
Feb-13<br />
Mar-13<br />
Apr-13<br />
May-13<br />
Month / Year<br />
% of Incidents Resulting in Harm UCL LCL Mean<br />
This indicates that the current monthly variation is due to natural causes <strong>and</strong> part of a stable<br />
system - the Safe Care Group will review this data <strong>and</strong> investigate potential interventions to<br />
reduce this figure sustainably. Every reported incident is classified based on whether there<br />
was any harm to the patient <strong>and</strong>, if so, the extent of that harm. The previous graph (4.1)<br />
illustrates an increasing reporting rate which, when combined with the above graph, again<br />
suggests that the proportion of incidents resulting in harm to patients is stable in spite of<br />
increasing reporting. Harm is defined as any unintended physical or psychological outcome<br />
for the patient.<br />
4.3 Days Since Last Never Event<br />
300<br />
Number of Days Since Last Never Event<br />
(April 2010 to May 2013)<br />
No of Days Since Last Never Event<br />
250<br />
200<br />
150<br />
100<br />
50<br />
0<br />
01/04/2010<br />
01/05/2010<br />
01/06/2010<br />
01/07/2010<br />
01/08/2010<br />
01/09/2010<br />
01/10/2010<br />
01/11/2010<br />
01/12/2010<br />
01/01/2011<br />
01/02/2011<br />
01/03/2011<br />
01/04/2011<br />
01/05/2011<br />
01/06/2011<br />
01/07/2011<br />
01/08/2011<br />
01/09/2011<br />
01/10/2011<br />
01/11/2011<br />
01/12/2011<br />
01/01/2012<br />
01/02/2012<br />
01/03/2012<br />
01/04/2012<br />
01/05/2012<br />
01/06/2012<br />
01/07/2012<br />
01/08/2012<br />
01/09/2012<br />
01/10/2012<br />
01/11/2012<br />
01/12/2012<br />
01/01/2013<br />
01/02/2013<br />
01/03/2013<br />
01/04/2013<br />
01/05/2013<br />
Date<br />
There are no reported Never Events this quarter. The last Never Event was reported on 20 th<br />
March 2013 under the category of Wrong Implant.<br />
5