Oceanographic conditions on the northern Bering Sea shelf: 1984 ...
Oceanographic conditions on the northern Bering Sea shelf: 1984 ...
Oceanographic conditions on the northern Bering Sea shelf: 1984 ...

Create successful ePaper yourself
Turn your PDF publications into a flip-book with our unique Google optimized e-Paper software.
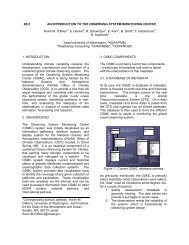
2. METHODS<br />
Nine APEX moorings were deployed near St. Lawrence Island inOctober <strong>1984</strong> from <strong>the</strong><br />
RN Alpha Helix. The <strong>Bering</strong> Strait mooring was deployed by helicopter in November <strong>1984</strong><br />
(Fig. I, Table 1). All moorings were taut-wire moorings and c<strong>on</strong>tained from <strong>on</strong>e to three current<br />
meters.<br />
Statistical parameters, correlati<strong>on</strong> coefficients, spectra, and coherences were calculated<br />
using a program package called R2D2 (Pears<strong>on</strong>, 1981). This package was also used to display<br />
current roses and summary vectors. Eight bins, each 45° wide, were used in <strong>the</strong> current roses.<br />
Two different Lanczos cosine-squared tapered filters with half-power points of 2.86 hours and 35<br />
hours were used <strong>on</strong> <strong>the</strong> records. The 2.86 hr filter was used when spectral bands were examined;<br />
<strong>the</strong> low pass filter was used in describing statistical characteristics of <strong>the</strong> currents.<br />
The percent variance of <strong>on</strong>e record coherent with ano<strong>the</strong>r record was calculated from<br />
output from <strong>the</strong> R2D2 coherence output. Output from <strong>the</strong> R2D2 spectra routines was used to<br />
calculate <strong>the</strong> spectral variance in <strong>the</strong> following bands: periods greater than 10 days, periods from<br />
2-5 days, periods from 2-10 days, and diurnal and semidiurnal tidal periods. Although <strong>the</strong> effects<br />
of low latitude storms are generally felt in <strong>the</strong> 2-5 day period, <strong>the</strong> 2-10 day band has often been<br />
c<strong>on</strong>sidered in previous <strong>Bering</strong> <strong>Sea</strong> studies to examine meteorological forcing. Therefore,<br />
variance was calculated for both <strong>the</strong> 2-5 day and 2-10 day bands.<br />
To examine seas<strong>on</strong>al variability of <strong>the</strong> currents, we split <strong>the</strong> records into three ninety-day<br />
periods. One lasted from mid-October to early January, <strong>on</strong>e from early January to early April,<br />
and <strong>the</strong> third from early April to early July. We will refer to <strong>the</strong>se periods as fall, winter and<br />
spring. Most stati<strong>on</strong>s were ice-free during much of <strong>the</strong> first period, ice-covered throughout <strong>the</strong><br />
sec<strong>on</strong>d period, and covered by melting ice during <strong>the</strong> latter part of <strong>the</strong> third period. It was<br />
impossible to compare equal-length ice-free and ice-covered records. Ice was already present at<br />
<strong>the</strong> site when <strong>the</strong> <strong>Bering</strong> Strait mooring was deployed (Table 1). Most of <strong>the</strong> o<strong>the</strong>r sites were<br />
ice-covered by 11 December, though 8402 and 8401 were ice ice-free until 1 and 15 January,<br />
respectively. Ice remained over <strong>the</strong> regi<strong>on</strong> until mid-June.<br />
A program package called METLm (Overland et al., 1980; Macklin et al., <strong>1984</strong>) was used<br />
to generate surface winds from surface pressure fields obtained from <strong>the</strong> Fleet Numerical<br />
<str<strong>on</strong>g>Oceanographic</str<strong>on</strong>g> Center (FNOC). The gradient wind was calculated from <strong>the</strong> pressure fields; it<br />
was <strong>the</strong>n rotated 30° toward lower pressure, and its magnitude was multiplied by 0.8.<br />
3. RESULTS<br />
3.1 Low-Frequency Currents<br />
At <strong>Bering</strong> Strait, <strong>the</strong> current flowed str<strong>on</strong>gly and c<strong>on</strong>sistently toward <strong>the</strong> north. Almost<br />
98% of <strong>the</strong> variance occurred <strong>on</strong> <strong>the</strong> principal variance axis (Table 2; Figs. 2a,b). This axis<br />
coincided with <strong>the</strong> bathymetric axis, and was within 15° of <strong>the</strong> directi<strong>on</strong> of <strong>the</strong> net current. The<br />
vector mean speed, 26.8 cm/s, was 78% of <strong>the</strong> scalar mean speed, fur<strong>the</strong>r attesting to <strong>the</strong> steady<br />
northward flow. The current roses of Fig. 3 show that 74% of <strong>the</strong> flow was within 22.5° of due<br />
north with an average speed of about 40 cm/s. Sixpercent of <strong>the</strong> flow was toward <strong>the</strong> south at<br />
3