Oceanographic conditions on the northern Bering Sea shelf: 1984 ...
Oceanographic conditions on the northern Bering Sea shelf: 1984 ...
Oceanographic conditions on the northern Bering Sea shelf: 1984 ...

You also want an ePaper? Increase the reach of your titles
YUMPU automatically turns print PDFs into web optimized ePapers that Google loves.
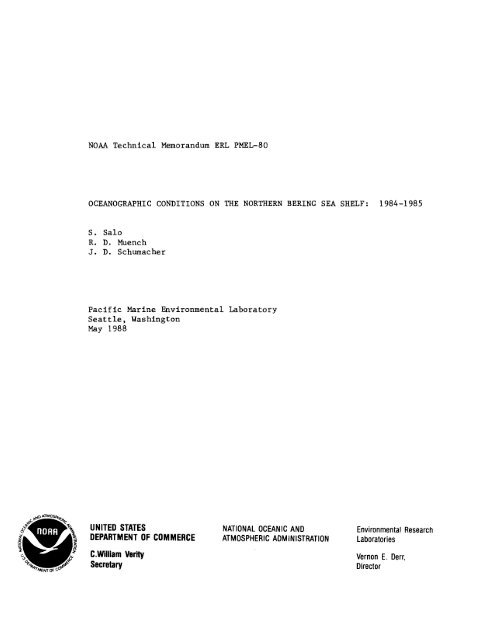
NOAA<br />
Technical Memorandum ERL PMEL-80<br />
OCEANOGRAPHIC CONDITIONS ON THE NORTHERN BERING SEA SHELF: <strong>1984</strong>-1985<br />
S. Salo<br />
R. D. Muench<br />
J. D. Schumacher<br />
Pacific Marine Envir<strong>on</strong>mental Laboratory<br />
<strong>Sea</strong>ttle, Washingt<strong>on</strong><br />
May 1988<br />
UNITED STATES<br />
DEPARTMENT OF COMMERCE<br />
C.William Verity<br />
Secretary<br />
NATIONAL OCEANIC AND<br />
ATMOSPHERIC ADMINISTRATION<br />
Envir<strong>on</strong>mental Research<br />
Laboratories<br />
Vern<strong>on</strong> E. Derr,<br />
Director
NOTICE<br />
Menti<strong>on</strong> of a commercial company or product does not c<strong>on</strong>stitute an endorsement by<br />
NOAAlERL. Use of informati<strong>on</strong> from this publicati<strong>on</strong> c<strong>on</strong>cerning proprietary<br />
products or <strong>the</strong> tests of such products for publicity or advenising purposes is not<br />
authorized.<br />
C<strong>on</strong>tributi<strong>on</strong> No. 1004 from NOAAJPacific Marine Envir<strong>on</strong>mental Laboratory<br />
For sale by <strong>the</strong> Nati<strong>on</strong>al Technicallnf<strong>on</strong>nati<strong>on</strong> Service, 5285 Port Royal Road<br />
Springfield, VA 22161<br />
11
CONTENTS<br />
1. INTRODUCTION . . . . . . . . . . . . . . . . . . . . . .<br />
1.1 Regi<strong>on</strong>al Geographical and <str<strong>on</strong>g>Oceanographic</str<strong>on</strong>g> Setting ..<br />
2. METHODS .<br />
3. RESULTS .<br />
4.<br />
5.<br />
6.<br />
7.<br />
8.<br />
FIGURES<br />
TABLES.<br />
3.1 Low-Frequency Currents.<br />
3.2 Mean and Net Wind . . . .<br />
3.3 Current Spectra. . . . . . .<br />
3.4 Wind Spectra. . . . . . . .<br />
3.5 Correlati<strong>on</strong> and Coherence.<br />
SEASONAL VARIABILITY. . . . . . . . . . . . .<br />
4.1<br />
4.2<br />
4.3<br />
4.4<br />
4.5<br />
4.6<br />
Total Current Variance and Partiti<strong>on</strong>ing ofVariance ...<br />
Wind Variance . . . . . . . . . . . . . . . . . . .<br />
Scalar and Vector Mean Currents . . . . . . . . .<br />
Scalar and Net Mean Winds . . . . . . . . . . . .<br />
Correlati<strong>on</strong>s. . . . . . . . . .. . . . .<br />
<strong>Sea</strong>s<strong>on</strong>al Wind Correlati<strong>on</strong>. . . . . . .<br />
DISCUSSION. . . . . . . . . . . . .<br />
SUMMARY .<br />
ACKNOWLEDGMENTS<br />
REFERENCES ....<br />
PAGE<br />
1<br />
1<br />
· 3<br />
· 3<br />
· 3<br />
.4<br />
· 5<br />
· 5<br />
· 5<br />
· 8<br />
· 8<br />
· 8<br />
· 8<br />
.9<br />
.9<br />
.10<br />
.10<br />
.11<br />
...12<br />
.13<br />
.15<br />
. ... .41<br />
iii
OCEANOGRAPHIC CONDITIONS ON THE NORTHERN BERING SEA SHELF:<br />
<strong>1984</strong>-1985<br />
S. Salol, R.D. Muench 2 , and J.D. Schumacher l<br />
1. INTRODUCTION<br />
Data presented in this Technical Memorandum were amassed as part of an experiment<br />
entitled <strong>the</strong> Arctic Polynya Experiment (APEX 85). The purpose of <strong>the</strong> experiment was to study<br />
mesoscale processes associated with ice formati<strong>on</strong> in <strong>the</strong> polynya south of St. Lawrence Island,<br />
in <strong>the</strong> nor<strong>the</strong>rn <strong>Bering</strong> <strong>Sea</strong>. Data were obtained from nine moorings c<strong>on</strong>taining seventeen current<br />
meters which were deployed near <strong>the</strong> island and in <strong>Bering</strong> Strait during October and November,<br />
<strong>1984</strong> (Table 1). The records from <strong>the</strong>se instruments were analyzed, and <strong>the</strong>ir statistical<br />
properties, spectra. and time series comparis<strong>on</strong>s am<strong>on</strong>g <strong>the</strong> records are presented in this memo.<br />
In additi<strong>on</strong>, data are compared to time-series of local winds derived from surface level pressure<br />
fields.<br />
1.1 Regi<strong>on</strong>al Geographical and <str<strong>on</strong>g>Oceanographic</str<strong>on</strong>g> Setting<br />
St. Lawrence Island is located about 300 Ian south of <strong>Bering</strong> Strait in <strong>the</strong> nor<strong>the</strong>rn <strong>Bering</strong><br />
<strong>Sea</strong> (Fig. 1). It is separated from mainland Alaska by Shpanberg Strait, which is about 190 Ian<br />
wide and is shallower than 30 m over much of its width. lsobaths in Shpanberg Strait are aligned<br />
toward <strong>the</strong> north or northwest. Anadyr Strait, to <strong>the</strong> west of <strong>the</strong> island, is about 75 Ian wide and<br />
deepens to greater than 50 m within about 20 Ian of St. Lawrence Island. Its bathymetric axes<br />
trend toward <strong>the</strong> nor<strong>the</strong>ast. <strong>Bering</strong> Strait is approximately 85 Ian wide and 40-60 m deep, with<br />
generally north-south trending isobaths. The regi<strong>on</strong> just south of St. Lawrence Island where<br />
most of <strong>the</strong> moorings were clustered is less than 40 m deep. lsobaths are roughly parallel to <strong>the</strong><br />
island except at 8401, <strong>the</strong> sou<strong>the</strong>rnmost mooring.<br />
Coachman et al. (1975) described three water masses in <strong>the</strong> <strong>Bering</strong> <strong>Sea</strong> north of 62°N.<br />
Fur<strong>the</strong>st west and most saline is Anadyr Water. Its high salinity is probably a result of salt<br />
excluded from ice formed during <strong>the</strong> winter <strong>on</strong> <strong>the</strong> Anadyr <strong>shelf</strong>. To <strong>the</strong> east of this water is<br />
<strong>Bering</strong> <strong>Sea</strong> Water. The regi<strong>on</strong> near <strong>the</strong> Alaskan coast is occupied by Alaskan Coastal Water.<br />
Because of river input this water mass is <strong>the</strong> least saline of <strong>the</strong> three. Schumacher et al. (1983)<br />
also reported <strong>on</strong> <strong>the</strong>se water masses.<br />
Tides are predominantly diurnal <strong>on</strong> <strong>the</strong> outer <strong>Bering</strong> <strong>Sea</strong> <strong>shelf</strong>, but become weaker and<br />
more semidiurnal toward <strong>the</strong> north (Pears<strong>on</strong> et al., 1981; Mofjeld, <strong>1984</strong>). Tidal currents are<br />
decreased when ice is present, although it is unclear whe<strong>the</strong>r <strong>the</strong> measured changes are real or<br />
reflect <strong>the</strong> decrease in rotor pumping by surface waves. Tidal variance represents 2-64% of <strong>the</strong><br />
total current variance during <strong>the</strong> winter at various sites in and near <strong>the</strong> area of <strong>the</strong> present study<br />
1 NOAA/PMEL. 7600 Sand Point Way N.E.• <strong>Sea</strong>ttle. WA 98115-0070<br />
2 Science Applicati<strong>on</strong>s Internati<strong>on</strong>al Corporati<strong>on</strong> (SAIC). 13400B Northrup Way. Suite 36.<br />
Bellevue. WA 98005
(Salo et al., 1983). Tidal currents c<strong>on</strong>tribute <strong>the</strong> smallest fracti<strong>on</strong> of total variance at <strong>Bering</strong><br />
Strait, Anadyr Strait, and sites just south and southwest of St. Lawrence Island. They comprise<br />
<strong>the</strong> largest percentage of <strong>the</strong> total current <strong>on</strong> <strong>the</strong> open <strong>shelf</strong> south of Shpanberg Strait.<br />
L<strong>on</strong>g-tenn mean currents over <strong>the</strong> nor<strong>the</strong>rn <strong>Bering</strong> <strong>shelf</strong> are north-setting, although southward<br />
flow events may persist for days or weeks. This pattern is due to a sea level which slopes<br />
down toward <strong>the</strong> north and to winds which are usually from <strong>the</strong> north and nor<strong>the</strong>ast, especially<br />
during <strong>the</strong> winter. Mean transport through <strong>Bering</strong> Strait was estimated to be roughly 0.8 Sv<br />
toward <strong>the</strong> north by Coachman and Aagaard (1981). Aagaard et al. (1985) used wind records<br />
from 1946-1982 and <strong>the</strong> fact that <strong>the</strong> meridi<strong>on</strong>al comp<strong>on</strong>ent of <strong>the</strong> wind was well-correlated to<br />
existing current records and transport to determine a mean transport of 0.6 Sv. The prevalence of<br />
str<strong>on</strong>g nor<strong>the</strong>rly winds in winter creates a str<strong>on</strong>g seas<strong>on</strong>al cycle in transport with summer<br />
transport roughly 50% greater than winter transport. Daily transport through <strong>Bering</strong> Strait varies<br />
c<strong>on</strong>siderably in resp<strong>on</strong>se to forcing by <strong>the</strong> wind. Coachman and Aagaard (1981) reported values<br />
ranging from 5 Sv southward to 3.1 Sv northward.<br />
The vector mean directi<strong>on</strong>s and <strong>the</strong> axes of greatest variance of currents in <strong>the</strong> <strong>Bering</strong> <strong>Sea</strong><br />
are usually close to <strong>the</strong> directi<strong>on</strong> of <strong>the</strong> isobaths. This is especially true in <strong>the</strong> three straits, where<br />
more than 90% of <strong>the</strong> current variance is aligned with <strong>the</strong> bathymetric axis (Salo et al., 1983).<br />
Mean winter scalar speeds <strong>on</strong> <strong>the</strong> order of 25 crn/s were reported in <strong>Bering</strong> Strait by Aagaard et<br />
al. (1985) and Salo et al. (1983). Salo et al. also determined scalar speeds of 15-20 crn/s in<br />
Anadyr and Shpanberg Straits. Vector mean speeds were <strong>on</strong> <strong>the</strong> order of 15 crn/s in <strong>Bering</strong> and<br />
Anadyr Straits, and 5 crn/s in Shpanberg Strait. The smaller ratios of vector mean/scalar mean<br />
speed in Shpanberg and <strong>Bering</strong> Straits suggest that more reversals occur <strong>the</strong>re than in Anadyr<br />
Strait. Just south of St. Lawrence Island, 63-88% of <strong>the</strong> total variance occurred <strong>on</strong> <strong>the</strong> axis of<br />
greatest variance. Scalar and vector mean speeds were lower than in <strong>the</strong> straits; scalar speeds<br />
varied from 5-9 crn/s while vector speeds ranged from 1-3 crn/s and were often not significant.<br />
Schumacher et al. (1983) hypo<strong>the</strong>sized that <strong>the</strong> current in Anadyr Strait is a c<strong>on</strong>tinuati<strong>on</strong> of<br />
northward flow across <strong>the</strong> mouth of <strong>the</strong> Gulf of Anadyr. Kinder et al. (1986) called this flow a<br />
western boundary current. Schumacher et al. also noted a weak mean flow of 3.5 crn/s directed<br />
toward <strong>the</strong> east just south of St. Lawrence Island. This suggests that a part of <strong>the</strong> current from<br />
<strong>the</strong> Gulf of Anadyr c<strong>on</strong>tinues eastward south of St. Lawrence Island.<br />
Kinder et al. (1986) proposed that <strong>the</strong> water reaching <strong>Bering</strong> Strait crosses <strong>the</strong> <strong>Bering</strong> <strong>Sea</strong><br />
<strong>shelf</strong> via two paths. A laboratory and a barotropic numerical model (which did not include<br />
atmospheric forcing) predicted that a low-salinity current flowing through Shpanberg Strait<br />
carries roughly 15% of <strong>the</strong> flow. A high-salinity western boundary current transports <strong>the</strong> remaining<br />
85% of <strong>the</strong> <strong>Bering</strong> Strait flow. The western boundary current was predicted to be about<br />
50 Ian wide with currents speeds of 10-20 crn/s. A barotropic numerical model presented by<br />
Overland and Roach (1987) predicted that Anadyr Strait water comprises 72% of <strong>the</strong> <strong>Bering</strong><br />
Strait flow in <strong>the</strong> absence of nor<strong>the</strong>rly winds. Under n<strong>on</strong>nal winter wind stress, <strong>the</strong> model<br />
predicted southward mean currents in Shpanberg Strait but northward flow in Anadyr and <strong>Bering</strong><br />
Straits. The result is a recirculati<strong>on</strong> of water north of St. Lawrence Island.<br />
2
2. METHODS<br />
Nine APEX moorings were deployed near St. Lawrence Island inOctober <strong>1984</strong> from <strong>the</strong><br />
RN Alpha Helix. The <strong>Bering</strong> Strait mooring was deployed by helicopter in November <strong>1984</strong><br />
(Fig. I, Table 1). All moorings were taut-wire moorings and c<strong>on</strong>tained from <strong>on</strong>e to three current<br />
meters.<br />
Statistical parameters, correlati<strong>on</strong> coefficients, spectra, and coherences were calculated<br />
using a program package called R2D2 (Pears<strong>on</strong>, 1981). This package was also used to display<br />
current roses and summary vectors. Eight bins, each 45° wide, were used in <strong>the</strong> current roses.<br />
Two different Lanczos cosine-squared tapered filters with half-power points of 2.86 hours and 35<br />
hours were used <strong>on</strong> <strong>the</strong> records. The 2.86 hr filter was used when spectral bands were examined;<br />
<strong>the</strong> low pass filter was used in describing statistical characteristics of <strong>the</strong> currents.<br />
The percent variance of <strong>on</strong>e record coherent with ano<strong>the</strong>r record was calculated from<br />
output from <strong>the</strong> R2D2 coherence output. Output from <strong>the</strong> R2D2 spectra routines was used to<br />
calculate <strong>the</strong> spectral variance in <strong>the</strong> following bands: periods greater than 10 days, periods from<br />
2-5 days, periods from 2-10 days, and diurnal and semidiurnal tidal periods. Although <strong>the</strong> effects<br />
of low latitude storms are generally felt in <strong>the</strong> 2-5 day period, <strong>the</strong> 2-10 day band has often been<br />
c<strong>on</strong>sidered in previous <strong>Bering</strong> <strong>Sea</strong> studies to examine meteorological forcing. Therefore,<br />
variance was calculated for both <strong>the</strong> 2-5 day and 2-10 day bands.<br />
To examine seas<strong>on</strong>al variability of <strong>the</strong> currents, we split <strong>the</strong> records into three ninety-day<br />
periods. One lasted from mid-October to early January, <strong>on</strong>e from early January to early April,<br />
and <strong>the</strong> third from early April to early July. We will refer to <strong>the</strong>se periods as fall, winter and<br />
spring. Most stati<strong>on</strong>s were ice-free during much of <strong>the</strong> first period, ice-covered throughout <strong>the</strong><br />
sec<strong>on</strong>d period, and covered by melting ice during <strong>the</strong> latter part of <strong>the</strong> third period. It was<br />
impossible to compare equal-length ice-free and ice-covered records. Ice was already present at<br />
<strong>the</strong> site when <strong>the</strong> <strong>Bering</strong> Strait mooring was deployed (Table 1). Most of <strong>the</strong> o<strong>the</strong>r sites were<br />
ice-covered by 11 December, though 8402 and 8401 were ice ice-free until 1 and 15 January,<br />
respectively. Ice remained over <strong>the</strong> regi<strong>on</strong> until mid-June.<br />
A program package called METLm (Overland et al., 1980; Macklin et al., <strong>1984</strong>) was used<br />
to generate surface winds from surface pressure fields obtained from <strong>the</strong> Fleet Numerical<br />
<str<strong>on</strong>g>Oceanographic</str<strong>on</strong>g> Center (FNOC). The gradient wind was calculated from <strong>the</strong> pressure fields; it<br />
was <strong>the</strong>n rotated 30° toward lower pressure, and its magnitude was multiplied by 0.8.<br />
3. RESULTS<br />
3.1 Low-Frequency Currents<br />
At <strong>Bering</strong> Strait, <strong>the</strong> current flowed str<strong>on</strong>gly and c<strong>on</strong>sistently toward <strong>the</strong> north. Almost<br />
98% of <strong>the</strong> variance occurred <strong>on</strong> <strong>the</strong> principal variance axis (Table 2; Figs. 2a,b). This axis<br />
coincided with <strong>the</strong> bathymetric axis, and was within 15° of <strong>the</strong> directi<strong>on</strong> of <strong>the</strong> net current. The<br />
vector mean speed, 26.8 cm/s, was 78% of <strong>the</strong> scalar mean speed, fur<strong>the</strong>r attesting to <strong>the</strong> steady<br />
northward flow. The current roses of Fig. 3 show that 74% of <strong>the</strong> flow was within 22.5° of due<br />
north with an average speed of about 40 cm/s. Sixpercent of <strong>the</strong> flow was toward <strong>the</strong> south at<br />
3
oughly <strong>the</strong> same average speed as <strong>the</strong> northward flow, and <strong>the</strong> remaining 20% was weak and<br />
directed to <strong>the</strong> SE-NE quadrant. Reversals to sou<strong>the</strong>rly flow occurred primarily in February and<br />
March, when <strong>the</strong>re were three reversals each lasting roughly <strong>on</strong>e week (Fig. 3a,b).<br />
In Anadyr Strait, <strong>the</strong> vector mean current was directed toward <strong>the</strong> nor<strong>the</strong>ast, within to· of<br />
<strong>the</strong> principal variance axis. The current was highly rectified, with more than 85% of its variance<br />
<strong>on</strong> <strong>the</strong> principal axis, which was 20·-40· to <strong>the</strong> right of <strong>the</strong> bathymetric axis (Table 2). The<br />
vector mean speed was greater than 20 cm/s and was 85% of <strong>the</strong> scalar speed; reversals were<br />
even less frequent here than at <strong>Bering</strong> Strait. Between 83% and 85% of <strong>the</strong> flow was directed<br />
toward 45-90·, with average speeds greater than 30 m/s at <strong>the</strong> top meter and 20-25 cm/s at <strong>the</strong><br />
bottom meter (Figs.2a,b). Episodes of sou<strong>the</strong>rly flow coincided with <strong>the</strong> February and March<br />
<strong>Bering</strong> Strait reversals, although <strong>the</strong>y were weaker and of shorter durati<strong>on</strong> (Figs. 3a,b).<br />
At both sites in Shpanberg Strait, more than 95% of <strong>the</strong> variance occurred <strong>on</strong> <strong>the</strong> principal<br />
variance axis, which was about 5· from <strong>the</strong> bathymetric axis (Table 2). The vector mean current<br />
was 5-8 cm/s northward at less than to· from <strong>the</strong> principal axes. The vector mean magnitude<br />
was respectively 32% and 52% of <strong>the</strong> scalar mean speed, which was itself lower than in <strong>the</strong> o<strong>the</strong>r<br />
two straits. Only 54-61% of <strong>the</strong> flow was directed toward <strong>the</strong> north or northwest, and 27-37%<br />
was directed toward <strong>the</strong> south and sou<strong>the</strong>ast (Fig.2b). In particular, currents were weak and<br />
often sou<strong>the</strong>rly during February-April (Fig. 3b).<br />
Currents at most sites south of St. Lawrence Island were weaker and more variable than in<br />
<strong>the</strong> straits. Between 69% and 74% of <strong>the</strong> variance occurred <strong>on</strong> <strong>the</strong> principal variance axes.<br />
Although <strong>the</strong>se axes were less than 20· from <strong>the</strong> bathymetric axes, <strong>the</strong>re was as much as tOO·<br />
between <strong>the</strong> vector mean current directi<strong>on</strong> and <strong>the</strong> principal axis. Net flow was eastward except<br />
at 8404's bottom meter, where it was south-southwestward and at 8401, where it was northward<br />
(Table 2). Scalar speeds at most sites were <strong>on</strong>ly about a third of scalar speeds in <strong>the</strong> straits.<br />
Vector mean speeds were 9-38% of scalar speeds, although <strong>the</strong>y were significant at all moorings<br />
except 8404. Currents were str<strong>on</strong>ger and more highly rectified at <strong>the</strong> SW and SE corners of <strong>the</strong><br />
island. The scalar speed at 8406 was between speeds measured at Shpanberg and Anadyr Straits.<br />
The current rose at 8406 exhibits a str<strong>on</strong>g east-west axis <strong>on</strong> which 76% of <strong>the</strong> flow occurred;<br />
48% to <strong>the</strong> east and 28% to <strong>the</strong> west. Flow in <strong>the</strong> bight south of <strong>the</strong> island was also eastward<br />
more often than westward, though n<strong>on</strong>e of <strong>the</strong> meters had more than 39% of <strong>the</strong> flow <strong>on</strong> any<strong>on</strong>e<br />
axis (Figs. 2a,b).<br />
3.2 Mean and Net Wind<br />
The surface wind was regi<strong>on</strong>ally homogeneous (Fig. 3c). Winds were predominantly from<br />
<strong>the</strong> north or nor<strong>the</strong>ast, with occasi<strong>on</strong>al periods of up to ten days when winds blew from <strong>the</strong> south.<br />
However, <strong>the</strong>re were some c<strong>on</strong>sistent trends to <strong>the</strong> data (Table 2). The principal axis was<br />
oriented toward <strong>the</strong> NNW in Shpanberg Strait, and clocked steadily around to <strong>the</strong> NNE at<br />
stati<strong>on</strong>s fur<strong>the</strong>r west. The vector mean wind was more nor<strong>the</strong>rly at western moorings and at<br />
<strong>Bering</strong> Strait than at eastern sites. The scalar and vector mean speeds and <strong>the</strong> percent variance<br />
occurring <strong>on</strong> <strong>the</strong> principal axes increased toward <strong>the</strong> north and west, although <strong>the</strong> differences in<br />
<strong>the</strong> vector mean speed were smaller than <strong>the</strong> RMS error.<br />
4
3.3 Current Spectra<br />
The highest total variances measured were at <strong>the</strong> SW comer of St. Lawrence Island and at<br />
<strong>Bering</strong> Strait (Figs. 4a-h). The lowest variances were in <strong>the</strong> bight south of St Lawrence Island.<br />
The average total spectral variance at <strong>the</strong> moorings in <strong>the</strong> three straits was 542.4 cm/s 2 . South of<br />
St. Lawrence Island, <strong>the</strong> average was 428.6 cm/s 2 ; 284.6 cm/s 2 if <strong>the</strong> atypical record from 8406<br />
at <strong>the</strong> SW comer of <strong>the</strong> island is excluded. It is unclear which of <strong>the</strong> two sou<strong>the</strong>rn straits was<br />
more energetic. Total variance measured at <strong>the</strong> two Shpanberg moorings was between <strong>the</strong><br />
variance at <strong>the</strong> two meters <strong>on</strong> <strong>the</strong> Anadyr mooring. Total variance decreased with depth at all<br />
moorings with more than <strong>on</strong>e meter, and <strong>the</strong> depths of <strong>the</strong> Shpanberg moorings were intermediate<br />
between <strong>the</strong> depths of <strong>the</strong> Anadyr meters.<br />
Variance <strong>on</strong> <strong>the</strong> minor axis was generally a factor of ten less than variance <strong>on</strong> <strong>the</strong> principal<br />
axis. The <strong>on</strong>ly case where variance <strong>on</strong> <strong>the</strong> minor axis surpassed variance <strong>on</strong> <strong>the</strong> principal axis<br />
was in <strong>the</strong> semidiumal tidal band at 8401. Current spectra at all meters were red except for peaks<br />
at tidal periods (Figs. 4a-h). In <strong>the</strong> three straits and at 8406, more variance was in <strong>the</strong> >lO-day<br />
band than in any o<strong>the</strong>r, while at every o<strong>the</strong>r site variance was greatest in <strong>the</strong> tidal band. Records<br />
of stati<strong>on</strong>s in <strong>the</strong> fIrst regi<strong>on</strong> c<strong>on</strong>tained 37-63% of <strong>the</strong>ir variance in periods >10 days and 2-26%<br />
of <strong>the</strong>ir variance at tidal periods. The o<strong>the</strong>r stati<strong>on</strong>s had 10-15% of <strong>the</strong>ir variance in <strong>the</strong> >lO-day<br />
band and 37-65% of <strong>the</strong>ir variance at tidal periods. At moorings with more than <strong>on</strong>e meter <strong>the</strong><br />
percent variance at periods >10 days increased with depth, and <strong>the</strong> percent at tidal periods<br />
decreased with depth.<br />
There was less regi<strong>on</strong>al difference of <strong>the</strong> percent variati<strong>on</strong> at 2-10 day and 2-5 day periods<br />
than for <strong>the</strong> bands discussed above. South of St. Lawrence Island, 19-33% of <strong>the</strong> variance was in<br />
<strong>the</strong> 2-10 day band and 13-20% was at 2-5 day periods. In <strong>the</strong> straits and at 8406, 26-35% of <strong>the</strong><br />
variance was at 2-10 day periods and 14-19% at 2-5 day periods. Like l<strong>on</strong>g-period variance, <strong>the</strong><br />
percent variance in <strong>the</strong> 2-10 day and 2-5 day bands increased with depth.<br />
3.4 Wind Spectra<br />
Like <strong>the</strong> current spectra, wind spectra were red. As would be expected from <strong>the</strong> fact that<br />
<strong>on</strong>ly 55-68% of <strong>the</strong> winds' variance occurred <strong>on</strong> <strong>the</strong>ir principal axes (Table 2), variance <strong>on</strong> <strong>the</strong><br />
principal and orthog<strong>on</strong>al axes were of approximately <strong>the</strong> same magnitude. There was less than a<br />
10% difference between <strong>the</strong> highest total wind variance (at <strong>Bering</strong> and Shpanberg Straits) and <strong>the</strong><br />
lowest (at <strong>the</strong> westernmost moorings). At all moorings, 54-62% of <strong>the</strong> total wind variance was at<br />
periods greater than 10 days, about 35% was at periods of 2-10 days, and about 20% was at 2-5<br />
days.<br />
3.5 Correlati<strong>on</strong> and Coherence<br />
All correlati<strong>on</strong> coefficients computed from records of meters <strong>on</strong> <strong>the</strong> same mooring were<br />
0.9 or greater and were highest at 0 lag (Table 3). Meters <strong>on</strong> <strong>the</strong> same mooring were coherent at<br />
all periods (Fig. 5a). Most of <strong>the</strong> cross-variance for <strong>the</strong>se comparis<strong>on</strong>s was at periods greater<br />
than 7.5 days (9.1 days at 8401), although records from meters south of St. Lawrence Island<br />
5
exhibited little cross-variance at 11.7 days, and all three comparis<strong>on</strong>s showed energy at <strong>on</strong>e or<br />
more periods near 4 days.<br />
<strong>Bering</strong> Strait currents were better correlated with Shpanberg Strait currents than with those<br />
at Anadyr Strait (Table 3). Correlati<strong>on</strong> coefficients between <strong>Bering</strong> Strait and Anadyr Strait<br />
moorings were about 0.53. <strong>Bering</strong> Strait flow was coherent with current at Anadyr Strait in three<br />
bands: from 16-26 days, at 6.4 days, and at 4-5 days (Table 5b). Most cross~variance was found<br />
in <strong>the</strong> 16-26 day band. Correlati<strong>on</strong> coefficients with Shpanberg Strait moorings 8410 and 8411<br />
were 0.77 and 0.66. Although currents at both sites in Shpanberg Strait were highly coherent<br />
(Fig.5a), <strong>Bering</strong> Strait flow was more coherent with 8410 than 8411. There were <strong>on</strong>ly four<br />
periods, all at 2.5-4.4 days, where <strong>Bering</strong> Strait flow was not coherent with flow at 8410. The<br />
cross-variance was highest at periods greater than 9 days. The <strong>on</strong>ly significant lag was at 3.96<br />
days, where 8411 led <strong>Bering</strong> Strait by 8 hours. 8411 also led 8410 at this period (Fig. 5a).<br />
Current fluctuati<strong>on</strong>s in Anadyr Strait were not correlated to those in Shpanberg Strait; n<strong>on</strong>e<br />
of <strong>the</strong> correlati<strong>on</strong> coefficients were significant (Table 3). Less than 3% of flow at Anadyr Strait<br />
was coherent with Shpanberg Strait currents, while 3-4% of 841O's current and 8-9% of 8411 's<br />
current were coherent with Anadyr Strait flow (Table 4). Flow in <strong>the</strong> two straits was coherent<br />
<strong>on</strong>ly at 3.62 and 3.96 days, and <strong>the</strong>re was little cross-variance at <strong>the</strong>se periods.<br />
Flow at all moorings south of St. Lawrence Island except 8404 was better correlated with<br />
Shpanberg Strait than with Anadyr Strait flow (Table 3). Except for 8401, all correlati<strong>on</strong>s with<br />
Shpanberg Strait were negative, and correlati<strong>on</strong>s with Anadyr Strait were positive. This indicates<br />
that northward flow in Shpanberg Strait was correlated to westward flow south of St. Lawrence<br />
Island (or southward flow in Shpanberg Strait was associated with eastward flow south of <strong>the</strong><br />
island). Northward flow in Anadyr Strait was associated with eastward flow south of St.<br />
Lawrence Island. Correlati<strong>on</strong>s were improved when <strong>the</strong> strait's record lagged <strong>the</strong> record south of<br />
St. Lawrence Island by 6-12 hours. Seven to 17% of 8404's current was coherent with Shpanberg<br />
current and 30-33% with Anadyr flow (Table 4). At <strong>the</strong> o<strong>the</strong>r sites, 0-7% of <strong>the</strong> current was<br />
coherent with Anadyr flow and 11-80% with Shpanberg currents.<br />
Currents at 8404 were most coherent with Anadyr Strait at 3.6-9.1 days, with <strong>the</strong> greatest<br />
cross-variance at 4.4 and 70 days. Current fluctuati<strong>on</strong>s at 8404 were disc<strong>on</strong>tinuously coherent<br />
with current at 8410 in Shpanberg Strait from 2.9 to 6.4 days, though <strong>the</strong>re was energy <strong>on</strong>ly at<br />
3.96 and 6.4 days. It was less coherent with 8411. All significant coherences with Shpanberg<br />
Strait currents were lagged and in all unambiguous lags Shpanberg current fluctuati<strong>on</strong>s led those<br />
at 8404.<br />
Correlati<strong>on</strong> coefficients for comparis<strong>on</strong>s between records from any two sou<strong>the</strong>rn meters<br />
were significant. The largest coefficient was .73, between 8406-8404 and 8406-8401. The<br />
smallest coefficient was -.37 in <strong>the</strong> 8403-8401 comparis<strong>on</strong>; current fluctuati<strong>on</strong>s at 8403 were<br />
highly correlated <strong>on</strong>ly to flow at 8404. Correlati<strong>on</strong>s am<strong>on</strong>g currents at 8406, 8403, and 8404<br />
were all positive, but correlati<strong>on</strong>s of any of <strong>the</strong>se with 8401, like correlati<strong>on</strong>s with Shpanberg<br />
Strait, were negative (Table 3). Only <strong>on</strong>e set of coherences for this regi<strong>on</strong> is displayed in Fig. 5c.<br />
Current at 8404 was coherent with flow at 8403 at most periods, and <strong>the</strong> cross-variance was<br />
fairly evenly distributed through <strong>the</strong> spectrum. Four lags were significant; 8403 led 8404 by 4 to<br />
6
52 hours. Flow at meters 8403 and 8406 were less coherent than 8403-8404. Their coherence<br />
was predominantly at 2.9-6.4 days, and <strong>on</strong>ly four of <strong>the</strong> coherent periods had more than 5% of<br />
<strong>the</strong> total cross-variance. At 6.4, 4.9, 3.3, and 3.1 days 8404 led 8406 by 9-14 hours. 8404 was<br />
coherent with 8401 at <strong>on</strong>ly five scattered periods, from 70 days to 2.5 days. All peaks except <strong>the</strong><br />
3.3 day peak c<strong>on</strong>tained energy, and all lags were indistinguishable from ±180° except <strong>the</strong> 5.5-day<br />
peak, where 8404 lagged 8401 by 51 hours.<br />
A major problem in correlating currents to winds was <strong>the</strong> choice of a wind axis, especially<br />
since at most sites <strong>on</strong>ly 55-60% of <strong>the</strong> wind variance was <strong>on</strong> <strong>the</strong> principal axis. Thus, correlati<strong>on</strong>s<br />
and coherences are presented for two wind axes: <strong>the</strong> wind's principal axis and <strong>the</strong> axis (to<br />
<strong>the</strong> nearest 10°) with which <strong>the</strong> greatest percent of <strong>the</strong> current variance was coherent. We will<br />
refer to this sec<strong>on</strong>d axis as <strong>the</strong> associated axis. The winds' principal axes, to <strong>the</strong> nearest 10°,<br />
were 170-200° (Tables 2, 5). In <strong>the</strong> straits, <strong>the</strong> associated axes were 20-50° anti-clockwise of <strong>the</strong><br />
principal axes of <strong>the</strong> wind and 100-170° from <strong>the</strong> principal axes of <strong>the</strong> currents. The two wind<br />
axes were separated by 40-90° in <strong>the</strong> regi<strong>on</strong> south of St. Lawrence Island. The wind variance <strong>on</strong><br />
<strong>the</strong> associated axis was 71-96% of <strong>the</strong> variance <strong>on</strong> <strong>the</strong> principal axis in <strong>the</strong> straits. It was 65-85%<br />
of<strong>the</strong> principal axis variance south ofSt. Lawrence Island.<br />
Currents in <strong>Bering</strong> and Shpanberg Straits were better correlated and more coherent to <strong>the</strong><br />
wind than was current in Anadyr Strait. In <strong>Bering</strong> and Shpanberg Straits, correlati<strong>on</strong> coefficients<br />
between <strong>the</strong> currents and wind respectively <strong>on</strong> its principal and associated axes were about -.7<br />
and -.8 (Table 3). From 36-50% of <strong>the</strong> variance in <strong>the</strong>se straits was coherent with <strong>the</strong> wind <strong>on</strong> its<br />
principal axes, while 64-74% of<strong>the</strong> current was coherent with <strong>the</strong> wind <strong>on</strong> its associated axes. In<br />
Anadyr Strait, <strong>the</strong> coefficients were -.53 and -.55. Only 20% and 41 % of <strong>the</strong> variance of Anadyr<br />
Strait's upper meter was coherent with wind <strong>on</strong> <strong>the</strong> two axes. All <strong>the</strong> correlati<strong>on</strong> coefficients<br />
were obtained when <strong>the</strong> current lagged <strong>the</strong> wind by 6-12 hours.<br />
Most of <strong>the</strong> cross-variance for wind-current coherences in <strong>the</strong> three straits was at periods<br />
greater than 9 days, although at 8411 in Shpanberg Strait <strong>the</strong> "high-energy" band extended down<br />
to 4 days (Fig. 5d). <strong>Bering</strong> Strait current was coherent with wind <strong>on</strong> ei<strong>the</strong>r axis at most periods.<br />
In Shpanberg Strait, although <strong>the</strong> magnitude of <strong>the</strong> coherences was similar to those in <strong>Bering</strong><br />
Strait, <strong>the</strong>re were more periods where <strong>the</strong> currents and winds were not coherent. Anadyr Strait<br />
current was coherent with <strong>the</strong> wind <strong>on</strong>ly in isolated peaks. A peak at 26.2 days dominates <strong>the</strong><br />
coherence spectra, especially in <strong>the</strong> comparis<strong>on</strong>s involving <strong>the</strong> wind <strong>on</strong> its principal axes.<br />
Greater than 30% of <strong>the</strong> cross-variance in <strong>Bering</strong> and Anadyr Straits, and 10-30% of <strong>the</strong> crossvariance<br />
in Shpanberg Strait was found at that period.<br />
Currents in <strong>the</strong> regi<strong>on</strong> south of St. Lawrence Island were less correlated to <strong>the</strong> wind than<br />
were <strong>the</strong> currents in <strong>the</strong> <strong>Bering</strong> and Shpanberg Straits. Except at 8401, <strong>the</strong>y were also less<br />
coherent with <strong>the</strong> wind, especially at l<strong>on</strong>g periods (Fig.5e). The variance in <strong>the</strong> cross-spectra<br />
was shifted toward shorter periods; <strong>the</strong> spectra c<strong>on</strong>tain a greater percent of <strong>the</strong>ir cross-variance at<br />
periods of 3.5 to 5.5 days than spectra in <strong>the</strong> straits except 8411. Currents were more coherent<br />
with <strong>the</strong> wind at 8406 and especially '8401 (which resembled 8411) than in <strong>the</strong> bight of <strong>the</strong><br />
island. The wind's principal axis was sometimes perpendicular to <strong>the</strong> principal axis of <strong>the</strong><br />
current in this regi<strong>on</strong>; current was especially poorly correlated to wind <strong>on</strong> this axis. From 0-13%<br />
7
of <strong>the</strong> currents was coherent with winds <strong>on</strong> <strong>the</strong>ir principal axes, and from 8-47% was explained<br />
by winds <strong>on</strong> <strong>the</strong>ir associated axes.<br />
4. SEASONAL VARIABILITY<br />
4.1 Total Current Variance and Partiti<strong>on</strong>ing ofVariance<br />
Total current variance was highest at all meters during autumn (Table 6; Figs.6a-f).<br />
Winter variance at most sites was 70-88% of fall variance, although at 8403 it fell to 53%. At 8<br />
out of 12 meters, variance fur<strong>the</strong>r decreased to 30-40% of fall variance during <strong>the</strong> spring. O<strong>the</strong>r<br />
meters showed less of a decrease. At <strong>Bering</strong> Strait, variance during <strong>the</strong> spring was 28% of<br />
winter variance.<br />
The decreases in variance were not uniformly distributed in <strong>the</strong> spectrum, leading to shifts<br />
in <strong>the</strong> relative importance of different bands. One shift which occurred in Anadyr Strait and at<br />
most sou<strong>the</strong>rn moorings was that <strong>the</strong> percentage of <strong>the</strong> total variance at periods greater or equal<br />
to 2 days increased in <strong>the</strong> winter and <strong>the</strong>n decreased in <strong>the</strong> spring. For example, at <strong>the</strong> top meter<br />
in Anadyr Strait respectively 77%, 82% and 49% of <strong>the</strong> total variance was in <strong>the</strong>se bands during<br />
<strong>the</strong> three seas<strong>on</strong>s. This pattern did not occur in Shpanberg Strait and at 8401. There, <strong>the</strong><br />
variance at 2-5 days increased to up to 182% of autumn values. However, <strong>the</strong> variance at 2-10<br />
days decreased sharply enough that <strong>the</strong> percent of <strong>the</strong> total variance at greater or equal to 2 days<br />
decreased during <strong>the</strong> winter.<br />
4.2 Wind Variance<br />
There was relatively little change in total wind variance from autumn to winter, but<br />
variances decreased greatly during spring. Although regi<strong>on</strong>al differences in <strong>the</strong> changes may not<br />
be significant, <strong>the</strong>y showed an east-west trend. Total wind variance in <strong>Bering</strong> and Shpanberg<br />
Straits increased during winter to 102-120% of autumn variance. At o<strong>the</strong>r moorings, winter<br />
variance was 85-96% of autumn variance, with greater decreases at <strong>the</strong> western sites. Spring<br />
variances were 31-55% of fall variances. Again, decreases were greater in <strong>the</strong> west than <strong>the</strong> east.<br />
Thus, wind at Anadyr Strait had <strong>the</strong> greatest autumn variance, but <strong>the</strong> lowest spring variance.<br />
In winter, wind variance at periods >10 days increased to 108-139% of autumn variance in<br />
this band at all sites except Anadyr Strait and 8406. Winter variance at periods >10 days accounted<br />
for more than 62% of <strong>the</strong> total variance at all moorings. Variance in this band decreased<br />
in spring to 24-57% of fall values, with <strong>the</strong> largest decreases occurring in <strong>the</strong> west.<br />
Wind variance in <strong>the</strong> 2-5 day band increased slightly during winter at <strong>Bering</strong> and Anadyr<br />
Straits, but decreased at o<strong>the</strong>r sites to 84-94% of fall variances. Variance in <strong>the</strong> 2-10 day band<br />
decreased everywhere to 58-91% of autumn values. The largest decreases occurred at sou<strong>the</strong>rn<br />
meters. Spring variances in both bands were respectively 36-46% and 41-65% of fall values,<br />
with <strong>the</strong> largest decreases in <strong>the</strong> west.<br />
4.3 Scalar and Vector Mean Currents<br />
Variati<strong>on</strong> in <strong>the</strong> current's scalar means resembled that of <strong>the</strong> total variance at all sites<br />
except at <strong>the</strong> bottom meter at 8404, but <strong>the</strong> net current magnitude showed a different pattern. In<br />
8
oth Anadyr and Shpanberg Straits, <strong>the</strong> vector mean magnitude was weakest during winter. In<br />
<strong>Bering</strong> Strait, winter magnitude was <strong>the</strong> weaker of <strong>the</strong> two seas<strong>on</strong>s sampled. Vector mean<br />
magnitudes were similar in Anadyr and Shpanberg Straits in <strong>the</strong> fall. The winter vector mean<br />
magnitude in Anadyr Strait was 84-85% of its autumn value while at Shpanberg Strait winter<br />
magnitude dropped to 21-32% of <strong>the</strong> autumn value. The magnitude at 8411 was not significant.<br />
In Anadyr Strait, <strong>the</strong> highest vector mean magnitude and smallest RMS error occurred in <strong>the</strong><br />
spring, but Shpanberg Strait net current remained near <strong>the</strong> winter values, although <strong>the</strong> RMS error<br />
decreased. South of St. Lawrence Island, all autumn vector mean magnitudes were significant,<br />
but <strong>on</strong>ly 2 of 5 winter magnitudes and 4 of 6 spring magnitudes were. Net magnitude at three of<br />
<strong>the</strong> 6 full-time records decreased throughout <strong>the</strong> three seas<strong>on</strong>s.<br />
In Shpanberg and probably <strong>Bering</strong> Straits, winter currents were southward during a greater<br />
percentage of time than during <strong>the</strong> o<strong>the</strong>r two seas<strong>on</strong>s (Figs.3a,b; Figs.6a-f). In Anadyr Strait,<br />
<strong>the</strong> maximum durati<strong>on</strong> of reversed (toward <strong>the</strong> southwest) flow occurred in autumn. Currents<br />
were northward about 80% of <strong>the</strong> time during autumn in Shpanberg Strait, and were toward <strong>the</strong><br />
N-E quadrant 80-85% of <strong>the</strong> time in Anadyr Strait. In winter, currents were northward about<br />
55% of <strong>the</strong> time in Shpanberg Strait and 73% of <strong>the</strong> time in <strong>Bering</strong> Strait. In Anadyr Strait,<br />
currents were toward <strong>the</strong> N-E quadrant 85-90% of <strong>the</strong> time although 13% of flow at <strong>the</strong> surface<br />
meter was directed across <strong>the</strong> strait toward St. Lawrence Island. A greater percentage of flow<br />
was eastward than during autumn at both meters. During spring, currents were northward <strong>on</strong>ly<br />
64-75% of <strong>the</strong> time in Shpanberg Strait. Currents in <strong>Bering</strong> and Anadyr Straits were respectively<br />
toward <strong>the</strong> north and N-E quadrant 99% of <strong>the</strong> time. The percent of flow at Anadyr Strait's<br />
surface meter directed toward <strong>the</strong> east c<strong>on</strong>tinued to increase; from 43% in <strong>the</strong> winter to 66% in<br />
<strong>the</strong> spring.<br />
During all three seas<strong>on</strong>s, a greater percentage of<strong>the</strong> currents at most moorings just south of<br />
St. Lawrence Island was toward <strong>the</strong> NE-SE quadrant (at 8406 and 8402) and <strong>the</strong> E-S quadrant (at<br />
8403 and 8404) than in <strong>the</strong> reverse sense. There was too much scatter in <strong>the</strong> data from moorings<br />
in <strong>the</strong> bight of <strong>the</strong> island to allow definiti<strong>on</strong> of seas<strong>on</strong>al trends, but at <strong>the</strong> mooring near <strong>the</strong><br />
southwest corner of <strong>the</strong> island <strong>the</strong> percentage of eastward currents was lowest in <strong>the</strong> autumn and<br />
highest in <strong>the</strong> spring.<br />
4.4 Scalar and Net Mean Winds<br />
Scalar and vector mean magnitudes of winds at almost all moorings were greatest during<br />
winter and lowest during spring. Autumn and winter magnitudes were similar (vector mean<br />
magnitudes were not significantly different), but spring magnitudes were substantially lower.<br />
The vector mean wind was from <strong>the</strong> nor<strong>the</strong>ast during <strong>the</strong> autumn and veered toward nor<strong>the</strong>rly<br />
during <strong>the</strong> winter and spring (Table 6; Figs. 6a-f).<br />
4.5 Correlati<strong>on</strong>s<br />
Correlati<strong>on</strong> coefficients between current fluctuati<strong>on</strong>s in <strong>the</strong> straits varied seas<strong>on</strong>ally.<br />
Currents at Anadyr Strait were best correlated with <strong>Bering</strong> Strait flow during <strong>the</strong> winter<br />
(Table 7a-c). During <strong>the</strong> spring <strong>the</strong> correlati<strong>on</strong> coefficient for <strong>the</strong> two records was not sig-<br />
9
nificant. Currents in <strong>Bering</strong> and Shpanberg Straits were well correlated during both winter and<br />
spring. Currents at Anadyr Strait were not well-correlated with Shpanberg Strait flow during fall<br />
or winter, but were correlated with currents at 8411 (and 8401, just south of Shpanberg Strait)<br />
during spring. The correlati<strong>on</strong> coefficient for <strong>the</strong>se comparis<strong>on</strong>s was negative and increased<br />
when Anadyr Strait current lagged that at 8411 or 8401 by 6-12 hours.<br />
Current fluctuati<strong>on</strong>s in Shpanberg Strait were correlated to those at sou<strong>the</strong>rn moorings<br />
except 8403 during all three seas<strong>on</strong>s. Shpanberg Strait flow was not significantly correlated to<br />
flow at 8403 during winter (Table 7a-c). Correlati<strong>on</strong> coefficients, were highest during autumn in<br />
7 of 12 comparis<strong>on</strong>s, but <strong>the</strong>re was no c<strong>on</strong>sistent geographical pattern to <strong>the</strong> seas<strong>on</strong>al trends. In<br />
c<strong>on</strong>trast, current at Anadyr Strait was correlated to flow <strong>on</strong>ly at 8404 during all three seas<strong>on</strong>s. It<br />
was correlated to flow at 8403 and 8401 <strong>on</strong>ly during spring, and to flow at 8406 <strong>on</strong>ly during<br />
winter and spring. The signs of <strong>the</strong> correlati<strong>on</strong> coefficients of comparis<strong>on</strong>s between a record<br />
from <strong>on</strong>e of <strong>the</strong> straits and a record from south of S1. Lawrence Island was <strong>the</strong> same as <strong>the</strong> signs<br />
of <strong>the</strong> full-length correlati<strong>on</strong>s. In nearly all comparis<strong>on</strong>s, <strong>the</strong> current at <strong>the</strong> straits lagged current<br />
at <strong>the</strong> stati<strong>on</strong>s south of S1. Lawrence Island.<br />
Seven of <strong>the</strong> eleven correlati<strong>on</strong>s of records in <strong>the</strong> regi<strong>on</strong> south of S1. Lawrence Island were<br />
highest in autumn (fable 7a-c). Winter decreases in correlati<strong>on</strong> were especially drastic in <strong>the</strong><br />
comparis<strong>on</strong>s of 8403 with 8406 or 8401. In most cases <strong>the</strong> signs and phase lags remained<br />
c<strong>on</strong>stant, as described in <strong>the</strong> full-time correlati<strong>on</strong> secti<strong>on</strong> above.<br />
4.6 <strong>Sea</strong>s<strong>on</strong>al Wind Correlati<strong>on</strong><br />
Current fluctuati<strong>on</strong>s in <strong>the</strong> straits were best correlated to wind <strong>on</strong> its associated axis during<br />
<strong>the</strong> winter, while currents at <strong>the</strong> sou<strong>the</strong>rn moorings were best correlated to this wind comp<strong>on</strong>ent<br />
during autumn (Table 7a-c). <strong>Sea</strong>s<strong>on</strong>al variati<strong>on</strong> in <strong>the</strong> coefficients was greatest in Anadyr Strait<br />
and at 8404. Current fluctuati<strong>on</strong>s were correlated to wind <strong>on</strong> ei<strong>the</strong>r <strong>the</strong> associated or principal<br />
axis except at 8404, where <strong>the</strong>y were not correlated to wind <strong>on</strong> its principal axis.<br />
5. DISCUSSION<br />
Currents in Anadyr and <strong>Bering</strong> Straits reflect global-scale forcing (Kinder et a/., 1987), but<br />
flow in Shpanberg Strait is more affected by regi<strong>on</strong>al-scale processes. During <strong>the</strong> winter of<br />
<strong>1984</strong>-1985, <strong>the</strong> current in Anadyr Strait was more steadily northward-setting than current in<br />
ei<strong>the</strong>r Shpanberg or <strong>Bering</strong> Straits. Its fluctuati<strong>on</strong>s were uncorrelated to fluctuati<strong>on</strong>s in Shpanberg<br />
Strait, and during <strong>the</strong> spring were even uncorrelated to those in <strong>Bering</strong> Strait. Current<br />
fluctuati<strong>on</strong>s in Anadyr Strait were also less correlated with winds than were currents in <strong>the</strong> o<strong>the</strong>r<br />
two straits.<br />
During winter, <strong>the</strong> predominant nor<strong>the</strong>rly wind opposes <strong>the</strong> northward flow of current in<br />
<strong>the</strong> straits. Shpanberg Strait flow is particularly affected by this wind and may reverse for l<strong>on</strong>g<br />
periods. Currents in <strong>Bering</strong> and Anadyr Straits are less likely to reverse. However, flow in<br />
Anadyr Strait may become more easterly during periods of increased southward flow in Shpanberg<br />
Strait. This suggests that eastward recirculati<strong>on</strong> of water may occur north and south of St.<br />
Lawrence Island. Recirculati<strong>on</strong> was also suggested in 1986 by <strong>the</strong> trajectory of two ARGOS<br />
10
uoys deployed by Carol Pease off <strong>the</strong> northwest corner of St. Lawrence Island. Despite easterly<br />
and nor<strong>the</strong>asterly winds <strong>the</strong>se buoys drifted eastward and <strong>the</strong>n south through Shpanberg Strait<br />
(pers<strong>on</strong>al communicati<strong>on</strong>).<br />
Flow south of St. Lawrence Island is complex. The current fluctuati<strong>on</strong>s of records from<br />
<strong>the</strong> bight of <strong>the</strong> island were well correlated am<strong>on</strong>g <strong>the</strong>mselves and were generally bettercorrelated<br />
to fluctuati<strong>on</strong>s in Shpanberg Strait than those in Anadyr Strait. This suggests that flow<br />
in Shpanberg Strait and south of St. Lawrence Island are affected by <strong>the</strong> same regi<strong>on</strong>al-scale<br />
forcing.<br />
6. SUMMARY<br />
L<strong>on</strong>g-term mean currents in <strong>Bering</strong>, Anadyr, and Shpanberg Straits were north-setting and<br />
highly rectified. From 85-98% of <strong>the</strong> variance occurred <strong>on</strong> <strong>the</strong> principal axes, which nearly<br />
coincided with <strong>the</strong> local bathymetric axes in <strong>Bering</strong> and Shpanberg Straits and were 20-40·<br />
eastward from <strong>the</strong> bathymetric axis in Anadyr Strait. Scalar and vector mean magnitudes were<br />
greater in <strong>Bering</strong> and Anadyr Straits than in Shpanberg Strait. Currents in <strong>the</strong> regi<strong>on</strong> south of St.<br />
Lawrence Island were weaker and less rectified than currents in <strong>the</strong> straits, although most vector<br />
mean magnitudes were significant. The vector-mean flow was eastward or sou<strong>the</strong>astward at<br />
most moorings.<br />
The data suggest that eastward recirculati<strong>on</strong> of water from Anadyr Strait north and south of<br />
St. Lawrence Island occurred during winter. During autumn, <strong>the</strong> mean magnitudes of <strong>the</strong> currents<br />
in Anadyr and Shpanberg Straits were similar. During winter, <strong>the</strong> scalar mean magnitudes<br />
decreased slightly in both of <strong>the</strong>se straits. Due to frequent flow reversals in Shpanberg Strait, <strong>the</strong><br />
vector mean magnitude <strong>the</strong>re dropped sharply to 21-32% of its autumn value. Flow reversals in<br />
<strong>Bering</strong> Strait during winter coincided with most reversals in Shpanberg Strait, though <strong>the</strong>y were<br />
generally weaker and of shorter durati<strong>on</strong>. The vector mean magnitude in Anadyr Strait showed<br />
<strong>on</strong>ly a small decrease during this period, since flow reversals <strong>the</strong>re were less frequent and of<br />
shorter durati<strong>on</strong> than in <strong>the</strong> o<strong>the</strong>r two straits. The percentage of east-directed currents in Anadyr<br />
Strait did increase during winter, so that <strong>the</strong> vector mean directi<strong>on</strong> was to-IS· east of its autumn<br />
directi<strong>on</strong>. This suggests that water from Anadyr Strait was being recirculated north of St.<br />
Lawrence Island. Eastward flow south of <strong>the</strong> <strong>the</strong> island during decreased flow in Anadyr Strait<br />
suggests recirculati<strong>on</strong> also occurred south of <strong>the</strong> island. During spring, <strong>the</strong> scalar mean magnitude<br />
decreased fur<strong>the</strong>r in Shpanberg Strait but increased in <strong>Bering</strong> and Anadyr Straits, as did <strong>the</strong><br />
vector mean magnitudes.<br />
There was little geographic difference in winds over <strong>the</strong> study regi<strong>on</strong>. Winds were<br />
predominantly from <strong>the</strong> north and nor<strong>the</strong>ast. The vector mean wind, directed toward <strong>the</strong> southwest<br />
at all moorings during autumn, became progressively more south-directed during winter and<br />
spring. Scalar mean magnitudes were similar during autumn and winter but were much lower in<br />
spring. Vector mean magnitudes were highest during winter and lowest during spring, although<br />
<strong>the</strong> differences between autumn and winter magnitudes were less than <strong>the</strong> RMS errors. The<br />
increase was especially small in Shpanberg Strait. Total wind variance was greatest during<br />
autumn at all locati<strong>on</strong>s except <strong>Bering</strong> and Shpanberg Straits. In Anadyr and <strong>Bering</strong> Straits <strong>the</strong><br />
11
total wind variance during winter was respectively 85% and 120% of its autumn value, but <strong>the</strong>re<br />
was little difference between <strong>the</strong> two seas<strong>on</strong>s in Shpanberg Strait and o<strong>the</strong>r eastern moorings.<br />
Total wind variance was substantially lower during spring at all sites. Given <strong>the</strong> relatively stable<br />
wind <str<strong>on</strong>g>c<strong>on</strong>diti<strong>on</strong>s</str<strong>on</strong>g> in Shpanberg Strait, it is unlikely that <strong>the</strong> sharp drop in <strong>the</strong> vector mean current<br />
magnitude which occurred in <strong>the</strong> strait during winter to local wind forcing, although <strong>the</strong> change<br />
in wind directi<strong>on</strong> made <strong>the</strong> wind more effective in countering <strong>the</strong> current. The wind at <strong>Bering</strong><br />
Strait would appear to be more important, as in Aagaard et al. (1985).<br />
<strong>Bering</strong> Strait current fluctuati<strong>on</strong>s were better correlated to (and coherent with) current<br />
fluctuati<strong>on</strong>s in Shpanberg Strait than those in Anadyr Strait. Most of <strong>the</strong> cross-variance of <strong>the</strong><br />
coherence spectra was at l<strong>on</strong>g periods. Fluctuati<strong>on</strong>s in <strong>the</strong> latter two straits were virtually<br />
uncorrelated except during spring. During that seas<strong>on</strong>, flow in Anadyr Strait was uncorrelated to<br />
currents in <strong>Bering</strong> Strait, but was correlated to flow at <strong>the</strong> stati<strong>on</strong> in <strong>the</strong> center of Shpanberg<br />
Strait. Flow in <strong>the</strong> regi<strong>on</strong> south of St. Lawrence Island was generally better correlated to flow in<br />
Shpanberg Strait than in Anadyr Strait Eastward fluctuati<strong>on</strong>s in <strong>the</strong> sou<strong>the</strong>rn regi<strong>on</strong> were<br />
correlated to southward flow in Shpanberg Strait and to northward flow in Anadyr Strait.<br />
Current fluctuati<strong>on</strong>s in <strong>the</strong> sou<strong>the</strong>rn regi<strong>on</strong> were correlated am<strong>on</strong>g <strong>the</strong>mselves, although flow at<br />
8403 nearest <strong>the</strong> shore in <strong>the</strong> bight of <strong>the</strong> island was highly correlated <strong>on</strong>ly to flow at 8404 just<br />
offshore from it.<br />
The currents in <strong>the</strong> straits were better correlated to wind <strong>on</strong> axes directed toward <strong>the</strong> south<br />
or sou<strong>the</strong>ast than to winds <strong>on</strong> <strong>the</strong> principal axes <strong>the</strong>mselves. Currents in Shpanberg and <strong>Bering</strong><br />
Straits were more coherent with <strong>the</strong> wind than were currents in Anadyr Strait. Most of <strong>the</strong><br />
cross-variance of <strong>the</strong> coherences was at periods greater than 9 days. South of St. Lawrence<br />
Island, winds were less coherent with <strong>the</strong> wind than winds in <strong>Bering</strong> or Anadyr Strait.<br />
7. ACKNOWLEDGMENTS<br />
This Technical Memorandum is a c<strong>on</strong>tributi<strong>on</strong> to <strong>the</strong> Marine Services Project at NOAA's<br />
Pacific Marine Envir<strong>on</strong>mental Laboratory in support of <strong>the</strong> Navy-NOAA Joint Ice Center. This<br />
work has been carried out with support from Nati<strong>on</strong>al Science Foundati<strong>on</strong> grant DPP-8409423 to<br />
Science Applicati<strong>on</strong>s Internati<strong>on</strong>al Corporati<strong>on</strong> (S.A.I.C) (R.D.M), Office of Naval Research<br />
(ONR) c<strong>on</strong>tract NOOOI4-82-C-0064 with S.A.I.c. (R.D.M.), and <strong>the</strong> Marine Services Research<br />
Divisi<strong>on</strong> of NOAA's Pacific Marine Envir<strong>on</strong>mental Laboratory supported in part by <strong>the</strong> Arctic<br />
program, ONR (lD.S. and S.S.). NOAA PMEL c<strong>on</strong>tributi<strong>on</strong> 1004.<br />
12
8. REFERENCES<br />
Aagaard, K., A.T. Roach, and J.D. Schumacher (1985): On <strong>the</strong> wind-driven variability of <strong>the</strong><br />
flow through <strong>Bering</strong> Strait. J. Geophys. Res., 90(C4) 7213-7221.<br />
Coachman, L.K., K. Aagaard, and R.B. Tripp (1975): <strong>Bering</strong> Strait: <strong>the</strong> Regi<strong>on</strong>al Physical<br />
Oceanography. University ofWashingt<strong>on</strong> Press, 172 pp.<br />
Coachman, L.K. and K. Aagaard (1981): Reevaluati<strong>on</strong> of Water Transp<strong>on</strong>s in <strong>the</strong> Vicinity of<br />
<strong>Bering</strong> Strait. In The Eastern <strong>Bering</strong> <strong>Sea</strong> Shelf: Oceanography and Resources, Volume I,<br />
D.W. Hood and lA. Calder (OOs.), Government Printing Office (dist. by University of<br />
Washingt<strong>on</strong> Press, <strong>Sea</strong>ttle), 95-110.<br />
Kinder, T.H., D.C. Chapman, and J.A. Whitehead, Jr. (1986): Westward intensificati<strong>on</strong> of <strong>the</strong><br />
mean circulati<strong>on</strong> <strong>on</strong> <strong>the</strong> <strong>Bering</strong> <strong>Sea</strong> Shelf. J. Phys. Oceanogr., 16,1217-1229.<br />
Macklin, S.A., RL. Brown, J. Gray, and RW. Lindsay (<strong>1984</strong>): METLffi II - A program library<br />
for calculating and plotting atmospheric and oceanic fields. NOAA Technical Memorandum<br />
ERL PMEL-54, 53 pp.<br />
Mofjeld, H.O. (1986): Observed tides <strong>on</strong> <strong>the</strong> n<strong>on</strong>heastern <strong>Bering</strong> <strong>Sea</strong> Shelf. J. Geophys. Res.,<br />
91 (C2), 2593-2606.<br />
Overland, J.E. and A.T. Roach (1987): Northward flow in <strong>the</strong> <strong>Bering</strong> and Chukchi <strong>Sea</strong>s. J.<br />
Geophys. Res., 92(C7) 7097-7105.<br />
Overland, J.E., R.A. Brown and C.D. Mobley (1980): METLIB - A Program Library for<br />
Calculating and Plotting Marine Boundary Layer Wind Fields. ,NOAA Technical<br />
Memorandum ERL PMEL-20, 82 pp.<br />
Pears<strong>on</strong>, C.A. (1981): Guide to R2D2 - Rapid Retrieval Data Display. NOAA Technical<br />
Memorandum ERL PMEL-29, 148 pp.<br />
Pears<strong>on</strong>, C.A., H.O. Mofjeld, and RB. Tripp (1981): Tides of <strong>the</strong> Eastern <strong>Bering</strong> <strong>Sea</strong> Shelf. In<br />
The Eastern <strong>Bering</strong> <strong>Sea</strong> Shelf: Oceanography and Resources, Volume I, D.W. Hood and<br />
J.A. Calder (OOs.), Government Printing Office (dist. by University of Washingt<strong>on</strong> Press,<br />
<strong>Sea</strong>ttle), 111-130.<br />
Salo, S., J.D. Schumacher, and L.K. Coachman (1983): Winter currents <strong>on</strong> <strong>the</strong> Eastern <strong>Bering</strong><br />
<strong>Sea</strong> Shelf. NOAA Technical Memorandum ERL PMEL-45, 53 pp.<br />
Schumacher, J.D., K. Aagaard, C.H. Pease, and RB. Tripp (1983): Effects of a <strong>shelf</strong>polynya <strong>on</strong><br />
flow and water. properties in <strong>the</strong> nor<strong>the</strong>rn <strong>Bering</strong> <strong>Sea</strong>. J. Geophys. Res., 88(C5),<br />
2723-2732.<br />
13
FIGURES<br />
15
166°W<br />
Figure 1: Locati<strong>on</strong> of Moorings.<br />
16
I-'<br />
,-..J<br />
843371800 to 851820000<br />
843371800 to 851820000<br />
66 30 I I I I < I I I I I 66 30<br />
74<br />
66<br />
66<br />
D.<br />
D.<br />
o<br />
65<br />
65<br />
'+<br />
2 W<br />
33 8 6<br />
1 64 .1 -->r<br />
51'-3+ 12 :<br />
"'"<br />
1:, ~ ... ~~~-.v<br />
.L 64<br />
I<br />
3<br />
., 2~ 28<br />
28<br />
£/~ '-... -J I J"--'"')(<br />
63 1 1 63<br />
14<br />
IS<br />
99t 12<br />
62<br />
ito 1<br />
13 11<br />
1<br />
17<br />
I I I .. I I I<br />
0.0 50.0 100.0 J 0.0 50.0 100.0 l<br />
eH./SEC t 61 30 lel'l/S8f I I I I I t 61. 30<br />
i I I I I I I ~ ~ ~ ~ ~ ~ ~ ~ ~<br />
~~ ~.> ~.> ~.> ~.> ~I'>O
.....<br />
00<br />
843371800 to 851820000<br />
843371800 to 85182000Q<br />
66 30<br />
66 30<br />
66<br />
66<br />
0_<br />
,o<br />
0_<br />
65<br />
65<br />
8 6<br />
12~ :<br />
/I' 12<br />
26- 28<br />
50<br />
64<br />
64<br />
39<br />
15~4<br />
2 3<br />
2 13<br />
24<br />
63<br />
tID 1..,<br />
63<br />
/;><br />
~<br />
12<br />
10 13<br />
5 ~ 20<br />
4 6 29<br />
12 13 8<br />
9*10<br />
8 13 26<br />
0'.0 - S·O. 0 1'00. 0<br />
CM/SEC<br />
/;> /;> /;> /;><br />
.y ~ / 0<br />
8 -*<br />
17<br />
9 16<br />
10<br />
15 1411<br />
/0-:<br />
~<br />
/0-: /;> /;><br />
.y ~ /<br />
/;><br />
, 61 30<br />
o<br />
/o-~ "'0-: "'0 "'0-:
\00.<br />
SO.<br />
0.1---------11l£q...,...<br />
-SO.<br />
-\00.<br />
\00.<br />
SO.<br />
o. J-.tI.-...<br />
-50.<br />
-\00.<br />
100.<br />
SO.I-JJA........<br />
o.<br />
-SO.<br />
-100.<br />
100.<br />
SO·l-....tMt.l)tA:.J..,:lJIA~~.,y..~JlMaMM~HJp.IllwJI~ItI.J,~ ..........,ttI.-.IY--~<br />
o.<br />
-SO.<br />
-100.<br />
1:0:~'" .....,... ~ .,...~....' 4. 'po ... ~8~: ,hi.. ......, b ~<br />
. ,..~ ."__f ~'"1"'t.' r v 'Cr .·'1' ...<br />
-SO.<br />
-100.<br />
1::~ U8404 ~<br />
...,........ ~.,..~ol\o ........"" ....L...~~-.lJiIwj~[I.;.30~l.......t........~~-".... iA1t" ..... ·-"""l_~J...£... ·""'·· ..\ .....'IW~... -....-'..... 'Io!l__....L ṙ ....~Ir......._ ......-- .... _<br />
-SO.<br />
-100.<br />
0.1ot-.v -t'lJiO F1f" if"~t, "11..... F--~'T -- --I' ~, '-PO' h"<br />
100. ~ U8402 ~<br />
SOO' L..JI .... .AMi ,.u. lj. .1• .teA .,l-.. \!,. , ",~.,<br />
. I....." -. I J. ., rr"r N .,.+ f<br />
-SO.<br />
-100.<br />
100.E U8401 j<br />
~2E,:, ::::~::::,: ::,,:::,:~~:::, ::::,:, ~" ~,: ~ :::....:,",."",3<br />
-. ocr NOV DEC JAN FEB MAR APR MAY JUN JUl<br />
<strong>1984</strong> 1985<br />
Figure 3a: Stick vectors of 35-hr filtered currents at near-surface meters, rectified <strong>on</strong> <strong>the</strong>ir principal axes. Every<br />
o<strong>the</strong>r vector is plotted. The <strong>Bering</strong> Strait meter is included for comparis<strong>on</strong> with <strong>the</strong> o<strong>the</strong>r 2 straits; although<br />
it was not a surface meter.<br />
19
j~~:'::=;;::::::~::':::::::'::':::"""'~<br />
,88: Berlng st.<br />
SO.<br />
0.1--------<br />
-SO.<br />
-~~:~ Anadyr Sl ~<br />
-so.<br />
-100.<br />
......-.•L"'H......... JU~-iI-<br />
",.eMe•.'...... d·'<br />
o. ." ' If' ~ I' If<br />
O<br />
~<br />
do<br />
-SO. ,<br />
...L. L.... J~ J. 1 .... _It. • ~ ",fN Sh~~rgJt... _A ~ le.J..;..... ~<br />
·r.~\,." ". rtf' .,.... ... "IJ<br />
-188'<br />
1so' ~ SE Shpanberg St. ~<br />
O<br />
-SO.<br />
• ~U.A"'.!~ ui I1kA'.t.1J1..~" III ••1'.1. .~ .Ai i...... ,_.<br />
· ~.. 't ~ '~~A1.Wl liV..,,,· 'V,.. • iiL<br />
1~~ ~<br />
SO<br />
M8406<br />
· l .............~..~+ ,...•••IIIIL ......."".r'lIr--<br />
_<br />
O. ~,ttIt, 4. " ,<br />
-SO.<br />
-~~o:~, w..<br />
• ,\. 4.J -I:- LAt L Aft •• ' .' .. ~...* W:40~ • ..... _. • •• ~<br />
• • zr i 1(' ~f"', c;,,"" ~ '-qT' • "rr' P Ii. ,_<br />
-SO.<br />
-I~o: ~ t: .t• • *4 L. If..} Ir ..... L .yu*",w:::-.<br />
-so.<br />
m 1 _. •.. ~ I<br />
• .. -wi , ..... i 1t \ .pi r'" < ~ wr - ,. -- if ~ • ..<br />
-188:~ ~~1 ~<br />
_~~ _: ,::~~~:,::~:~ ,:::::~:,::,:::::,:,:•• """, .. I"·,,,,:<br />
· ~ ~ ~ ~ ~ ~ ~ ~ ~ -<br />
<strong>1984</strong> 1985<br />
_b I ' -* ~<br />
-188:~ so.<br />
M8404-b<br />
~<br />
O tl.l..... • - ... It II '''1''- or ... - 'M _.' .L -* d.<br />
-SO.<br />
• 4¥ -h ~4 »"'ICi ..en, ••'< ,. _,-. ,., ;< ~.. - . ,<br />
-I~<br />
SO.<br />
o. ....-,a..rI'7i~~-~~~~~t-W-W..E...-----------------I<br />
-sO.<br />
Figure 3b: Stick vectors of 35-hr fIltered currents at bottom meters, rectified <strong>on</strong> <strong>the</strong>ir principal axes.<br />
20
a ~.~<br />
~~R<br />
... ~ _ :M.. < ~ ." .".<br />
O,wY"" ~ Jl""."9ff'~
N<br />
8408 NI278 O.p140 66 40.00N 168 17.00W HaJor- 350---<br />
Hlnor- 80---<br />
210 Day••tortlng 843371800<br />
lOS I I I I I i<br />
HETWINO 8408 O.pIO 66 40.20N 168 16.80WHoJor- 12---<br />
Hlnor- 102- - -<br />
210 Day••tortlng 843371800<br />
lOS I I I I I<br />
20 dar 20 dar<br />
10 4 I 95%<br />
IO'!<br />
I 95%<br />
10 3 10 3<br />
." ."<br />
0. 0.<br />
Cl<br />
Cl<br />
N<br />
" "<br />
~<br />
N<br />
" It<br />
J\<br />
"<br />
t:<br />
Cl Cl<br />
';' 10 2 ';' 10 2<br />
"'" "'"<br />
10 1 + ~I '.1', ,', \ - . I 1/\ ± 10 1<br />
10 0<br />
10 0<br />
10<br />
-1<br />
,-----. . .<br />
0.00 0.50 1.00 1.50<br />
cycles/day<br />
2.00<br />
2.50<br />
10- 1 I I - 1-' '">tv I<br />
0.00 0.50 1.00 1.50 2.00<br />
cycles/day<br />
Total Var.<br />
Var. > 10 d.<br />
Var. 2-10 d.<br />
Var. 2-5 d.<br />
Tidal Var.<br />
Oi/Semi<br />
869.70<br />
550.64(63.31%)<br />
264.38(30.40%)<br />
152.26(17.51%)<br />
20.25( 2.33%)<br />
0.60<br />
Total Var.<br />
Var. > 10 d.<br />
Var. 2-10 d.<br />
Var. 2-5 d.<br />
76.71<br />
47.92(62.46%)<br />
24.78(32.31%)<br />
14.10(18.38%)<br />
Figure 4a: Spectra, rectified <strong>on</strong> <strong>the</strong> principal axes, of <strong>the</strong> currenl and wind al <strong>Bering</strong> Strail.
1407 HIZ73 Oop.11 64 55.76H In 01.7111 Hojor" 63-<br />
Hlnor" 153---<br />
5 ZIO Ooyo otortlng 143371100 ZO dor.<br />
10 I I I<br />
10 4 I'5J 10 4 I<br />
_HHIIIHO 1407 Oop.O 64 55.IOH 17Z 09.00IlHojor" ZI-<br />
Hlnor" 111- -.<br />
ZIO Ooyo otortlno 143371100 ZO dor<br />
It!' I I I I 1<br />
'5J<br />
10 3<br />
1 .... o<br />
~1I1<br />
) o<br />
~<br />
10 1<br />
,<br />
\<br />
\<br />
\<br />
w\<br />
\<br />
,<br />
"....',<br />
\<br />
,~ , u,<br />
V ~/,<br />
10 4<br />
1 .... o<br />
"'-;111<br />
10 1<br />
JO O<br />
-q<br />
1407 AOS,. 00p.41 64 55.76H 172 01.7111 Hojor" 44-- I'"<br />
"Ino,.. 13'--- ...<br />
210 Ooyo otortlno 143371100<br />
10S-r-,<br />
\,<br />
\<br />
\<br />
"<br />
\<br />
,"<br />
\ \<br />
I 9SJ<br />
N 10 0<br />
W<br />
-I!<br />
....<br />
~ •<br />
10 0 ".00 0·.50 r.Oo r.50 2.00 2.50<br />
cycl../day<br />
Total Var. 628.09<br />
Yare > 10 d. 243.41 (38.75\)<br />
Var. 2-10 d. 195.21(31.08\)<br />
Yare 2-5 d. 100. 71 ( 16.<strong>on</strong> )<br />
Tidal Yare 164.20(26.1n)<br />
Di/Semi 0.32<br />
10 0<br />
• 00<br />
Total Yare<br />
'w....;\/ .<br />
0·. so r. 00 r. so<br />
cycl••/day<br />
var7 > 10 d.<br />
Var. 2-10 d.<br />
Yare 2-5 d.<br />
Tidal Yare<br />
Di/Semi<br />
20 do'<br />
2.00<br />
319.52<br />
135.78(42.50\)<br />
113.00(35.36\)<br />
61.83(19.35\)<br />
54. OJ( 10.94\)<br />
0.55<br />
2.50<br />
..<br />
o<br />
...; 1111<br />
) 1\<br />
~<br />
JO I<br />
liP<br />
-I<br />
10 0.• 00<br />
0·.50 LOO<br />
cycl••/day<br />
Total Var.<br />
Yare > 10 d •<br />
Yare 2-10 d.<br />
Var. 2-5 d.<br />
,,/\ ~.<br />
1.50 2.00<br />
69.78<br />
40.03(57.36\)<br />
25.09(35.96\)<br />
14.67(21.02\)<br />
Figure 4b: Spectra, rectified <strong>on</strong> <strong>the</strong> principal axes, of <strong>the</strong> current and wind at Anadyr Strait.
tv<br />
~<br />
8410 A18Z4 Oep:37 63 16.26N 168 Z5.08W HoJor a 356---<br />
"Inor'" 66 - _.<br />
210 Doya atortlng 843371800 20 dar<br />
105 i I I I I i<br />
"ETWIND 6410 D.pIO 63 16.Z0N 168 Z5.Z0WHoJdr. 353---<br />
Hlnor a 63 - --<br />
ZIO Doye etortlng 643371800 ZO dar<br />
105 i I I I I<br />
10 4<br />
I95% 10 4<br />
I95%<br />
10 3<br />
10 3<br />
"'0<br />
Q.<br />
U<br />
N ......<br />
-; 10 2<br />
......<br />
.:<br />
,<br />
10 0<br />
....<br />
u<br />
\ vv\)<br />
'I ,<br />
10 1 \_ 'I<br />
\ . "<br />
,,\ / ,<br />
\.." I ....,., ..<br />
\ \ I \<br />
" i\ I ,<br />
~ \.<br />
N<br />
"'0<br />
Q.<br />
U ......<br />
';;102<br />
......<br />
.:<br />
...., o<br />
10 1<br />
10 0<br />
10- 1 , I I I I I<br />
0.00 0.50 1.00 1.50 2.00 2.50<br />
cycles/day<br />
10- 1 I I Y). (ID I<br />
0.00 0.50 1.00 .<br />
cycles/day<br />
Total Var.<br />
Var. > 10 d.<br />
Var. 2-10 d.<br />
Var. 2-5 d.<br />
Tidal Var.<br />
oi/Semi<br />
448.74<br />
223.08(49.71%)<br />
117.06(26.09%)<br />
65.26(14.54%)<br />
87.45(19.49%)<br />
0.85<br />
Total Var.<br />
Var. > 10 d.<br />
Var. 2-10 d.<br />
Var. 2-5 d.<br />
73.50<br />
41.60(56.60%)<br />
26.43(35.95%)<br />
15.56("21.17%)<br />
Figure 4c: Spectra, rectified <strong>on</strong> <strong>the</strong> principal axes, of <strong>the</strong> current and wind at 8410, in Shpanberg Strait<br />
' ..
tv<br />
VI<br />
8411 R0603 Deps33 63 57.20N 167 23.25W HaJar- 350----<br />
Hlnar- 80 - _.<br />
210 Daye .tartlng 843371800 20 dar<br />
105 I I I I I I<br />
HETWIND 8411 Dep:O 63 57.00N 167 23.40WHaJar- 344----<br />
Hlnar- 74---<br />
,210 Daye .tartlng 843371800 20 dar<br />
105 I I I I i<br />
10 4<br />
I95% 10 4<br />
I95%<br />
10 3<br />
U<br />
N....<br />
10 3<br />
~<br />
Q.<br />
......<br />
U<br />
'; 10<br />
....<br />
2<br />
II<br />
10 1<br />
10 0<br />
W'''<br />
, ... I., I '<br />
, ro. I<br />
~ '. I<br />
' ..../, I<br />
-I<br />
, I<br />
.... I<br />
'I<br />
~<br />
N<br />
~<br />
Q.<br />
....<br />
U<br />
'; 10<br />
....<br />
2<br />
II<br />
......<br />
U<br />
10 1<br />
10 0<br />
10- 1 1 I I I I I<br />
0.00 0.50 1.00 1.50 2.00 2.50<br />
cycles/day<br />
10-11 I I . r c, -I<br />
0.00 0.50 1.00 1.50 2.00<br />
cyc I.es/day<br />
Total Var.<br />
Var. > 10 d.<br />
Var. 2-10 d.<br />
Var. 2-5 d.<br />
Tidal Var.<br />
Di/Semi<br />
445.76<br />
168.75(37.86%)<br />
144.06(32.32%)<br />
80.51{18.06%)<br />
107.12(24.03%)<br />
3.65<br />
Total Var.<br />
Var. > 10 d.<br />
Var. 2-10 d.<br />
Var. 2-5 d.<br />
74.37<br />
41.67(56.021d<br />
27.08(36.42%)<br />
15.76(21.19%)<br />
Figure 4
IV<br />
0'1<br />
8406 R7490 D.p:15 63 16.92N 171 26.65W HoJor= 97----<br />
Hlnor= 187 -_.<br />
210 Doye etortlng 843371800 20 dor<br />
10 5 I I I I I I<br />
lO't<br />
I 951<br />
HETWIND 8406 D.pIO 63 16.80N 171 26.40WHoJor- 28----<br />
Hlnor" 118 - _.<br />
210 Doye etortlng 843371800 20 dor<br />
10 5 I I I I I<br />
10 4<br />
I 951<br />
10 3<br />
10 3<br />
"'ll<br />
Q,<br />
U<br />
.....<br />
C\I,.... 2<br />
• 10 ..<br />
~ ,..',<br />
u ,<br />
~<br />
\ ....., .<br />
11\,<br />
10 1 \,\/,/V,<br />
\ '.t \'<br />
C\I<br />
"'ll<br />
Q,<br />
u .....<br />
'; 10<br />
.....<br />
2<br />
IE<br />
....<br />
U<br />
10 1<br />
10 0<br />
10- 1 , I I I I --+<br />
0.00 0.50 1.00 1.50 2.00 2.50<br />
cycles/day<br />
Total Var. 1148.29<br />
Var. > 10 d. 423.48(36.88%)<br />
Var. 2-10 d. 346.37(30.16%)<br />
Var. 2-5 d. 220.09( 19.17%)<br />
Tidal Var. 294.95(25.69%)<br />
Di/Semi 0.15<br />
10 0<br />
10- 1 1 I I v 1 ' £), " I<br />
0.00 0.50 1.00 1.50 2.00<br />
cycles/day<br />
Total Var.<br />
Var. > 10 d.<br />
Var. 2-10 d.<br />
Var. 2-5 d.<br />
69.87<br />
39.20(56.10%)<br />
25.54(36.56%)<br />
14.94(21.38%)<br />
Figure 4e: Spectra, rectified <strong>on</strong> <strong>the</strong> principal axes, of <strong>the</strong> current and wind at 8406, south of St. Lawrence Island
!j<br />
N<br />
6403 R7465 O.p:16 63 14.62N 171 33.40W HOJor m 139---<br />
Hlnor" 229---<br />
210 Ooye etortlng 643371600 20 dar<br />
105 I I I I I I<br />
HETWJNO 6403 OSPIO 63 14.40N 171 33.60WHoJor m 21---<br />
HI nor= 111 - - .<br />
210 Ooye etortlng 643371600 20 dor<br />
lOS I I I I I<br />
10 4<br />
I951<br />
I 951 10 4<br />
10 3 10 3<br />
"'II<br />
a.<br />
.....<br />
o<br />
-; 10 2<br />
.....<br />
II<br />
--<br />
o<br />
10 1<br />
N<br />
"'II<br />
a.<br />
.....<br />
o<br />
-; 10<br />
.....<br />
2<br />
II<br />
o<br />
--<br />
10 1<br />
10 0<br />
10- 1 I I I I I<br />
0.00 0.50 1.00 1.50 2.00 2.50<br />
cycles/doy<br />
10 0 ..<br />
I Y4 1'1 \<br />
10- 1 I I - .. "<br />
I<br />
0.00 0.50 1.00 1.50 2.00<br />
cycles/doy<br />
Total Var.<br />
Var. > 10 d.<br />
Var. 2-10 d.<br />
Var. 2-5 d.<br />
Tidal Var.<br />
Oi/Semi<br />
191.36<br />
22.43(11.72%)<br />
49.56(25.90%)<br />
37.62(19.66%)<br />
79.99(41.80%)<br />
o. 15<br />
Total Var.<br />
Var. > 10 d.<br />
Var. 2-10 d.<br />
Var. 2-5 d.<br />
70.28<br />
39.58(56.31%)<br />
25.46(36.22%)<br />
14.95(21.27%)<br />
Figure 4f: Spectra, rectified <strong>on</strong> <strong>the</strong> principal axes, of<strong>the</strong> current and wind at 8403, south of St. Lawrence Island.
140. 117416 Do"ZO 63 09.ZI11 171 36.3711 "aJar- 138-<br />
"Inor- ZZ8---<br />
ZIO 00'0 otort Inl 8.3371800 ZO dar<br />
I~i I I I I i<br />
"ETIIIIID ••0. 110,,0 63 09.0011 171 36.601l"oJor- ZZ-<br />
"Inor- IIZ·--<br />
ZIO 00'0 otortlnl 8.3371800 ZO dar<br />
laS t I I I i<br />
10' I 951 10' I 951<br />
" 0.<br />
....<br />
a<br />
NO; III<br />
....<br />
•<br />
~<br />
lit'<br />
10 1<br />
8'0' 117.88 00,,30 63 09.ZI11 171 36.3711 "oJor- 119-- lit'<br />
ft1 nor- 20'- - -<br />
zio 00'0 otortlnl 843371800' ZO dor<br />
I~i I I I I i<br />
10'<br />
I 951<br />
" 0.<br />
....<br />
a<br />
NO; III<br />
.... • a-<br />
10 1<br />
\,<br />
Ia'<br />
N 00<br />
10 0 "<br />
lIP<br />
....<br />
a<br />
0.<br />
NO; III<br />
.}<br />
10- 1 , I I I I I<br />
10-11 I I '" ' ); 'e.j<br />
0.00 0.50 1.00 1.50 2.00 2.50 ~<br />
0.00 0.50 1.00 1.50 2.00<br />
cycl••/day<br />
cycl••/day<br />
10 1<br />
Total Var. 317 .62<br />
Total Var.<br />
Var.<br />
70.16 ,<br />
> 10 d. 43. 72( 13.76\)<br />
·Var. ><br />
99.36
8.01 NIZ77 Oop,ZO 6Z 05.56H 169 I6.Z8N HOJo,,· Z.-<br />
"Inor.- 114---<br />
ZIO OOy••to,..tln8 843371100 ZO dar<br />
laS I I I I I i<br />
HETNIHO 8.01 Oop.O 6Z 05••0N 169 I6.Z0NHoJo". 6--<br />
"rnO,.- 96- --<br />
ZIO Ooy. eto,.tl". 8.3371800 ZO Jar<br />
Ir l' I I I i<br />
10·+ I 951<br />
10·+ I 951<br />
...<br />
103<br />
tv \0 liP<br />
a. I<br />
a, . ~<br />
Ii<br />
N-;<br />
, lal .<br />
'/'<br />
a \<br />
~<br />
10 1 \,..", '(. , I<br />
I,<br />
,<br />
\·~·l I • 1,..<br />
10- 1 I I I I I<br />
0.00 0.50 1.00 1.50 2.00 2.50<br />
cycl••/day<br />
Total Var.<br />
Var. > 10 d.<br />
Var. 2-10 d.<br />
Var. 2-5 d.<br />
Tidal Var.<br />
Di/Semi<br />
.17.36<br />
.6.10(11.05\)<br />
79.61(19.08\)<br />
52.87(12.67\)<br />
271.69(65.10\)<br />
0.2.<br />
,~<br />
,I<br />
,<br />
8.01 Il3tH 0.p.35 60 05. SOH<br />
169 16. ZON HoJo".<br />
K'ftor-<br />
ZIO Ooy••to,.t,''. 8.3371100 ZO dar<br />
laS 1 , I I I I<br />
10·+ I 951<br />
III'<br />
10 1<br />
loG<br />
10-' I I I I I<br />
0.00 0.50 1.00 1.50' 2.00 2.50<br />
cycl••/day<br />
I, ,<br />
"<br />
I<br />
,I<br />
J<br />
,I<br />
,I<br />
zz-- III'<br />
liZ - _. ...<br />
:-<br />
N' ';IIJ<br />
f<br />
~,<br />
, I<br />
a<br />
~<br />
10 1<br />
10 0<br />
10- 0<br />
'.00<br />
0'.50 1'.00<br />
cycl••/day<br />
Total Var.<br />
Var. > 10 d.<br />
Var. 2-10 d.<br />
Var. 2-5 d.<br />
71.72<br />
39.02(5•••0\)<br />
26.8t(37••2\)<br />
15.15(21.12\)<br />
Total Var.<br />
Var.> 10 d.<br />
Var. 2-10 d.<br />
Var. 2-5 d.<br />
Tidal Var.<br />
Di/Semi<br />
320. U<br />
.2.50(13.28\)<br />
75.U(23.63\)<br />
U.2.(15.38\)<br />
172 ••1(53.86\)<br />
0.36<br />
Figure 4h: Spectra, rectified <strong>on</strong> <strong>the</strong> principal axes, of <strong>the</strong> current and wind at 840I, south ofSt Lawrence Island.<br />
I
V.)<br />
o<br />
a 210 Days starting 843371800 10 dora<br />
-0 .....<br />
.....<br />
Q)<br />
---- ~ ~r......... ~f;,·.~ .<br />
L<br />
o \ ...-., ":'{ '. r-..... ..'. /<br />
'1 ".\.<br />
:J<br />
I . \ "J ,. "..-f'<br />
1 1\ I '\' "'\ x.<br />
o'lX) , I \ J ! \.... ~.J... .... \ /.....,.... v .' Ia:<br />
(J) •<br />
a \ / V j \/ ....J v " to<br />
Q)<br />
o c<br />
'\ I :.....: V<br />
Q)<br />
V. :'. :<br />
-.. : ",,"<br />
.... ,<br />
L-o<br />
-0<br />
a>.<br />
..co<br />
o<br />
o<br />
0-<br />
....<br />
.<br />
00<br />
10.0 5.0 3.3<br />
PERIOD (days)<br />
Period<br />
70.00<br />
26.25<br />
16. 15<br />
11.li7<br />
9.13<br />
7.50<br />
6.36<br />
5.53<br />
4.88<br />
4.38<br />
3.96<br />
3.62<br />
3.33<br />
3.09<br />
2.88<br />
2.69<br />
2.53<br />
Vertical Coherences:<br />
8407____ 8404----<br />
.99>(-25)<br />
.97><br />
.98><br />
.97<br />
.99<br />
.98<br />
.96<<br />
.95<<br />
1.0«2)<br />
.99(3)<br />
.92<<br />
.97<<br />
.94<<br />
.94<<br />
.93<<br />
.92<<br />
.97«(3)<br />
.97><br />
.68<br />
.90<br />
.81<<br />
.90(-13)<br />
.93<br />
.93><br />
.70<<br />
.97<br />
.94<br />
.93<br />
.80<<br />
.91<<br />
.90<br />
.84<<br />
.86<<br />
.91<<br />
2.5<br />
8401 •••.<br />
.95><br />
.68<br />
.66<br />
.63<<br />
.75<br />
.67<<br />
.90(8)<br />
.86<br />
.83<<br />
.78<<br />
.95><br />
.94«5)<br />
.80«6)<br />
.87<<br />
.92<br />
.85«4)<br />
.91<<br />
Figure 5a: Significant vertical coherence at periods greater than 60 hours. Currents were rectified <strong>on</strong> <strong>the</strong>ir principal axes. Data presented in <strong>the</strong> table are <strong>the</strong><br />
coherence squared and <strong>the</strong> phase difference in hours. A positive lag means that <strong>the</strong> top (or first-listed) meter leads <strong>the</strong> bottom (or sec<strong>on</strong>d-listed) meter.<br />
Ifno lag is given, it was not significantly different from 0'. A * indicates that <strong>the</strong> phase lag was not significantly different from ±180·. The symbols><br />
and » mean that more than 10% or 20% of <strong>the</strong> cross-variance was present at that period; while < and «indicate that less than 5% or 1% of <strong>the</strong><br />
cross-variance was present.
o 210 Days stadlng 843371800 10 dab 0 210 Day.s stadlng 843371800 10 daro<br />
-0-: -: -0-: I I I I f -:<br />
Ql Ql<br />
L L<br />
a A a<br />
~ /" ~<br />
~~ / \ /\ ~ ~ ~~+ '\ I\ I \ I i \ I \/ +~<br />
~ I \ I ~<br />
C I \ /' I c<br />
Ql '" \ \i:: Ql<br />
;~ '..... .... yl ...... \ ~ ;~ I V \ I if \\ I I ~<br />
..co. .:.' 0 ..cot ./ I . to<br />
o ..... 0<br />
o ',:' Q.<br />
co 10.0 co 10.0 5.0 3.3 2.5<br />
PERIOD (days)<br />
~ 8408 with: Shp.anberg and. Anadyr Straits<br />
Period 8407 -- 8410---- 84'11 •••• Period 8410-8411 - 8407-8410-- 8407-8411<br />
••<br />
70.00 ---- .63» .55» 70.00 .94»<br />
26.25 .64» .83» .66» 26.25 .90»<br />
16.15 .72> .90> .66> 16.15 .82<br />
11.67 ---- .84 .54 11.67 .59<br />
9.13 ---- .60 .63 9.13 .97(9)<br />
7.50 ---- .72< 7.50 ----<br />
6.36 .53< .67< .59< 6.36 .60<<br />
5.53 ---- .84< .69< 5.53 .95<<br />
4.88 .73< .73< 4.88 .75<<br />
4.38 .74 4.38 .73«<br />
3.96 .83
. · -0":1 I I I I":<br />
0<br />
2LO D~ys starting 843371800 LO dab 0 210 Day~ starting 843371800 10 dolO<br />
-0 ...... ......<br />
Q) Q)<br />
L L<br />
a a<br />
:J :J<br />
a'ec ec<br />
CIl •<br />
·<br />
a'co+ I' '\<br />
f,\ +~<br />
0 0<br />
COo \<br />
I 1\\<br />
Q) Q).<br />
0 e 0<br />
c·<br />
al Q)<br />
L-o Q) • ..co -0 L-o<br />
Q) •<br />
•<br />
0 ..co<br />
0 0<br />
0 ().<br />
00 00<br />
w SSL with sou<strong>the</strong>rn straits<br />
IV Stati<strong>on</strong>s South of St. Lawrence<br />
8407-8404 8410-8404-- 8411-8404.. 8403-8404__ 8406-8404-~ 8404-8401 ••<br />
Period --<br />
Period<br />
70.00 .54> ---- ---- 70.00 .53> .82» .64»*<br />
26.25 ---- ---- ---- 26.25 .54<br />
16.15 ---- ---- ---- 16.15 .56 .75<br />
11.67 ---- ---- ---- 11.67 .64«52)<br />
9.13 .63 ---- ---- 9.13 .70<br />
7.50 ---- ---- ---- 7.50 .75 ---- ;----<br />
6.36 .60 .74(47) ---- 6.36 .60 .75(-14)<br />
5.53 .71«-12) ---- ---- 5.53 ---- .69< .64(51)<br />
4.88 ---- ---- ---- 4.88 .62 .83(-12)<br />
4.38 .63> ---- ---- 4.38 ---- .87<<br />
3.96 .74< .88(41) .85>* 3.96 .80 .84 .67>*<br />
3.62 .60< ---- ---- 3.62 .79«7) .65<<br />
3.33 ---- .64«31) ---- 3.33 .65< .69«-9) .71
~<br />
~<br />
o 110 Doyo otortl"g 843371800<br />
-0":1 I I 1<br />
CD<br />
L<br />
o:J<br />
10 do~<br />
o Z\O Doy. otort'"9 B~3371800 \0 do~<br />
-0": I I I I I<br />
CD<br />
L<br />
o :J<br />
0'>><br />
16.15<br />
11.67<br />
9.13<br />
7.50<br />
6.36<br />
5.53 .73<<br />
4.88 .73~<br />
4. 38<br />
3.96<br />
3.62 .65<<br />
3.3J<br />
3.09<br />
2.88<br />
2.69<br />
2.53<br />
'Wind at 8407<br />
W.axis 028 W.axis 340----<br />
a 210 Cays starting 643371600 10 dora a 210 Cays starting 643371600 10 dora<br />
. .<br />
""C- ""C-<br />
Ol -<br />
Ol<br />
L L<br />
0 0<br />
:J :J<br />
o'co co o'co<br />
,... .,<br />
\ I .<br />
(I). (I) •<br />
a a a . \<br />
Ol Q)<br />
0 0 . \ A ,. .<br />
c c<br />
Q)<br />
\ I<br />
Ol<br />
J \\i<br />
\<br />
L-o<br />
-0 L-o<br />
Ol • ;"'n . Ol • \<br />
i<br />
~<br />
...co -q a .co<br />
0<br />
0 \<br />
j / 1 oc;~ \<br />
o· (J.<br />
0Cl 10.0 5.0 3.3 .2.5 0Cl<br />
PERIOD (days)<br />
\<br />
+:<br />
w Wind at 8403 and 8404<br />
+:-. Wind at 6406 and 6401<br />
8403 8404---- 6404 .... 8406 8406---- 6401. .•• 6401<br />
W.axis 300 W.axis 22 W.axis 50 W.axis 28 w.axis 90 W.axis 6 w.axTs-300<br />
Period Period<br />
70.00 ---- ---- ---- 70.00 ---- .76»> ---- .77»<br />
26.25 ---- ---- ---- 26.25 ---- ---- ---- .64><br />
16.15 .63>(133) ---- ---- 16.15 ---- ---- ---- .63><br />
11 .67 ---- ---- ---- 11 .67 ---- ---- ---- .69<<br />
9.13 ---- ...,.--- ---- 9.13<br />
7.50 ---- ---- ---- 7.50 ---- ---- .56«26)<br />
6.36 ---- ---- ---- 6.36<br />
5.53 .53* ---- ---- 5.53 ---- ---- .59(16) .56<br />
4.88 ---- ---- .64 4.86 ---- .60 .55«22)<br />
4.38 ---- .70(10) .66 4.38 .82>(45) .62«13)<br />
3.96 ---- ---- ---- 3.96 ---- .68(13) ---- .64<br />
3.62 ---- ---- ---- 3.62 .55(26) ---- ---- .54«19)<br />
3.33 ---- ---- ---- 3.33<br />
3.09 ---- ---- ---- 3.09<br />
2.68 .72* ---- ---- 2.68 ---- ---- .64< .73<<br />
2.69 ---- ---- ---- 2.69 ---- ---- .67<<br />
2.53 ---- ---- .56«15) 2.53 ---- .55«10)<br />
Figure 5e: Significant coherence of MElLIB winds with meters south of St.Lawrence Island. See figure 5a.
842821800 to 850010000<br />
842821800 to 850010000<br />
66 30<br />
66 30<br />
o.<br />
66<br />
66<br />
o.<br />
65<br />
65<br />
w<br />
VI<br />
7_<br />
't'<br />
38 "'k' '>.38 ~ I<br />
I I<br />
55 18<br />
II' 7<br />
18 23 Jl 12.<br />
2.<br />
32<br />
8<br />
9 18<br />
I~ U lO* 3<br />
9.# 13<br />
I 8& I _ 32<br />
~8_0'<br />
I il<br />
I I I , I I I<br />
0.0 50.0 100.0 0.0 50.0 100.0<br />
CM/SEC t 61 30<br />
./,,> ~,,> ./,,> ./,,> ./,,> ./,,> ./~ ./~ ./cr ./0: ./,,> .> ./,,> ./,,> ./,,> ./,,> ./~ ./0: ./cr ./0:<br />
.s ~ .; ~ ./ 0 'S)<br />
'6> :.> cr .s ~ .; ~ ./ 0 'S)<br />
'6> ,,> cr<br />
Figure 6a: <strong>Sea</strong>s<strong>on</strong>al current roses and summary vectors for near-surface meters: frrst ninety days. In figures 6a and 6e, <strong>the</strong> roses and summary vectors in <strong>the</strong> box<br />
6~<br />
4- 64<br />
L<br />
63 .L 63<br />
1.6 21 10 _ 5<br />
62 .L 62<br />
are from <strong>the</strong> top meters at 8403 and 8404.<br />
Ci'l/S8<br />
t 61 30
w<br />
0\<br />
842821800 to 850010000<br />
66 30 842821800 to 850010000<br />
I I I I," I<br />
66 30<br />
o.<br />
66<br />
66<br />
o.<br />
6S<br />
65<br />
-I- - ' ./ _ 27 "JI' 2 64<br />
t 64<br />
37 >V<br />
7_<br />
.h --:~. ~<br />
o 18 3<br />
Sf 2 I<br />
I<br />
,*<br />
16 18 Z6 9, 22 S II S - 8<br />
9<br />
27<br />
9*~ 20:*,\<br />
IL<br />
' 31 8 Z3 1.8 8 16 2S<br />
7<br />
I I<br />
0.0 50.0<br />
CM/SEC<br />
8<br />
II<br />
t<br />
63 l. 63<br />
~~:O 8~<br />
~8'0_<br />
10 7 6<br />
I I<br />
1 1 00.0<br />
. I ,<br />
t<br />
t<br />
tOI<br />
t.<br />
62 l. 62<br />
0.0 50.0 100.0<br />
61 30<br />
clII/sec<br />
.r;> .r;> .r;> .r;> .r;> .r;> .ro- .ro: .ro- .ro: .r;> .r;><br />
oS'<br />
.r;> .r;> .r;><br />
# .; .ro: .ro:<br />
~ .r 0 .!> 61 ;> .ro-<br />
0-<br />
.ro:<br />
# .; ~ .r 0 S)<br />
61 ;><br />
0-<br />
t<br />
61 30<br />
Figure 6b: <strong>Sea</strong>s<strong>on</strong>al current roses and summary vectors for bottom meters: first ninety days. The current roses in <strong>the</strong> box are from,in order, 8403, <strong>the</strong> mid-depth<br />
8404 meter, and <strong>the</strong> bottom meter at 8404.
850061800 to 850910000<br />
850061800 to 850910000<br />
66 30<br />
66 30<br />
o.<br />
61<br />
66<br />
o.<br />
66<br />
65<br />
65<br />
111<br />
12 16<br />
I I I<br />
0.0 50.0 100.0<br />
CM/SEC<br />
10*, 10<br />
13 16<br />
9<br />
,<br />
t<br />
62 ~01 .1.. 62<br />
61 30<br />
I I I<br />
0.0 50.0 100.0<br />
c",/sec<br />
./,,> ./,,> ./,,> ./,,> ./,,> ./~ ./0: ./0- ./~ ./,,> ./,,> ./,,> ./,,> ./,,> ./~ ./0: ./0- ./~<br />
.; a ~ ./ 0 :.0 ~ ,,> 0- .; a ~ ./ 0 :.0 ~ ,,> 0-<br />
t<br />
61 30<br />
Figure 6c: <strong>Sea</strong>s<strong>on</strong>al current roses and summary vectors for near-surface meters: sec<strong>on</strong>d ninety days.
w<br />
00<br />
850061800 to 850910000<br />
66 30 850061800 to 850910000<br />
I I I h: I<br />
66 30<br />
61<br />
o.<br />
66<br />
66<br />
o.<br />
65<br />
65<br />
t<br />
1*.2.6~6S<br />
4- 64 -l- ~<br />
.Ie STRESS-l0<br />
..L 64<br />
0 1 .0<br />
46<br />
7+" " t.1O<br />
. ,,~. 63<br />
3. 0 2 2<br />
6 29<br />
11 13 10<br />
2 9*14- 2A<br />
9*12<br />
4- 4- 36 10 21<br />
50.0<br />
eM/SEC<br />
I<br />
17<br />
11 IS<br />
16<br />
I I<br />
8~ X·<br />
\"<br />
.L 63<br />
IS 62<br />
8*11 iOI<br />
.L 62<br />
12 17 9<br />
1 1 00.0<br />
, I I I<br />
t<br />
61 30<br />
0.0 50.0 100.0<br />
c",/se<br />
.?,,> .?,,> .?,,> .?,,> .?,,> .?~ '?(T '?(T<br />
.; .?~ .?,,> .?,,> .?,,> .?,,> .?,,> .?~ '?(T '?(T<br />
a<br />
.?~<br />
~ .? 0 '$)<br />
61 :> (T .; a ~ .? 0 '$)<br />
61 :> (T<br />
t<br />
61 30<br />
Figure 6d: <strong>Sea</strong>s<strong>on</strong>al current roses and summary vectors for bottom meters: sec<strong>on</strong>d ninety days. See figure 2b.
~50961800 to 851810000<br />
66 30 850961800 to 851810000<br />
I I I I I<br />
66 30<br />
o.<br />
66<br />
66<br />
o.<br />
8<br />
65<br />
65<br />
31<br />
1 5 7 5<br />
W<br />
\0 .l- L 10:* 4 64<br />
1 66 20 19<br />
o 0 _ 30<br />
t + 8~ STRESS.l0<br />
;t; .L 64<br />
21<br />
"",<br />
9 3 1"<br />
"-<br />
rJ I<br />
63 I<br />
'U<br />
t63<br />
17 20 13 7<br />
5 14<br />
• 5*7<br />
8~ ~4<br />
16 14<br />
22<br />
I I<br />
1 '*. 13<br />
8 16 7<br />
3 7 35 4 13 30 8 t 14<br />
1 I I . I I<br />
0.0 50.0 100.0<br />
eM/SEC<br />
t<br />
62 +1<br />
.L 62<br />
0.0 50.0<br />
61 30 c/II/sec<br />
.r.,> .r.,> .r.,> .r.,> .r.,> .r.,> .reT. .ro: .r0" .ro:<br />
oS .r.> .r.,> .r.,> .r.,><br />
~ ,j .r.,><br />
~ .r 0 'SJ (Sl .,> 0"<br />
.r.> .reT .ro: .r0" .ro:<br />
oS ~ ,j ~ .r 0 'SJ (Sl .,> 0"<br />
1 1 00. a<br />
t<br />
61 30<br />
Figure 00: <strong>Sea</strong>s<strong>on</strong>al current roses and summary vectors for near-surface meters: third ninety days. See figure 00.
~<br />
+<br />
0<br />
850961800 to 851810000<br />
850961800 to 851810000<br />
66 30<br />
66 30<br />
66<br />
o.<br />
o.<br />
66<br />
8<br />
65<br />
65<br />
3 89 S 7 S<br />
1.0=*'<br />
l¥S ao 1.9<br />
30<br />
• 64<br />
t t 8~<br />
X<br />
STRESS-10<br />
.L 64<br />
47<br />
18+ 5<br />
4 34<br />
2 1322<br />
10 i<br />
tHO<br />
2 63 1- 63<br />
3 4<br />
2 12<br />
22<br />
\411<br />
7 18 14<br />
8 16 9<br />
I I<br />
7 ~ 16 7 ~ 9 8 13 15 841 8W<br />
4 9 24 7 14 29<br />
7 *' 10<br />
20 +8401<br />
14<br />
13 62 .l 62<br />
,<br />
I I I I I I<br />
0.0 50.0 100.0<br />
0.0 50.0 100.0<br />
CM/SEC t cm/sec<br />
61 30<br />
t 61 30<br />
?.;:. ?.;:. ?.;:. ?.;:. ?.;:. ?(T ?cr ?cr ?cr ?.;:. ?.;:. ?.;:. ?.;:. ?.;:. ?cr ? ~ ? 0<br />
:!)<br />
6> .> 0- ~ J> ~ ? 0 ~ 6> .> 0-<br />
Figure 6f: <strong>Sea</strong>s<strong>on</strong>al current roses and summary vectors for bottom meters: fIrst third days. See fIgure 2b.
TABLES<br />
41
Table I: Deployment informati<strong>on</strong> <strong>on</strong> <strong>the</strong> APEX 85 moorings. The letter N before a current meter number signifies that <strong>the</strong> meter was a Neil Brown<br />
meter, and <strong>the</strong> letter A means that <strong>the</strong> meter was an Aanderaa meter. All Neil Brown meters took 10 min averaged data, while <strong>the</strong> Aanderaas<br />
recorded hourly data. The depth ofwater at mooring 8408 is uncertain, as <strong>the</strong> mooring was deployed via helicopter. Meters NII68 and NI169<br />
malfuncti<strong>on</strong>ed for a period in January, as is shown below.<br />
MOORING/METER DEPTII LAT LONG FIRST RECORD LAST RECORD ICE COVER<br />
METER WATER ON oW (ill) (ill)<br />
Moorings in <strong>the</strong> Straits:<br />
8408/N1278 40 50 65.67 168.28 843342300 851861630 84318-85169<br />
8407/N1273 18 58 63.93 172.15 842781000 851880340 84346-85162<br />
8407/A0598 48 " " " 842781100 851880200 "<br />
841O/N1276 22 42 63.27 168.42 842771600 851482040 84353-85169<br />
8410/A1824 37 " " " 842771600 851851000 "<br />
8411/A0603 33 38 62.9 167.39 842771200 851850600 84360-85169<br />
~<br />
N<br />
Moorings south of St. Lawrence Island:<br />
8406/A7490 15 37 63.28 171.44 842780700 851870500 84346-85162<br />
8406/A7491 30 " " " 842780700 850770300 "<br />
8403/N1168 10 25 63.24 170.56 842772300 850152330 84346-85162<br />
850282200 851870430<br />
8403/A7485 18 " " " 842780100 851870400 "<br />
8404/N1169 10 37 63.15 170.61 842780000 850161020 84346-85162<br />
850240300 851870510 "<br />
8404/A7486 20 " " " 842780200 851870600 "<br />
8404/A7488 30 " " " 842780300 851870500 "<br />
8402/N1261 10 37 62.89 169.75 842771900 850800340 85001-85169<br />
8402/A3185 30 " " " 842772300 850580100 "<br />
8401/N1277 20 40 62.09 169.27 842770200 851842330 85015-85162*<br />
8401/A3614 35 " " " 842770300 851850000 "<br />
* 8401 was ice-covered intermittantly from 85015-85043
Table 2: Statistical data <strong>on</strong> currents and <strong>on</strong> METLffi winds. Currents are 35-hr filtered. Statistics were run for <strong>the</strong> pre-filtered<br />
period .OOסס843360000-85184<br />
MOOR/MET BAlli AXIS OF %OF VECfOR MEAN SCALAR<br />
AXIS GRTST VARON SPEED DIR SPEED<br />
°T VAR AXIS crn/s °T crn/s<br />
8408 at40m 350 350.4 97.70 26.84± 3.87 03.5 34.3<br />
8407 at 18 m 25 242.9 88.65 25.31 ± 2.76 69.2 29.8<br />
8407 at 48 m " 44.2 85.65 20.48 ± 1.88 54.6 23.9<br />
8410 at 37 m 350 355.5 97.52 8.39± 2.80 356.2 16.0<br />
8411 at 33 m 345 350.4 96.00 4.72±2.28 358.5 14.7<br />
8406 at 15 m 290 276.8 97.54 6.19 ± 3.38 126.0 25.0<br />
8403 at 18 m 310 319.3 73.11 2.85 ±0.6O 89.0 7.5<br />
8404 at 20m 300 318.4 73.58 0.91 ± 1.02 160.5 9.8<br />
8404 at 30m " 298.5 70.43 1.69±0.57 200.0 7.8<br />
~<br />
VJ<br />
8401 at 20m 15 24.1 73.78 1.42 ± 1.16 14.1 8.9<br />
8401 at 35 m " 21.9 68.79 1.88 ± 1.00 2.8 8.7<br />
MElLffiWINDS<br />
8408 11.9 68.53 5.29 ± 2.78 215.4 9.1<br />
8407 28.4 61.59 5.41 ± 2.63 215.1 8.8<br />
8410 353.1 58.49 4.18 ± 2.13 223.5 8.6<br />
8411 343.9 59.83 3.69 ± 1.97 228.0 8.5<br />
8406 28.1 59.02 5.01 ± 2.46 216.3 8.7<br />
8403 20.7 57.70 4.79 ± 2.37 217.9 8.6<br />
8404 21.6 57.56 4.75 ± 2.36 217.9 8.6<br />
8402 10.6 56.35 4.36± 2.23 220.5 8.5<br />
8401 5.8 55.21 3.68 ± 2.09 224.4 8.3
Table 3: Lagged Linear Correlati<strong>on</strong>s. Meters were correlated for <strong>the</strong> pre-filter period (84336-85184). To more easily understand <strong>the</strong> signs of <strong>the</strong> coefficients.<br />
currents were reCtified <strong>on</strong> <strong>the</strong>ir axis of greatest variance or its inverse. whichever was northward or eastward. AU coefficients listed are significant;<br />
comparis<strong>on</strong>s which were not significant are indicated by ---. Data presented are <strong>the</strong> highest correlati<strong>on</strong> coefficient of 04 lags. and <strong>the</strong> lag at which <strong>the</strong><br />
highest correlati<strong>on</strong> occurred. The data were 35-hr filtered; <strong>the</strong>refore 1 lag corresp<strong>on</strong>ds to 6 hours. Column lags row. Wind 1 refers to wind <strong>on</strong> its<br />
principal axis. Wind 2 is <strong>the</strong> wind <strong>on</strong> <strong>the</strong> axis which accounted for <strong>the</strong> highest percent variance of <strong>the</strong> current<br />
8408 8407 8407 8410 8411 8406 8403 8404 8404 8401 8401<br />
40m 18m 48m 37m 33m 15m 18m 20m 30m 20m 35m<br />
8408 at40m<br />
MM/\<br />
0.54/0 0.52/0 0.77/0 0.6610 -0.24/0 ---/0 ---/3 ---/0 0.4610 0.44/0<br />
8407 at 18 m 0.54/1<br />
MMI\<br />
0.98/0 --/4 ---/0 0.39/0 ---/4 0.49/0 0.44/0 -0.20/0 ---/0<br />
8407 at 48 m 0.52/0 0.98/0<br />
MM/\<br />
---/4 ---/0 0.39/0 ---/4 0.49/0 0.4610 -.21/0 -.1610<br />
8410 at 37 m 0.77/0 ---/0 ---/2<br />
MMI\<br />
0.89/0 -0.64/0 -0.24/0 -0.33/0 -0.39/0 .76/0 .71/0<br />
8411 at 33 m 0.66/0 ---/0 ---/0 0.89/0<br />
MI\M<br />
-0.6410 -0.22/0 -0.32/0 -0.37/0 .79/0 .77/0<br />
8406 at 15 m -0.27/2 0.39/0 0.39/0 -0.65/1 -0.67/1<br />
MMI\<br />
0.41/0 0.70/0 0.67/0 -.71/0 -.66/0<br />
t 8403 at 18 m -0.16/1 ---/3 0.15/3 -0.27/1 -0.26/2 0.47/1<br />
MMI\<br />
0.68/1 0.66/1 -.38/0 -.37/0<br />
8404at20m ---/0 0.49/1 0.51/1 -0.36/1 -0.37/2 0.73/1 0.68/0<br />
MMI\<br />
0.93/0 -.53/0 -.49/0<br />
8404 at 30m ---/3 0.44/1 0.47/1 -0.42/1 -0.42/2 0.71/1 0.65/0 0.93/0 MMI\<br />
-.55/0 -.48/0<br />
8401 at 20 m 0.52/2 -0.21/1 -0.21/1 0.81/1 0.85/1 -0.73/1 -0.38/0 -0.53/0 -0.55/0<br />
MMI\<br />
.90/0<br />
8401 at 35 m 0.47/1 -0.17/1 -0.16/0 0.73/1 0.80/1 -0.66/0 -0.37/0 -0.49/0 -0.48/0 .90/0<br />
MMI\<br />
Correlati<strong>on</strong> with wind<br />
8408 8407 8407 8410 8411 8406 8403 8404 8404 8401 8401<br />
40m 18m 48m 37m 33m 15m 18m 20m 30m 20m 35m<br />
Wind1 -.66/1 -.53/1 -.49/1 -.62/1 -.72/2 -.30/3 .20/4 -.23/2 ---/2 -.38/0 -.34/0<br />
Wind2 -.77/1 -.55/1 -.53/1 -.77/2 -.76/2 -.62/2 .31/0 -.36/1 -.30/1 -.66/1 .44/2
Table 4: Percent Associated Variance; % ofVariance ofRow associated with Column. Currents are 35-hr. fJItered.<br />
8408 8407 8407 8410 8411 8406 8403 8404 8404 8401 8401<br />
40m 18m 48m 37m 33m 15m 18m 20m 30m 20m 35m<br />
8408 at40m<br />
MM/\<br />
39.94 37.08 72.77 53.09 3.53 5.73 2.64 4.03 18.88 1.98<br />
8407 at 18 m 34.80<br />
MM/\<br />
97.64 0.85 2.24 6.84 1.50 25.62 25.23 2.19 0.73<br />
8407 at 48 m 32.62 97.62<br />
MM/\<br />
0.86 2.60 5.61 10.92 24.70 26.23 1.61 0.00<br />
~<br />
VI<br />
8410 at 37 m 70.93 4.06 3.34<br />
1\1\I\I\I\<br />
82.36 33.89 14.74 8.64 8.83 75.00 40.34<br />
8411 at 33 m 53.05 9.00 7.77 84.01<br />
1\1\I\I\I\<br />
35.73 11.10 11.48 8.48 81.05 65.07<br />
8406 at 15 m 7.66 6.61 5.82 42.23 43.47<br />
1\1\I\I\I\<br />
12.65 59.38 59.54 67.86 53.86<br />
8403 at 18 m 6.33 4.84 6.97 12.55 11.17 18.56<br />
1\1\I\I\I\<br />
60.28 53.39 11.33 13.74<br />
8404 at 20m 8.36 30.42 31.44 16.50 9.00 58.58 59.92<br />
1\1\I\I\I\<br />
89.93 20.59 16.84<br />
8404 at 30m 11.23 30.42 32.74 17.23 6.69 54.82 48.83 89.72<br />
1\1\I\I\I\ 30.14 23.79<br />
8401 at 20 m 26.81 9.69 1.77 75.83 80.44 60.26 11.65 29.86 35.61<br />
1\1\I\I\I\<br />
84.63<br />
8401 at 35 m 10.18 9.22 0.00 48.75 66.09 44.67 14.56 22.51 31.50 83.84<br />
1\1\I\I\I\
Table 5. Percent Variance of Currents Associated with <strong>the</strong> Wind. Data presented are <strong>the</strong> percent variance of <strong>the</strong><br />
current (<strong>on</strong> its principal axis) associated with <strong>the</strong> wind, <strong>the</strong> wind axis for <strong>the</strong> comparis<strong>on</strong>, and <strong>the</strong> wind<br />
variance <strong>on</strong> <strong>the</strong> axis given. Data are shown for two wind axes: <strong>the</strong> principal axis of <strong>the</strong> wind (to <strong>the</strong> nearest<br />
10·), and <strong>the</strong> axis <strong>on</strong> which <strong>the</strong> greatest associated variance occurred. Note that it isn't possible to distinguish<br />
between an axis and <strong>the</strong> axis with <strong>the</strong> same directi<strong>on</strong> but <strong>the</strong> opposite sense. That is, for example, a<br />
wind axis listed as 120· could actually be 300·. The fIrst part of <strong>the</strong> table is for <strong>the</strong> pre-ftltered period<br />
84336-85184. The sec<strong>on</strong>d part of<strong>the</strong> table presents seas<strong>on</strong>al data for selected meters.<br />
Axis of Greatest<br />
Wind Variance<br />
Highest % Variance<br />
Assoc. with <strong>the</strong> wind<br />
8408 at 40 m<br />
8407 at 18 m<br />
8407 at 48 m<br />
8410 at 37 m<br />
8411 at 33 m<br />
8406 at 15 m<br />
8403 at 18 m<br />
8404 at 20m<br />
8404 at 30m<br />
8401 at 20m<br />
8401 at 35 m<br />
41.28% at 190° (51.87)<br />
20.48% at 20
~<br />
Table 6: <strong>Sea</strong>s<strong>on</strong>al Variati<strong>on</strong> ofKinetic Energy Distributi<strong>on</strong>s and Net and Mean Currents and Winds. Currents were 35-hr filtered before detennining<br />
<strong>the</strong>ir mean and net values. Time periods given are pre-filtering times.<br />
CURRENTS<br />
WINDS<br />
84280-85004<br />
85004-85094 85094-84184 84280-85004<br />
85004-85094 85094-84184<br />
8408at40m<br />
TotalKE<br />
KE> 10d.<br />
KE2-10d.<br />
KE2-5 d.<br />
'IidalKE<br />
Di/Semi<br />
Net cur.<br />
Mean cur.<br />
8407 at 18m<br />
TotalKE.<br />
KE> 10d.<br />
KE2-10d.<br />
KE2-5 d.<br />
'IidalKE<br />
Di/Semi<br />
Net Current<br />
Mean Cur.<br />
8407at48m<br />
TotalKE.<br />
KE> lOcI<br />
KE2-10d.<br />
KE2-5 d.<br />
'IidalKE<br />
Di/Semi<br />
Net Cunent<br />
Mean Cur.<br />
••••••••••••••••••••••••••••••••••••••••••••••••••••••• •••••••••••••••••••••••••••••••••••••••••••••••••••••••<br />
---------.-. 1174.85 333.01 84.63 101.28 41.31<br />
------------ 785.68(66.88%) 179.97(54.04%) 48.25(57.02%) 66.99(66.14%) 24.88(60.22%)<br />
------------ 331.74(28.24%) 113.06(33.95%) 33.03(39.03% 29.97(29.59%) 13.50(32.68%)<br />
--------- 220.95(18.81%) 63.34(19.02%) 15.20(17.96%) 19.53(19.28%) 7.63(18.47%)<br />
----------- 19.07(1.62%) 18.74( 5.63%)<br />
---------- 0.36 0.55<br />
---------- 18.55 ± 7.79 at 9.9 31.02 ± 8.90 at 2.2 6.28 ± 1.37 at 241.4 7.45 ± 2.30 at 212.9 3.51 ± 1.35 at 200.4<br />
------------ 33.3 32.5 10.0 11.0 6.8<br />
••••••••••••••••••••••••••••••••••••••••••••••••••••••• •••••••••••••••••••••••••••••••••••••••••••••••••••••••<br />
1036.32 779.51 415.86 104.97 89.23 32.67<br />
407.48(39.32%) 320.13(41.07%) 116.51(28.02%) 59.72(56.90%) 55.40(62.09%) 14.56(44.55%)<br />
392.54(37.88%) 286.43(40.71%) 86.35(20.76%) 41.28(39.33%) 28.75(32.22%) 14.64(44.81%)<br />
199.16(19.22%) 151.17(22.19%) 31.83(7.65%) 19.88(18.94%) 19.91(22.31%) 8.19(25.07%)<br />
198.14(19.12%) 144.15(13.06%) 190.66(45.85%)<br />
0.25 0.29 0.29<br />
24.60 ± 5.77 at 66.3 20.60 ± 4.63 at 76.5 29.49 ± 2.66 at 68.8 6.62 ± 1.45 at 225.9 7.84 ± 2.03 at 214.9 3.34 ± 0.97 at 192.3<br />
33.2 28.6 30.1 11.2 10.9 6.1<br />
•••••••••••••••••••••••••••••••••••••••••••••••••••••••<br />
503.47<br />
199.23(39.57%)<br />
218.93(43.48%)<br />
114.43(22.73%)<br />
59.71(11.86%)<br />
0.54<br />
21.40 ±4.00 at 50.7<br />
26.3<br />
411.32<br />
168.55(40.98%)<br />
167.44(40.71%)<br />
91.28(22.19%)<br />
53.71(13.06%)<br />
0.39<br />
18.22 ± 2.98 at 64.7<br />
23.8<br />
169.24<br />
66.10(39.06%)<br />
47.31(27.96%)<br />
18.1~(10.72%)<br />
46.01(27.19%)<br />
0.66<br />
23.01 ± 1.94 at 49.8<br />
23.7<br />
•••••••••••••••••••••••••••••••••••••••••••••••••••••••
Table 6 (c<strong>on</strong>tinued).<br />
CURRENTS WINDS<br />
84280-85004 85004-85094 85094-84184 84280-85004 85004-85094 85094-84184<br />
8410at11m ••••••••••••••••••••••••••••••••••••••••••••••••••••••• •••••••••••••••••••••••••••••••••••••••••••••••••••••••<br />
TotalKE 1106.68 833.14 ---------- 84.78 88.64 43.28<br />
KE> 10d. 462.56(41.80%) 398.49(47.83%) ----------- 41.91(47.75%) 55.39(62.49%) 20.52(47.42%)<br />
KE 2-10 d. 387.27(34.99%) 228.32(27.41%) ---------- 42.31(48.21 %) 27.54(31.06%) 18.13(41.88%)<br />
KE2-5 d. 115.75(10.46%) 158.98(19.08%) ---------- 19.69(22.43%) 18.52(20.89%) 11.52(26.63%)<br />
TidalKE 226.59(20.48%) 168.52(20.23%) --------------<br />
Di/Semi 0.37 0.52 .-------------<br />
NetCunent 25.00 ± 6.06 at 3.0 8.06 ± 6.32 at 354.4 ----------- 5.92 ± 1.24 at 247.5 6.49 ± 1.81 at 221.4 2.25 ± 1.13 at 194.3<br />
Mean Cur. 36.4 25.7 ------------- 9.9 10.5 6.3<br />
~ 00<br />
8410at37m<br />
••••••••••••••••••••••••••••••••••••••••••••••••••••••• TotalKE 652.48 522.08 253.05<br />
•••••••••••••••••••••••••••••••••••••••••••••••••••••••<br />
KE> IOd 284.70(43.63%) 258.21(49.46%) 95.04(37.56%)<br />
KE2-10d. 228.28(34.99%) 151.90(29.10%) 67.35(26.62%)<br />
KE2-5 d 69.95(10.72%) 107.26(20.55%) 39.10(15.45%)<br />
TidalKE 111.84(17.14%) 82.71(15.84%) 78.79(31.14%)<br />
Di/Semi 0.49 0.85 0.87<br />
Net Current 18.74 ±4.62 at 358.5 6.00 ± 5.00 at 359.3 6.74:t 2.76 at 350.1<br />
Mean Cur. 24.9 18.5 11.2<br />
8411 at33m ••••••••••••••••••••••••••••••••••••••••••••••••••••••• •••••••••••••••••••••••••••••••••••••••••••••••••••••••<br />
TotalKE 550.97 484.69 304.63 84.90 86.65 46.75<br />
KE>lOd. 145.38(26.39%) 183.38(37.83%) 95.88(31.48%) 38.61(45.48) 53.74(62.02%) 22.11(47.30%)<br />
KE2-10d. 262.90(47.72%) 170.56(35.19%) 86.11(28.27%) 42.79(50.40) 26.99(31.15%) 19.89(42.54%)<br />
KE2-5 d. 71.56(12.99%) 130.18(26.86%) 49.00(16.08%) 19.()O(23.09) 17.83(20.58%) 12.80(27.39%)<br />
TidalKE 112.11(20.35%) 97.44(20.10%) 105.93(34.77%)<br />
Di/Semi 2.73 3.37 4.48<br />
Net Cur. 14.26 ± 3.77 at 353.8 3.03 ± 4.31 at 8.5 3.32 ± 2.47 at 350.8 5.73 ± 1.28 at 254.6 5.96 ± 1.67 at 224.7 1.78 ± 1.13 at 194.5<br />
Mean Cur. 20.4 17.1 10.3 9.6 10.2 6.4
~<br />
8406 at 15 m<br />
TotalKE<br />
KE> 10d.<br />
KE2-10d<br />
KE2-5d.<br />
TidalKE.<br />
Di/Semi<br />
Net Cur.<br />
Mean Cur.<br />
8406atJOm<br />
TotalKE<br />
KE> IOd<br />
KE2-10d<br />
KE2-5d.<br />
TidalKE<br />
Di/Semi<br />
Net Cur.<br />
Mean Cur.<br />
8403 at 10m<br />
TotalKE<br />
KE> IOd.<br />
KE 2-10 d.<br />
KE2-5d.<br />
TidalKE<br />
Di/Semi<br />
Net Cur.<br />
Mean cur.<br />
Table 6 (c<strong>on</strong>tinued).<br />
STATIONS SOUTH OF ST. LAWRENCE<br />
CURRENfS<br />
WINDS<br />
84280-85004 85004-85094 85094-84184 84280-85004 85004-85094 85094-84184<br />
••••••••••••••••••••••••••••••••••••••••••••••••••••••• •••••••••••••••••••••••••••••••••••••••••••••••••••••••<br />
1892.20 1291.08 675.96 102.24 87.60 34.14<br />
412.87(21.82%) 513.10(39.74%) 182.35(26.98%) 55.24(54.04%) 54.15(61.82%) 14.40(42.18%)<br />
912.01(48.20%) 411.49(31.87%) 162.30(24.01%) 42.99(42.05%) 28.05(32.02%) 15.60(45.69%)<br />
340.45(17.99%) 321.39(24.89%) 104.04(15.39%) 20.68(20.22%) 19.46(22.21%) 9.11(26.69%)<br />
377.70(19.96%) 272.11(21.08%) 295.90(43.78%)<br />
0.12 0.17 0.12<br />
3.53 ± 1.84 at 202.4 6.64 ± 6.14 at 128.2 9.59 ± 3.09 at 115.7 6.22 ± 1.38 at 227.2 7.49 ± 1.96 at 216.4 3.01 ± 0.96 at 189.9<br />
33.0 27.5 18.4 10.8 10.8 6.0<br />
••••••••••••••••••••••••••••••••••••••••••••••••••••••• •••••••••••••••••••••••••••••••••••••••••••••••••••••••<br />
948.13 .._---------- -------------<br />
225.31(23.76%) ----------- -----------<br />
472.41(49.83%) ------------- --------------<br />
177.37(18.71%) ------------- ------------<br />
185.69(19.59%) ----------- --------------<br />
0.13 ---------- --------------<br />
1.34 ± 4.24 at 233.4 -------------<br />
23.8 ------------- --------------<br />
••••••••••••••••••••••••••••••••••••••••••••••••••••••• •••••••••••••••••••••••••••••••••••••••••••••••••••••••<br />
211.26 ---------- 142.33 96.81 87.64 35.89<br />
26.55(12.57%) ------------- 18.68(13.12%) 50.45(52.11%) 54.65(62.36%) 15.62(43.51%)<br />
67.52(31.96%) ------------- 27.69(19.45%) •42.52(43.92%) 27.53(31.42%) 15.94(44.41%)<br />
47.67(22.56%) ------------ 18.60(13.07%) 20.34(21.01%) 19.03(21.72%) 9.57(26.66%)<br />
95.75(45.32%) ------------- 79.41(55.80%)<br />
0.12 ------------- 0.11<br />
2.55 ± 0.40 at 51.7 --------_.._.. 2.32 ± 0.67 at 95.3 6.07 ± 1.30 at 232.4 7.23 ± 1.91 at 217.6 2.82 ± 1.03 at 190.5<br />
8.8 ------------- 6.0 10.4 10.7 6.1
VI<br />
o<br />
8403 at 18m<br />
TotalKE<br />
KE> lOcI<br />
KE2-10d<br />
KE2-Sd.<br />
TIdalKE<br />
Di/Semi<br />
Net cur.<br />
Mean Cur.<br />
8404 at 10m<br />
TotalKE<br />
KE> lOcI.<br />
KE2-10d.<br />
KE2-Sd.<br />
TIdalKE<br />
Di/Semi<br />
Net cur.<br />
Mean cur.<br />
8404 at 20 m<br />
TotalKE<br />
KE> lOcI<br />
KE2-10d<br />
KE2-S d.<br />
TidalKE<br />
Di/Semi<br />
Net cur.<br />
Mean cur.<br />
Table 6 (c<strong>on</strong>tinued).<br />
CURRENTS WINDS<br />
84280-85004 8SOO4-85094 8S094-84184 ~2SO-85004 8S004-8S094 8S094-84184<br />
•••••••••••••••••••••••••••••••••••••••••••••••••••••••<br />
391.78<br />
31.73(8.10%)<br />
101.07(25.80%)'<br />
73.88(18.86%)<br />
IS2.49(38.92%)<br />
0.14<br />
1.91 ±0.67 at S9.1<br />
10.2<br />
••••••••••••••••••••••••••••••••••••••••••••••••••••••• •••••••••••••••••••••••••••••••••••••••••••••••••••••••<br />
360.76 ------ 251.S2 96.9S 87.22 3S.86<br />
36.54(10.13%) -------- 28.38(11.28%) SO.38(S1.97%) 54.32(62.28%) IS.43(43.03%)<br />
148.06(41.04%) --------- 49.1S(19.54%) 42.72(44.06%) 27.44(31.4S%) 16.04(44.74%)<br />
87.92(24.37%) --------. 30.48(12.12%) 20.43(21.07%) 18.98(21.76%) 9.62(26.84%)<br />
149.93(41.56%) ---------- ISS.81(61.9S%)<br />
0.10 --------- 0.10<br />
2.81 ± 1.83 at 282.1 ------ 0.93 ±1.38 at 128.S 6.01 ±1.29 at 231.9 7.20 ±1.91 at 217.7 2.79 ±1.02 at 190.0<br />
11.9 ------- 7.2 10.4 10.7 6.0<br />
•••••••••••••••••••••••••••••••••••••••••••••••••••••••<br />
SS9.29<br />
54.63(9.17%)<br />
194.22(34.73%)<br />
128.46(22.97%)<br />
221.78(39.6S%)<br />
0.11<br />
2.93 ±1.28 at 253.6<br />
13.4<br />
207.46<br />
22.6S(10;92%)<br />
66.12(31.87%)<br />
SO.96(24.S7%)<br />
80.10(38.61%)<br />
0.16<br />
4.94 ± 1.08 at 98.0<br />
9.1<br />
37S.9O<br />
60.26(16.03%)<br />
134.9S(3S.9O%)<br />
88.82(23.63%)<br />
138.21(36.77%)<br />
0.12<br />
1.23 ±1.7S at 166.6<br />
11.8<br />
122.17<br />
10.58(8.66%)<br />
24.5S(20.10%)<br />
18.19(14.89%)<br />
67.81(SS.5O%)<br />
0.12,<br />
1.74 ±0.S6 at 79.S<br />
4.9<br />
196.70<br />
IS.59(7.92%)<br />
39.5S(20.10%)<br />
27.54(14.00%)<br />
IIS.92(S8.92%)<br />
0.11<br />
1.4S ±0.90 at 113.9<br />
6.0<br />
. ..<br />
•••••••••••••••••••••••••••••••••••••••••••••••••••••••
8404 at 30 m<br />
TotalKE<br />
KE> lOll.<br />
KE 2-10 d.<br />
KE2-5d.<br />
TidalKE.<br />
Di/Semi<br />
Net cur.<br />
Mean cur.<br />
IJl ..... 8402 at 10m<br />
TotalKE<br />
KE> lOll.<br />
KE 2-10 d.<br />
KE2-5 d.<br />
TidalKE.<br />
Di/Semi<br />
Net cur.<br />
Mean cur.<br />
8402at30m<br />
TotalKE<br />
KE> lOll.<br />
KE 2-10 d.<br />
KE2-5 d.<br />
TidalKE.<br />
Di/Semi<br />
Net cur.<br />
Mean cur.<br />
Table 6 (c<strong>on</strong>tinued).<br />
CURRENTS WINDS<br />
84280-85004 85004-85094 85094-84184 84280-85004 85004-85094 85094-84184<br />
•••••••••••••••••••••••••••••••••••••••••••••••••••••••<br />
289.14<br />
22.14(7.66%)<br />
110.08(38.07%)<br />
72.78(25.17%)<br />
104.39(36.10%)<br />
0.12<br />
2.65 ± 0.82 at 237.3<br />
9.9<br />
200.74<br />
34.32(17.10%)<br />
73.23(36.48%)<br />
47.93(23.88%)<br />
62.73(31.25%)<br />
0.14<br />
1.77± 1.14 at 183.1<br />
12.9<br />
110.59<br />
8.65(7.82%)<br />
29.47(26.65%)<br />
19.27(17.43%)<br />
56.28(50.89%)<br />
0.18<br />
1.21 ± 0.67 at 162.5 .<br />
9.9<br />
•••••••••••••••••••••••••••••••••••••••••••••••••••••••<br />
•••••••••••••••••••••••••••••••••••••••••••••••••••••••<br />
946.53 --_.._------- ------..------ 91.49 86.41 38.90<br />
103.85(10.97%) -------- -------...--..... 44.93(49.11%) 53.90(62.37%) 16.91(43.48%)<br />
155.90(16.47%) ---------- ------------ 42.88(46.86%) 26.90(31.13%) 17.29(44.46%)<br />
78.96(8.34%) ------- -----------.. 20.30(22.18%) 18.44(21.34%) 10.65(27.38%)<br />
634.18(67.00%) --------- ----_..._----<br />
0.11 ----------- --------------<br />
8.28 ± 2.67 at 86.6 ------ --------- 5.71 ± 1.23 at 238.0 6.77 ± 1.84 at 219.7 2.43 ± 1.08 at 189.8<br />
15.3 ----------- ----------- 10.0 10.5 6.1<br />
•••••••••••••••••••••••••••••••••••••••••••••••••••••••<br />
630.64 --------- --------------<br />
60.40(9.58%) ------- -------------<br />
119.00(18.87%) ------ -------------<br />
58.75(9.32%) --------- ------------<br />
392.35(62.22%) ---------- _.------------<br />
0.12 ------------ ------------<br />
1.34 ± 4.24 at 233.4 ----------- -------------<br />
23.8 -----..--- --------------<br />
•••••••••••••••••••••••••••••••••••••••••••••••••••••••<br />
•••••••••••••••••••••••••••••••••••••••••••••••••••••••
8401at20m<br />
Total KE<br />
KE> IOd.<br />
ICE 2-10d.<br />
ICE 2-5 d.<br />
TIdal KE.<br />
VI Di/Semi<br />
N Net cur.<br />
Mean cur.<br />
8401at3Sm<br />
TotalKE<br />
KE> IOd.<br />
KE2-10d.<br />
KE2-5 d.<br />
TIdal KE.<br />
Di/Semi<br />
Net cur.<br />
Mean cur.<br />
Table 6 (c<strong>on</strong>tinued).<br />
CURRENTS WINDS<br />
84280-85004 85004-85094 85094-84184 84280-85004 85004-85094 85094-84184<br />
••••••••••••••••••••••••••••••••••••••••••••••••••••••• •••••••••••••••••••••••••••••••••••••••••••••••••••••••<br />
492.43 414.83 392.82 86.80 83.08 42.55<br />
87.74(17.82%) 50.29(12~12%) 23.51(5.99%) 39.24(45.21%) 51.64(62.16%) 17.59(41.33%)<br />
116.31(23.62%) 111.54(26.89%) 35.74(9.10%) 43.99(50.68%) 25.57(30.77%) 19.65(46.19%)<br />
53.87(10.94%) 89.08(21.47%) 23.07(5.87%) 20.37(23.46%) 17.22(20.72%) 12.28(28.85%)<br />
269.32(54.69%) 232.06(55.94%) 315.43(80.30%)<br />
0.23 0.24 0.23<br />
7.27 ± 2.35 at 4.2 1.76 ± 1.90 at 354.8 1.05 ± 0.72 at 142.4 4.95 ± 1.24 at 242.6 6.07 ± 1.75 at 222.9 1.83 ± 1.14 at 185.4<br />
12.9 11.0 5.5 9.5 10.2 6.1<br />
•••••••••••••••••••••••••••••••••••••••••••••••••••••••<br />
489.34<br />
86.31(17.64%)<br />
143.55(29.34%)<br />
68.67(14.03%)<br />
214.46(43.83%)<br />
0.35<br />
7.17 ±2.33 at 0.3<br />
13.3<br />
390.82<br />
49.65(12.70%)<br />
107.00(27.38%)<br />
86.56(22.15%)<br />
197.22(50.46%)<br />
0.30<br />
1.74 ± 1.86 at 6.3<br />
10.7<br />
165.04<br />
12.71(7.70%)<br />
20.85(12.63%)<br />
14.39(8.72%)<br />
113.63(68.85%)<br />
0.46<br />
0.17 ± 0.64 at 317.7<br />
4.5<br />
•••••••••••••••••••••••••••••••••••••••••••••••••••••••
VI<br />
v,)<br />
Table 7a-c: <strong>Sea</strong>s<strong>on</strong>al Correlati<strong>on</strong> Coefficients<br />
Table 7a: 84280-85004<br />
8407 8407 8410 8410 8411 8406 8406 8403 8403 8404 8404 8404 8402 8402 8401 8401<br />
18m 48m 22m 37m 33m 15m 30m 10m 18m 10m 20m 30m 10m 30m 20m 35m<br />
8407 at 18m MMA .98/0 ---/3 --/4 ---/4 ---/0 ---/0 --/0 --/0 .43/0 .47/0 .43/0 .3610 .44/0 --/4 --/4<br />
8407 at 48 m .98/0 MMA<br />
--/3 --/4 --/4 ---/0 --/0 --/0 --/0 .41/0 .45/0 .43/0 .35/0 .44/0 --/4 --/4<br />
8410 at 22 m --10 ---/0 MMA<br />
.99/0 .8710 -.6210 -.6310 -.44/0 -.3610 -.31/0 -.3010 -.27/0 .65/1 .71/1 .8210 .77/0<br />
8410 at 37 m ---10 ---10 .99/0<br />
MMA .85/1 -.61/0 -.63/0 -.45/0 -.37/0 -.3210 -.3210 -.3010 .65/2 .71/2 .8210 .76/0<br />
8411 at 33 m ---/3 ---/0 .87/0 .85/0<br />
MMA<br />
-.50/0 -.5010 -.36/0 -.34/0 -.3010 -.31/0 -.27/0 .58/1 .65/1 .79/0 .83/0<br />
8406 at 15 m ---/1 ---/1 -.6411 -.62/1 -.5812<br />
MMA<br />
.9910 .68/0 .6210 .74/0 .73/0 .7010 -.4614 -.49/4 -.6810 -.6
Table 7b: 85004-85094<br />
8408 8407 8407 8410 8410 8411 8406 8403 8404 8404 8401 8401<br />
40m 18 m 48m 22m 37m 33m 15m 18m 20m 30m 20m 35m<br />
8408 at 40 m MM/\ .64/0 .61/0 .83/0 .82/0 .67/0 ---/0 ---/3 ---/3 ---/0 .40/0 .34/0<br />
8407 at 18 m .64/0<br />
/\/\AM<br />
.98/0 ---/0 ---/0 ---/4 .39/1 ---/0 .52/0 .46/0 ---/0 ---/0<br />
8407 at 48 m .61/0 .98/0<br />
/\MM<br />
---/0 ---/0 ---/1 .39/1 ---/0 .53/0 .49/0 ---/0 ---/0<br />
8410 at 22 m .83/0 ---/1 ---/1<br />
/\/\AM<br />
1.00/0 .89/0 -.64/0 ---/4 -.27/0 -.37/0 .70/0 .66/0<br />
8410 at 37 m .83/1 ---/1 ---/3 1.00/0<br />
/\MM<br />
.89/0 -.64/0 ---/4 -.27/0 -.37/0 .73/0 .68/0<br />
8411 at 33 m .68/1 ---/4 ---/4 .89/0 .89/0<br />
MI\M -.71/0 ---/0 -.36/0 -.45/0 .79/0 .77/0<br />
8406 at 15 m ---/2 .38/0 .39/0 -.64/0 -.64/0 -.71/0<br />
/\MM<br />
.29/0 .73/0 .68/0 -.74/0 -.74/0<br />
8403 at 18 m ---/4 ---/3 ---/3 ---/1 ---/0<br />
---/1 .33/1 MI\M<br />
.68/1 .69/0 -.30/0 -.30/0<br />
8404 at 20 m ---/0 .52/0 .53/0 -.28/1 -.28/1 -.38/1 .73/1 .68/0<br />
/\MM<br />
.90/0 -.58/0 -.60/0<br />
VI<br />
+:0-<br />
8404 at 30 m ---/3 .46/0 .49/1 -.38/1 -.37/1 -.47/1 .69/1 .60/0 .90/0<br />
/\MM<br />
-.62/0 -.62/0<br />
/\MM<br />
8401 at 20 m .50/2 ---/0 ---/0 .78/2 .79/1 .87/1 -.80/1 -.30/0 -.58/1 -.64/1 .95/0<br />
8401 at 35 m .42/2 ---/0 ---/0 .72/1 .73/1 .83/1 -.78/1 -.30/0 -.60/0 -.62/0 .95/0<br />
/\MM<br />
Correlati<strong>on</strong> with Wind<br />
8408 8407 8410 8404 8401<br />
40m 18m 37m 20m 20m<br />
Windl -.68/1 -.65/1 -.56/1 ---/2 -.29/0<br />
Wind2 -.84/1 -.68/1 -.82/1 -.40/1 -.66/1
Table 7c: 85094-85184<br />
8408 8407 8407 8410 8411 8406 8403 8403 8404 8404 8404 8401 8401<br />
40m 18m 48m 37m 33m 15m 10m 18m 10m 20m 30m 20m 35m<br />
8408 at 40 m f\MM ---/0 ---/0 .83/0 .7010 ---/0 ---/0 ---/0 ---/0 ---/4 ---/0 .50/0 .36/0<br />
8407 at 18 m ---/4 MMf\<br />
.9810 ---/0 -.36/0 .53/0 ---/4 ---/4 .34/0 .42/0 .40/0 -.39/0 -.47/0<br />
8407 at 48 m ---/4 .98/0<br />
MMf\<br />
---10 -.39/0 .57/0 ---/4 ---/4 .36/0 .44/0 .42/0 -.44/0 -.48/0<br />
8410 at 37 m .83/0 ---/3 ---/2<br />
MMf\<br />
.88/0 -.58/0 -.36/0 -.33/0 ---/0 -.29/0 -.39/0 .70/0 .flJ/O<br />
8411 at 33 m .70/0 -.37/1 -.39/1 .8810<br />
MMf\<br />
-.64/0 ---/0 ---/0 ---/0 -.26/0 -.3310 .72/0 .68/0<br />
8406 at 15 m ---/0 .55/1 .58/1 -.58/0 -.64/1<br />
MMf\<br />
.45/0 .49/0 .58/0 .59/0 .flJlO -.69/0 -.61/0<br />
8403 at 10 m ---/2 .31/3 .33/3 -.44/2 -.39/3 .57/2<br />
MMf\<br />
.88/0 .80/0 .78/1 .77/1 -.53/1 -.61/2<br />
8403 at 18 m ---/1 .26/3 .26/3 -.38/1 -.30/2 .55/1 .88/0<br />
MMf\<br />
.75/0 .80/0 .78/1 -.42/0 -.57/1<br />
8404 at 10m ---/1 .45/2 .47/2 -.33/1 -.31/2 .64/1 .80/0 .75/0<br />
MMf\<br />
.89/0 .8110 -.55/0 -.62/1<br />
8404 at 20 m ---/1 .50/2 .52/2 -.33/1 -.32/2 .63/1 .75/0 .80/0 .89/0<br />
MMf\<br />
.92/0 -.56/0 -.65/1<br />
8404 at 30 m ---/1 .45/1 .47/1 -.42/1 -.36/1 .63/1 .71/0 .78/0 .81/0 .92/0<br />
MJV\A<br />
-.63/0 -.64/1<br />
8401 at 20 m .54/1 -.46/2 -.50/2 .76/1 .77/1 -.7211 -.50/0 -.42/0 -.55/0 -.56/0 -.63/0<br />
MJV\A<br />
.77/1<br />
IJI<br />
IJI<br />
8401 at 35 m .36/1 -.49/1 -.50/1 .flJ/1 .68/0 -.61/0 -.45/0 -.47/0 -.56/0 -.61/0 -.62/0 .75/0<br />
MMf\<br />
,;.<br />
c<br />
0G><br />
0<<br />
m :IJ<br />
Correlati<strong>on</strong> with Wind<br />
z~mẕi<br />
:IJ<br />
ẕ "<br />
i<br />
z 8408 8407 8410 8404 8401<br />
G><br />
40m 18m 37m 20m 20m<br />
0<br />
"T1<br />
"T1<br />
n<br />
m""<br />
Windl -.78/1 -.41/1 -.81/2 ---/1 -.55/1<br />
r Wind2 -.79/1 -.43/2 -.81/2 .29/1 -.58/1<br />