Oceanographic conditions on the northern Bering Sea shelf: 1984 ...
Oceanographic conditions on the northern Bering Sea shelf: 1984 ...
Oceanographic conditions on the northern Bering Sea shelf: 1984 ...

Create successful ePaper yourself
Turn your PDF publications into a flip-book with our unique Google optimized e-Paper software.
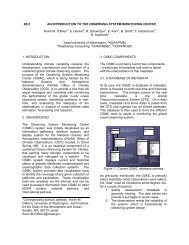
3.3 Current Spectra<br />
The highest total variances measured were at <strong>the</strong> SW comer of St. Lawrence Island and at<br />
<strong>Bering</strong> Strait (Figs. 4a-h). The lowest variances were in <strong>the</strong> bight south of St Lawrence Island.<br />
The average total spectral variance at <strong>the</strong> moorings in <strong>the</strong> three straits was 542.4 cm/s 2 . South of<br />
St. Lawrence Island, <strong>the</strong> average was 428.6 cm/s 2 ; 284.6 cm/s 2 if <strong>the</strong> atypical record from 8406<br />
at <strong>the</strong> SW comer of <strong>the</strong> island is excluded. It is unclear which of <strong>the</strong> two sou<strong>the</strong>rn straits was<br />
more energetic. Total variance measured at <strong>the</strong> two Shpanberg moorings was between <strong>the</strong><br />
variance at <strong>the</strong> two meters <strong>on</strong> <strong>the</strong> Anadyr mooring. Total variance decreased with depth at all<br />
moorings with more than <strong>on</strong>e meter, and <strong>the</strong> depths of <strong>the</strong> Shpanberg moorings were intermediate<br />
between <strong>the</strong> depths of <strong>the</strong> Anadyr meters.<br />
Variance <strong>on</strong> <strong>the</strong> minor axis was generally a factor of ten less than variance <strong>on</strong> <strong>the</strong> principal<br />
axis. The <strong>on</strong>ly case where variance <strong>on</strong> <strong>the</strong> minor axis surpassed variance <strong>on</strong> <strong>the</strong> principal axis<br />
was in <strong>the</strong> semidiumal tidal band at 8401. Current spectra at all meters were red except for peaks<br />
at tidal periods (Figs. 4a-h). In <strong>the</strong> three straits and at 8406, more variance was in <strong>the</strong> >lO-day<br />
band than in any o<strong>the</strong>r, while at every o<strong>the</strong>r site variance was greatest in <strong>the</strong> tidal band. Records<br />
of stati<strong>on</strong>s in <strong>the</strong> fIrst regi<strong>on</strong> c<strong>on</strong>tained 37-63% of <strong>the</strong>ir variance in periods >10 days and 2-26%<br />
of <strong>the</strong>ir variance at tidal periods. The o<strong>the</strong>r stati<strong>on</strong>s had 10-15% of <strong>the</strong>ir variance in <strong>the</strong> >lO-day<br />
band and 37-65% of <strong>the</strong>ir variance at tidal periods. At moorings with more than <strong>on</strong>e meter <strong>the</strong><br />
percent variance at periods >10 days increased with depth, and <strong>the</strong> percent at tidal periods<br />
decreased with depth.<br />
There was less regi<strong>on</strong>al difference of <strong>the</strong> percent variati<strong>on</strong> at 2-10 day and 2-5 day periods<br />
than for <strong>the</strong> bands discussed above. South of St. Lawrence Island, 19-33% of <strong>the</strong> variance was in<br />
<strong>the</strong> 2-10 day band and 13-20% was at 2-5 day periods. In <strong>the</strong> straits and at 8406, 26-35% of <strong>the</strong><br />
variance was at 2-10 day periods and 14-19% at 2-5 day periods. Like l<strong>on</strong>g-period variance, <strong>the</strong><br />
percent variance in <strong>the</strong> 2-10 day and 2-5 day bands increased with depth.<br />
3.4 Wind Spectra<br />
Like <strong>the</strong> current spectra, wind spectra were red. As would be expected from <strong>the</strong> fact that<br />
<strong>on</strong>ly 55-68% of <strong>the</strong> winds' variance occurred <strong>on</strong> <strong>the</strong>ir principal axes (Table 2), variance <strong>on</strong> <strong>the</strong><br />
principal and orthog<strong>on</strong>al axes were of approximately <strong>the</strong> same magnitude. There was less than a<br />
10% difference between <strong>the</strong> highest total wind variance (at <strong>Bering</strong> and Shpanberg Straits) and <strong>the</strong><br />
lowest (at <strong>the</strong> westernmost moorings). At all moorings, 54-62% of <strong>the</strong> total wind variance was at<br />
periods greater than 10 days, about 35% was at periods of 2-10 days, and about 20% was at 2-5<br />
days.<br />
3.5 Correlati<strong>on</strong> and Coherence<br />
All correlati<strong>on</strong> coefficients computed from records of meters <strong>on</strong> <strong>the</strong> same mooring were<br />
0.9 or greater and were highest at 0 lag (Table 3). Meters <strong>on</strong> <strong>the</strong> same mooring were coherent at<br />
all periods (Fig. 5a). Most of <strong>the</strong> cross-variance for <strong>the</strong>se comparis<strong>on</strong>s was at periods greater<br />
than 7.5 days (9.1 days at 8401), although records from meters south of St. Lawrence Island<br />
5