Chowdhury et al (2011); PDF file - Prolinnova
Chowdhury et al (2011); PDF file - Prolinnova
Chowdhury et al (2011); PDF file - Prolinnova

You also want an ePaper? Increase the reach of your titles
YUMPU automatically turns print PDFs into web optimized ePapers that Google loves.
422 A. H. <strong>Chowdhury</strong> <strong>et</strong> <strong>al</strong>.<br />
Downloaded By: [KEMÖ (Kooperation E-Medien Österreich ) - KEMO Austrian Consortium - (BOTH SSH/S&T) Parent Collections Library Account] At: 12:18 11 April <strong>2011</strong><br />
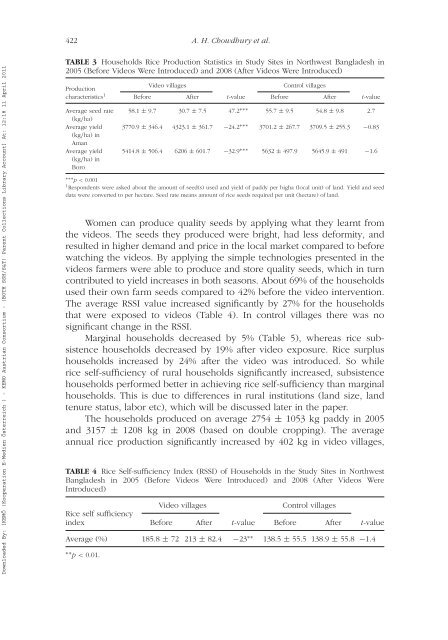
TABLE 3 Households Rice Production Statistics in Study Sites in Northwest Bangladesh in<br />
2005 (Before Videos Were Introduced) and 2008 (After Videos Were Introduced)<br />
Video villages<br />
Control villages<br />
Production<br />
characteristics 1 Before After t-v<strong>al</strong>ue Before After t-v<strong>al</strong>ue<br />
Average seed rate<br />
(kg/ha)<br />
Average yield<br />
(kg/ha) in<br />
Aman<br />
Average yield<br />
(kg/ha) in<br />
Boro<br />
58.1 ± 9.7 30.7 ± 7.5 47.2 ∗∗∗ 55.7 ± 9.5 54.8 ± 9.8 2.7<br />
3770.9 ± 346.4 4323.1 ± 361.7 −24.2 ∗∗∗ 3701.2 ± 267.7 3709.5 ± 255.3 −0.83<br />
5414.8 ± 506.4 6206 ± 601.7 −32.9 ∗∗∗ 5632 ± 497.9 5645.9 ± 491 −1.6<br />
∗∗∗ p < 0.001<br />
1 Respondents were asked about the amount of seed(s) used and yield of paddy per bigha (loc<strong>al</strong> unit) of land. Yield and seed<br />
data were converted to per hectare. Seed rate means amount of rice seeds required per unit (hectare) of land.<br />
Women can produce qu<strong>al</strong>ity seeds by applying what they learnt from<br />
the videos. The seeds they produced were bright, had less deformity, and<br />
resulted in higher demand and price in the loc<strong>al</strong> mark<strong>et</strong> compared to before<br />
watching the videos. By applying the simple technologies presented in the<br />
videos farmers were able to produce and store qu<strong>al</strong>ity seeds, which in turn<br />
contributed to yield increases in both seasons. About 69% of the households<br />
used their own farm seeds compared to 42% before the video intervention.<br />
The average RSSI v<strong>al</strong>ue increased significantly by 27% for the households<br />
that were exposed to videos (Table 4). In control villages there was no<br />
significant change in the RSSI.<br />
Margin<strong>al</strong> households decreased by 5% (Table 5), whereas rice subsistence<br />
households decreased by 19% after video exposure. Rice surplus<br />
households increased by 24% after the video was introduced. So while<br />
rice self-sufficiency of rur<strong>al</strong> households significantly increased, subsistence<br />
households performed b<strong>et</strong>ter in achieving rice self-sufficiency than margin<strong>al</strong><br />
households. This is due to differences in rur<strong>al</strong> institutions (land size, land<br />
tenure status, labor <strong>et</strong>c), which will be discussed later in the paper.<br />
The households produced on average 2754 ± 1053 kg paddy in 2005<br />
and 3157 ± 1208 kg in 2008 (based on double cropping). The average<br />
annu<strong>al</strong> rice production significantly increased by 402 kg in video villages,<br />
TABLE 4 Rice Self-sufficiency Index (RSSI) of Households in the Study Sites in Northwest<br />
Bangladesh in 2005 (Before Videos Were Introduced) and 2008 (After Videos Were<br />
Introduced)<br />
Video villages<br />
Control villages<br />
Rice self sufficiency<br />
index Before After t-v<strong>al</strong>ue Before After t-v<strong>al</strong>ue<br />
Average (%) 185.8 ± 72 213 ± 82.4 −23 ∗∗ 138.5 ± 55.5 138.9 ± 55.8 −1.4<br />
∗∗ p < 0.01.