Investigation of Fiber Optic Sensor for Monitoring of Ammonia
Investigation of Fiber Optic Sensor for Monitoring of Ammonia
Investigation of Fiber Optic Sensor for Monitoring of Ammonia

Create successful ePaper yourself
Turn your PDF publications into a flip-book with our unique Google optimized e-Paper software.
Proceedings <strong>of</strong> IMECE2008<br />
2008 ASME International Mechanical Engineering Congress and Exposition<br />
October 31-November 6, 2008, Boston, Massachusetts, USA<br />
IMECE2008-67940<br />
INVESTIGATION OF FIBER OPTIC SENSOR FOR MONITORING OF AMMONIA<br />
Sistla S Shastry, Abdeq M. Abdi and A. G. Agwu Nnanna<br />
Purdue Calumet Water Institute<br />
Purdue University Calumet, Hammond, IN 46323<br />
Phone: 219 989-2071; Fax: 219 989 2898<br />
Email: shridharsastry@gmail.com<br />
IMECE2008-67940<br />
1. Abstract<br />
Detection and characterization <strong>of</strong> chemical contaminants in<br />
water network is paramount <strong>for</strong> water quality and water<br />
security. The current trend <strong>of</strong> monitoring the presence <strong>of</strong><br />
contaminants is the batch sampling technique, where sample<br />
<strong>of</strong> water is collected and analyzed in the laboratory. While this<br />
technique is accurate, it fails to provide immediate<br />
in<strong>for</strong>mation. In this work, the authors investigate the<br />
effectiveness <strong>of</strong> utilizing a fiber optics based sensor <strong>for</strong><br />
detecting ammonia in water. In order <strong>for</strong> the system to sense<br />
ammonia, a small portion <strong>of</strong> the cladding <strong>of</strong> the fiber optic<br />
cable is stripped and replaced by a porous polymer material. A<br />
novel procedure <strong>of</strong> etching the glass cladding is reported. The<br />
modified cladding when interacts with ammonia causes a<br />
change in intensity <strong>of</strong> the electromagnetic wave flowing<br />
through the cable. The change in intensity caused by the<br />
modified cladding is studied parametrically which will help in<br />
<strong>for</strong>ming a correlation between concentration <strong>of</strong> ammonia and<br />
absorbance.<br />
2. Introduction<br />
Providing contaminant free water is <strong>of</strong> paramount importance<br />
<strong>for</strong> a water utility service. The current trend <strong>of</strong> detection is<br />
based on online monitoring <strong>of</strong> various water related<br />
parameters such as conductivity, turbidity, pH, dissolved<br />
oxygen (DO), free chlorine (FC), etc. Even measuring these<br />
parameters help in detection <strong>of</strong> anything alien that maybe<br />
present in water, it really gives no clue as to the specific<br />
contaminant present in water. The authors in this paper are<br />
trying to bridge this gap by developing a fiber optics based<br />
ammonia sensor which is highly selective to ammonia. Ef<strong>for</strong>t<br />
has been put to develop a correlation between the output <strong>of</strong> the<br />
signal and the concentration <strong>of</strong> the contaminant that maybe<br />
present in water. Of the chemical sensors (viz. Enzyme<br />
sensors, Catalytic sensors, CHEMFETS, Chemiresistors,<br />
<strong>Optic</strong>al <strong>Sensor</strong>s) <strong>Optic</strong>al Chemical <strong>Sensor</strong>s and CHEMFETs<br />
are the most commonly used sensor technologies. In the recent<br />
years, <strong>Fiber</strong> <strong>Optic</strong>s based sensors are being preferred over<br />
conventional l chemical sensors, such as Chemiresistors and<br />
Transistor based sensors, because <strong>of</strong> their large dynamic<br />
range, selectivity, sensitivity, simplicity and cost effectiveness<br />
[1]-[4].[4]. <strong>Fiber</strong> optics based sensors can be used to respond to<br />
external physical, chemical, biological changes [5]-[9].<br />
Cladding Modification Technique (CMT) was adopted to<br />
make the fiber cable. CMT involves removing the passive<br />
cladding <strong>of</strong> the fiber cable and replacing it with a material<br />
which is active towards ammonia. Polyaniline (PAni) is a<br />
conducting polymer which has found many applications in<br />
semiconductor industry due to its conducting nature.<br />
Polyaniline shows a strong absorption in the blue and green<br />
region <strong>of</strong> visible spectrum when exposed to <strong>Ammonia</strong> and<br />
Hydrochloric acid (HCl), respectively which can be utilized<br />
<strong>for</strong> detection <strong>of</strong> ammonia and HCl. The amount <strong>of</strong> change in<br />
absorption can be utilized to find out the concentration <strong>of</strong><br />
ammonia or HCl. Other than the developed fiber cable,<br />
components like a light source and spectrometer are required.<br />
Detection <strong>of</strong> contaminant is achieved by observing the shift in<br />
absorbance curve. . Whereas the concentration <strong>of</strong> contaminant<br />
can be observed by the correlation curve developed between<br />
absorbance and concentration <strong>of</strong> contaminant.<br />
3. Theory<br />
Based on the Refractive Index <strong>of</strong> the active cladding material<br />
the fiber optic based sensor can either be an evanescent wave<br />
based sensor or a leaky evanescent wave based sensor. If the<br />
refractive index (RI) <strong>of</strong> the sensing material is less than that <strong>of</strong><br />
the core then the resulting sensor is an evanescent wave based<br />
sensor and if the RI <strong>of</strong> modified cladding is more than the RI<br />
<strong>of</strong> core then the sensor developed is a leaky evanescent wave<br />
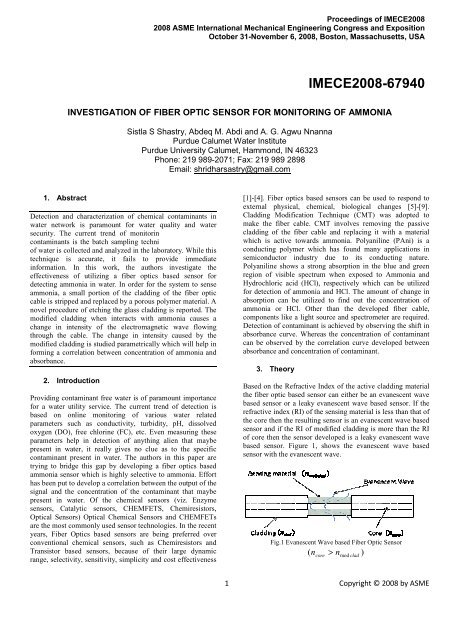
based sensor. Figure 1, shows the evanescent wave based<br />
sensor with the evanescent wave. w<br />
Fig.1 Evanescent Wave based <strong>Fiber</strong> <strong>Optic</strong> <strong>Sensor</strong><br />
( ncore > n mod clad<br />
)<br />
1<br />
Copyright © 2008 by ASME
Evanescent wave is the property <strong>of</strong> a fiber cable wherein some<br />
part <strong>of</strong> the electromagnetic wave flowing inside the fiber cable<br />
leaks out <strong>of</strong> the core and is present in the cladding <strong>of</strong> the fiber<br />
cable. Evanescent wave is the result <strong>of</strong> the conservation <strong>of</strong><br />
energy at the core-clad clad interface and decays exponentially<br />
along the radial direction, the value becoming almost zero as<br />
the wave reaches the cladding-surrounding interface. When<br />
the normal passive glass cladding <strong>of</strong> the fiber cable is replaced<br />
by an active sensitive sitive material, the energy associated with the<br />
evanescent wave is absorbed by the sensing material and<br />
hence the energy associated with the electromagnetic wave<br />
flowing inside the core <strong>of</strong> the fiber is reduced. When the<br />
sensor is exposed to a contaminant it interacts with the<br />
contaminant chemically, and causes further change in output.<br />
But this change is in a specific wavelength region which can<br />
be identified as the signature <strong>of</strong> the contaminant. The main<br />
drawback with this kind <strong>of</strong> design is that the sensitivity <strong>of</strong><br />
such a sensor is very small. The evanescent wave carries at<br />
most 1% <strong>of</strong> the total energy and the change in that 1% is even<br />
small, typically the change in output due to evanescent wave<br />
based sensors is about 0.02%. On the other hand in case <strong>of</strong><br />
Leaky Evanescent wave based sensors, the drop in the output<br />
is considerably large. Figure 2 shows the structure <strong>of</strong> such a<br />
sensor.<br />
4. <strong>Optic</strong>al Property <strong>of</strong> Polyaniline<br />
The polyanilines lines refer to a class <strong>of</strong> different polymers which<br />
can be considered as being derived from a polymer, the base<br />
<strong>for</strong>m <strong>of</strong> which known as emeraldine base consists <strong>of</strong> alternate<br />
oxidised and reduced states. The average oxidation state can<br />
be varied continuously from 0 to 1. An oxidation state <strong>of</strong> 0.5 is<br />
known as emeraldine state, the deprotanated <strong>for</strong>m <strong>of</strong> which<br />
known as emeraldine base is blue in color whereas the<br />
protanated <strong>for</strong>m known as emeraldine salt is green in color.<br />
Emeraldine state polyaniline used in this case as the sensing<br />
material with a RI <strong>of</strong> 2.43 in HCl and 1.94in <strong>Ammonia</strong>, as<br />
found in [11], which are both greater than water. Using the<br />
previous data given in the literature [10], it was estimated that<br />
the minimum and maximum absorption coefficient <strong>of</strong><br />
Polyaniline to be around 0.3 um -1 when exposed to HCl and<br />
0.6 um -1 when exposed to ammonia, respectively. This shows<br />
that 30% and 60% <strong>of</strong> energy is absorbed by a 1<br />
µ m<br />
Polyaniline layer exposed to HCl and <strong>Ammonia</strong> respectively.<br />
Emeraldine state Polyaniline polymers are usually prepared by<br />
chemical [10]-[14][14] oxidation <strong>of</strong> aniline hydrochloride by<br />
ammonium persulphate. Of interest <strong>for</strong> development <strong>of</strong> optical<br />
sensor is the reversible protanation and deprotanation reaction<br />
between the base and salt as seen in Fig.3. This change from<br />
base to salt and back is accompanied by a shift in<br />
λ<br />
max<br />
from<br />
900nm <strong>for</strong> HCl to 780nm <strong>for</strong> ammonia as seen from Fig. 6,<br />
where Friedman’s statistical smoothing is done <strong>for</strong> clarity <strong>of</strong><br />
the plot. The change in UV-VIS spectrum characteristics <strong>of</strong><br />
Polyaniline when exposed to ammonia and HCl is being used<br />
<strong>for</strong> detection.<br />
Fig. 2 Structure <strong>of</strong> Leaky Evanescent Wave based <strong>Fiber</strong> <strong>Sensor</strong><br />
In this case, the evanescent wave phenomenon takes place<br />
along with multiple reflections. When the RI <strong>of</strong> modified<br />
cladding is greater than that <strong>of</strong> the core ( n<br />
mod clad<br />
> ncore<br />
) the<br />
electromagnetic wave gets refracted into the modified<br />
cladding but since RI <strong>of</strong> the modified cladding is more than<br />
that <strong>of</strong> surrounding (RI <strong>of</strong> water=1.33< n<br />
core<br />
< n mod clad<br />
) light<br />
is reflected back into the modified cladding, again undergoing<br />
refraction and reflection at the modified cladding -core<br />
interface and this process keeps on repeating throughout the<br />
length <strong>of</strong> the sensing region. Also the absorption coefficient <strong>of</strong><br />
the sensing material causes the intensity <strong>of</strong> light to decrease<br />
after every reflection which adds to the loss due to refraction.<br />
Figure 2 shows this process <strong>for</strong> just one light ray, when the<br />
complete electromagnetic spectrum is taken into account the<br />
phenomenon <strong>of</strong> multiple reflections is considerable.<br />
Considering the above discussion it was decided that the leaky<br />
Evanescent wave based sensor be developed <strong>for</strong> increased<br />
sensitivity.<br />
Absorbance, au<br />
Fig.3 Polyaniline in Emeraldine Base and Emeraldine salt <strong>for</strong>ms<br />
2% HCl<br />
2% <strong>Ammonia</strong><br />
polymer<br />
1.0<br />
2% <strong>Ammonia</strong><br />
0.8<br />
2% HCl<br />
0.6<br />
0.4<br />
polymer<br />
400<br />
600 800 1000<br />
Wavelength, nm<br />
Fig.4 Characteristic plot <strong>of</strong> Absorbance as a function <strong>of</strong> Wavelength<br />
<strong>for</strong> Polyaniline<br />
2<br />
Copyright © 2008 by ASME
5. Preparation <strong>of</strong> <strong>Fiber</strong> <strong>Optic</strong> <strong>Sensor</strong><br />
5.1 Preparation <strong>of</strong> <strong>Fiber</strong> cable surface<br />
A multimode silica fiber cable, with numerical aperture (NA)<br />
0.22 and diameter 200 µ m /220 µ m /240 µ m <strong>for</strong> core,<br />
cladding and buffer jacketing was used. Required length <strong>of</strong> the<br />
fiber cable 2 to 5 cm is chosen to be stripped by using the wet<br />
etching technique, where a 50% Sodium Hydroxide (NaOH)<br />
solution is used as the etching reagent. The fiber cable is<br />
dipped into the solution with the temperature maintained at<br />
240 o F . The 200 µ m fiber cable with the cladding thickness<br />
<strong>of</strong> 20 µ m is dipped into the solution <strong>for</strong> 30 minutes after<br />
which only the core is left, hence giving an etch rate <strong>of</strong><br />
660nm/min. NaOH solution was used because <strong>of</strong> the relative<br />
ease <strong>of</strong> operation compared to standard buffered HF solution.<br />
Intensity <strong>of</strong> electromagnetic wave received at spectrometer<br />
when the sensor is exposed to DI water, Intensity <strong>of</strong><br />
electromagnetic wave received at the spectrometer due to stray<br />
light, respectively. DI water is placed in a container and<br />
placed over a magnetic stirrer as shown in fig.5. To increase<br />
the concentration <strong>of</strong> ammonia in the container ammonia is<br />
added from top and thoroughly mixed using the stirrer; this<br />
gives a uni<strong>for</strong>m sample <strong>of</strong> required concentration.<br />
Spectrometer<br />
5.2 Polyaniline Coating<br />
The stripped fiber cable is now introduced into the Polyaniline<br />
solution using a dipping machine <strong>for</strong> 15 minutes. This process<br />
gives a uni<strong>for</strong>m coating <strong>of</strong> thickness less than 1 µ m . The<br />
Polyaniline solution is made by mixing two solutions prepared<br />
by mixing 0.777g <strong>of</strong> Aniline Hydrochloride and 0.1925g <strong>of</strong><br />
Ammonium Persulphate in 15ml <strong>of</strong> water as in [12]. The<br />
Polyaniline layer thus <strong>for</strong>med is hydrophobic in nature and<br />
hence can be used in water but gradually deteriorates and the<br />
sensitivity <strong>of</strong> the sensor decreases. Also the polymer layer<br />
reacts with any base or acid that maybe present in water which<br />
makes it less selective. To increase the selectivity and<br />
sensitivity <strong>of</strong> the polymer sensor a thin layer <strong>of</strong> Polydimethyl<br />
Siloxane is applied on top <strong>of</strong> the polymer layer. The fiber<br />
cable is then air dried at 50 o C<br />
6. Experimental Setup<br />
<strong>for</strong> 3 days.<br />
The experimental setup shown in figure 5 consists <strong>of</strong> the fiber<br />
optic sensor along with a light source and spectrometer both<br />
supplied by Ocean <strong>Optic</strong>s, Inc operating in the wavelength<br />
range <strong>of</strong> 200-1100nm.The light source is a broad band type<br />
with deuterium and halogen light bulbs which operate in the<br />
210-400nm and 300-1500nm range respectively. Data from<br />
the spectrometer is processed using the s<strong>of</strong>tware Spectrasuite<br />
provided by Ocean <strong>Optic</strong>s Inc. A plot <strong>of</strong> Absorbance vs.<br />
wavelength is plotted where Absorbance is calculated as<br />
⎛ S<br />
A = −<br />
⎜<br />
λ<br />
log<br />
⎝ R<br />
λ<br />
λ<br />
− D<br />
λ<br />
− D<br />
λ<br />
⎞<br />
⎟<br />
⎠<br />
Water Sample<br />
Magnetic<br />
with <strong>Ammonia</strong><br />
Stirrer<br />
Fig. 5 Experimental Setup<br />
Also the container is always kept closed to avoid any escape<br />
<strong>of</strong> ammonia vapors. The fiber sensor is passing through the<br />
container immersed in the sample hence its detecting ammonia<br />
in water at various concentrations.<br />
7. Results<br />
Light Source<br />
Fig. 6 shows the plot <strong>of</strong> Absorbance as a function <strong>of</strong><br />
wavelength <strong>for</strong> various concentrations <strong>of</strong> <strong>Ammonia</strong>. Plot A<br />
was taken with the sensor in DI water. While preparation <strong>of</strong><br />
the ammonia sensor a small amount <strong>of</strong> 0.1M HCl is added to<br />
the solutions used to prepare Polyaniline, this makes sure that<br />
the polymer sensing region is in Emeraldine Salt <strong>for</strong>m which<br />
is green in color. This can be observed from the dip in the<br />
absorbance curve <strong>of</strong> plot A at 530nm which belongs to the<br />
green region <strong>of</strong> visible spectrum.<br />
Where, A , S , R ,<br />
λ<br />
λ<br />
λ<br />
Dλ<br />
represent Absorbance at a specific<br />
wavelength, Intensity <strong>of</strong> electromagnetic wave received at<br />
spectrometer when the sensor is exposed to contaminant,<br />
3 Copyright © 2008 by ASME
Absorbance, au<br />
1.1<br />
0.9<br />
0.7<br />
A<br />
B<br />
C<br />
D<br />
E<br />
F<br />
G<br />
H<br />
I<br />
Absorbance min. at 480nm<br />
when exposed to 18ppm ammonia<br />
The plots 6 and 7 shown above give a relative measurement <strong>of</strong><br />
absorbance compared to the initial plot in DI water.<br />
Plot 8 shows plot <strong>of</strong> percentage change in absorbance as a<br />
function <strong>of</strong> wavelength <strong>for</strong> ammonia. This helps in<br />
understanding the effect <strong>of</strong> the interaction between the sensing<br />
region and the contaminant. Percentage change in absorbance<br />
is defined as<br />
0.5<br />
0.3<br />
Absorbance min. at 540nm<br />
Absorbance min. shifted to 516nm when<br />
exposed to 2.25ppm ammonia<br />
A<br />
conta min ant<br />
A<br />
− A<br />
DIwater<br />
DIwater<br />
400 600 800 1000<br />
Wavelength, nm<br />
Fig. 6 Plot <strong>of</strong> Absorbance vs. Wavelength when sensor S1 was<br />
exposed to A: DI water; B: 2ppm; C: 4ppm; D: 6ppm; E: 8ppm; F:<br />
10ppm; G: 12ppm; H: 14ppm; I: 16ppm solutions <strong>of</strong> ammonia.<br />
Hence the sensor developed can be used to detect ammonia to<br />
a concentration down to 18ppm. Another sensor with the same<br />
configuration was made but without the 0.1M HCl solution.<br />
This gives a uni<strong>for</strong>m blue colored layer <strong>of</strong> Polyaniline in its<br />
Emeraldine base <strong>for</strong>m. Such a sensor can be used to detect any<br />
acid that maybe present in water. In this case HCl was used as<br />
the contaminant. Fig. 7 shows the plot between absorbance<br />
and wavelength <strong>for</strong> various concentrations <strong>of</strong> HCl as<br />
contaminant. Plot A is obtained when the sensor is introduced<br />
into DI water and as concentration <strong>of</strong> HCl contaminant is<br />
added the absorbance minimum shifts from 430nm to 530 nm<br />
which belongs to green region <strong>of</strong> visible spectrum. The<br />
amount <strong>of</strong> HCl required to saturate the sensor can be seen<br />
from fig. 7 to be around 116ppm. This suggests that less<br />
amount <strong>of</strong> ammonia is required to saturate the sensor than<br />
HCl. It is speculated that the presence <strong>of</strong> gas permeable layer<br />
over the Polyaniline material is the cause <strong>of</strong> this variation. The<br />
+<br />
gas permeable layer is partially blocking some <strong>of</strong> the H 3<br />
O<br />
ions from interacting with the Polyaniline material, hence<br />
increasing the selectivity <strong>of</strong> the sensor towards <strong>Ammonia</strong>.<br />
1.1<br />
A<br />
B<br />
C<br />
D<br />
E<br />
F<br />
G<br />
Where,<br />
A<br />
DIWater<br />
and<br />
conta ant<br />
A<br />
min<br />
are absorbance values <strong>of</strong><br />
the 2 sensors when exposed to DI water and contaminant<br />
solution, respectively.<br />
Normalized Absorbance<br />
0 .4<br />
0 .2<br />
0 .0<br />
- 0 .2<br />
- 0 .4<br />
A<br />
B<br />
C<br />
D<br />
E<br />
F<br />
G<br />
H<br />
I<br />
4 0 0 6 0 0 8 0 0 1 0 0 0<br />
W a v e le n g th , n m<br />
P e a k a t 7 6 0 n m<br />
Fig. 8 Plot <strong>of</strong> %change in Absorbance vs. Wavelength when sensor<br />
S1was exposed to A: DI water; B: 2ppm; C: 4ppm; D: 6ppm; E:<br />
8ppm; F: 10ppm; G: 12ppm; H: 14ppm; I: 16ppm solutions <strong>of</strong><br />
ammonia.<br />
As was observed from fig. 8, the sensor starts saturating when<br />
exposed to 18ppm <strong>of</strong> ammonia and above and is completely<br />
saturated at a concentration <strong>of</strong> 30ppm. This plot shows that the<br />
maximum change <strong>of</strong> 0.15 in absorbance is obtained at the<br />
wavelength <strong>of</strong> 760nm. A similar plot <strong>for</strong> HCl was obtained as<br />
shown in fig. 9.<br />
0.4 A<br />
B<br />
C<br />
D<br />
E<br />
F<br />
G<br />
Absorbance<br />
0.9<br />
% change in absorbance<br />
0.2<br />
0.0<br />
0.7<br />
-0.2<br />
0.5<br />
400 600 800 1000<br />
Wavelength<br />
400 600 800 1000<br />
W avelength<br />
Fig. 7 Plot <strong>of</strong> Absorbance vs. Wavelength when sensor S2 was<br />
exposed to A: DI water; B: 58ppm; C: 116ppm; D: 174ppm; E:<br />
232ppm; F: 290ppm; G: 348ppm solutions <strong>of</strong> HCl.<br />
Fig. 9 Plot <strong>of</strong> %change in Absorbance vs. Wavelength when sensor<br />
S2 was exposed to A: 58ppm; B: 116ppm; C: 174ppm; D: 232ppm;<br />
E: 290ppm; F: 348ppm; G: 408ppm solutions <strong>of</strong> HCl.<br />
4 Copyright © 2008 by ASME
Here, the maximum change is observed at 610nm but<br />
saturation is achieved much later unlike in case <strong>of</strong> ammonia<br />
which emphasizes the assumption that the gas permeable layer<br />
+<br />
is blocking O ions. Figure 10 and 11 show percentage<br />
H 3<br />
change in absorbance as a function <strong>of</strong> concentration. It can be<br />
seen that sensor which is exposed to ammonia saturates at a<br />
concentration <strong>of</strong> 30ppm <strong>for</strong> ammonia and in case <strong>of</strong> HCl the<br />
saturation is not reached even at 400ppm. Two different test<br />
runs were per<strong>for</strong>med <strong>for</strong> the ammonia sensor as shown in<br />
Fig.11; the second test was done 24 hours later from the first<br />
one.<br />
Normalized Absorbance <strong>for</strong> hcl<br />
Normalized Absorbance <strong>for</strong> <strong>Ammonia</strong><br />
0<br />
-0.05<br />
-0.1<br />
-0.15<br />
-0.2<br />
-0.25<br />
-0.3<br />
Fig. 10 Plot <strong>of</strong> normalized change in absorbance as a function <strong>of</strong><br />
concentration <strong>for</strong> HCl.<br />
0.7<br />
0.6<br />
0.5<br />
0.4<br />
0.3<br />
0.2<br />
0.1<br />
0<br />
0 200 400 600<br />
Fig. 11 Plot <strong>of</strong> normalized change in absorbance as a function <strong>of</strong><br />
concentration <strong>for</strong> <strong>Ammonia</strong>.<br />
8. Conclusion<br />
y = -0.0005x - 0.0803<br />
R² = 0.9266<br />
Concentration<br />
R² = 0.9834<br />
R² = 0.9794<br />
610nm<br />
Linear<br />
(610nm)<br />
First run<br />
Second run<br />
Poly. (First run)<br />
Poly. (Second run)<br />
0 10 20 30 40 50<br />
Concentration (ppm)<br />
Two different sensors are developed one each <strong>for</strong> ammonia<br />
and HCl, respectively. The sensor was saturated by ammonia<br />
with a concentration as small as 30ppm whereas in case <strong>of</strong><br />
HCl the saturation was not reached even at 400ppm suggesting<br />
that the gas permeable layer on Polyaniline is blocking all the<br />
ions. <strong>Ammonia</strong> and HCl could be detected to a concentration<br />
as low as 2ppm and 58ppm, respectively. Further work needs<br />
to be done to determine the minimum concentration that can<br />
be detected by bending the fiber cable.<br />
9. References<br />
1. M. A. El-Sherif, “An Apparatus and a Method<br />
Comprising an <strong>Optic</strong>al <strong>Fiber</strong> Modulator, Coupler,<br />
Switch, <strong>Sensor</strong>, and Distribution System,” U.S.<br />
Patent 5 060 307, Oct. 22, 1991.<br />
2. J. Yuan, “Development <strong>of</strong> Smart Structures Utilizing<br />
Chromogenic Materials <strong>for</strong> <strong>Optic</strong>al <strong>Fiber</strong> <strong>Sensor</strong>,”<br />
M.S. thesis, Drexel Univ., Philadelphia,PA, 1997.<br />
3. M. A. El-Sherif, “On-<strong>Fiber</strong> sensor and modulator,”<br />
IEEE Trans. Instrum. Meas., vol. 38, pp. 595–598,<br />
Apr. 1989.<br />
4. M. A. El-Sherif and J. Yuan, “Development <strong>of</strong> a<br />
novel class <strong>of</strong> fiber optic sensors <strong>for</strong> environmental<br />
field measurements,” in International Conference on<br />
Agropoles and Agro-industrial Technological Parks,<br />
Barretos, Sao Paulo, Brazil, Nov. 15–21, 1999.<br />
5. A. D. Kersey, “A review <strong>of</strong> recent developments in<br />
fiber optic sensor technology,” Opt. <strong>Fiber</strong> Technol.,<br />
vol. 2, pp. 291–317, 1996.<br />
6. T. G. Giallorenzi, J. A. Bucaro, A. Dandrige, G. H.<br />
Sigel, J. H. Cole Jr, and S. C. Rashleigh, “<strong>Optic</strong>al<br />
fiber sensor technology,” J. Quantum Electron., vol.<br />
QE-18-4, pp. 626–665, 1982.<br />
7. R. Narayanaswamy, “Current developments in<br />
optical biochemical sensors,” Biosens. Bioelectron.,<br />
vol. 6, pp. 467–475, 1991.<br />
8. Xiaojing Liu and Weihong Tan, “A <strong>Fiber</strong>-<strong>Optic</strong><br />
Evanescent Wave DNA Biosensor Based on Novel<br />
Molecular Beacons”, Anal. Chem. 1999, 71, 5054-<br />
5059.<br />
9. M. A. El-Sherif, J. Yuan, and A. G. MacDiarmid,<br />
“<strong>Fiber</strong> optic sensors and smart fabrics,” J. Intell.<br />
Mater. Syst. Structures, vol. II, no. 5, pp. 407–414,<br />
May 2000.<br />
10. Jaroslav Stejskal, Irina Sapurina, “Polyaniline: Thin<br />
Films and Colloidal Dispersions”, Pure and Applied<br />
Chemistry, Vol.77, No.5, pp. 815-826, 2005.<br />
11. Jianming Yuan and Mahmoud A. El-Sherif, “<strong>Fiber</strong>-<br />
<strong>Optic</strong> Chemical <strong>Sensor</strong> Using Polyaniline as<br />
Modified Cladding Material”, IEEE <strong>Sensor</strong>s Journal,<br />
Vol. 3, No. 1, February 2003.<br />
12. Zhe Jin, Yongxuan Su, Yixiang Duan, “An improved<br />
optical pH sensor based on Polyaniline”, <strong>Sensor</strong>s and<br />
Actuators B 71 (2000) 118-122.<br />
13. Stejskal J.; Sapurina I.; Prokes J.; Zemek J., “In-Situ<br />
Polymerized Polyaniline films”, Synthetic Metal,<br />
Vol.105, No.3, Sep. 1999, pp.195-202<br />
5 Copyright © 2008 by ASME