Investment appraisal of mining capital projects - PwC
Investment appraisal of mining capital projects - PwC
Investment appraisal of mining capital projects - PwC

You also want an ePaper? Increase the reach of your titles
YUMPU automatically turns print PDFs into web optimized ePapers that Google loves.
pwc.com.au<br />
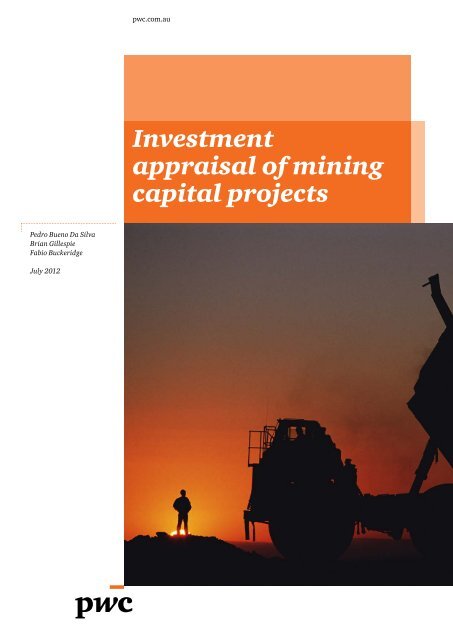
<strong>Investment</strong><br />
<strong>appraisal</strong> <strong>of</strong> <strong>mining</strong><br />
<strong>capital</strong> <strong>projects</strong><br />
Pedro Bueno Da Silva<br />
Brian Gillespie<br />
Fabio Buckeridge<br />
July 2012
Contents<br />
Introduction 01<br />
The case for global portfolio optimisation 02<br />
Linking growth plans to strategy 03<br />
Phased project planning 04<br />
Identifying investment alternatives 05<br />
Selecting the investment alternatives 06<br />
Bringing it all together 07<br />
Integrating risk and uncertainty 09<br />
Maintaining the rigour in boom times 10<br />
Conclusion 11<br />
Mining Excellence@<strong>PwC</strong> 12
Introduction<br />
The level <strong>of</strong> growth in the <strong>mining</strong> industry correlates strongly with the growth<br />
<strong>of</strong> the broader global economy although with a noticeable lag in time. The<br />
globalisation <strong>of</strong> commodity markets now drives the approach to investment<br />
<strong>appraisal</strong> <strong>of</strong> major <strong>capital</strong> <strong>projects</strong>.<br />
Advancements in trade agreements, information systems, <strong>mining</strong> technology<br />
and human <strong>capital</strong> exchange are assisting <strong>mining</strong> companies <strong>of</strong> all sizes to<br />
diversify into an increasing range <strong>of</strong> countries and territories.<br />
Operating a global asset portfolio requires continual effort to be expended on<br />
portfolio optimisation. This is at its most complicated when considering major<br />
<strong>capital</strong> <strong>projects</strong> situated across both developed and developing nations.<br />
Whitepaper June 2012 1<br />
June 2012 1
The case for global<br />
portfolio optimisation<br />
It is likely that the highest<br />
proportion <strong>of</strong> <strong>capital</strong> investments<br />
over the next two decades will be<br />
in rapidly developing territories<br />
such as Latin America, Western and<br />
Central Africa, China and countries<br />
that were formerly part <strong>of</strong> the Soviet<br />
Union. Many companies will enter<br />
into unfamiliar areas <strong>of</strong> the world<br />
resulting in increasingly diverse<br />
asset portfolios.<br />
Sovereign risk metrics are now a<br />
common input to financial models<br />
alongside currency hedges and<br />
infrastructure costs. In theory, this<br />
should allow a potential project in<br />
Mozambique to be easily compared<br />
to another in Australia and yet<br />
another in Brazil. In practice, such<br />
comparisons are <strong>of</strong>ten made using<br />
a number <strong>of</strong> qualitative assessments.<br />
The aim <strong>of</strong> the top tier global<br />
resource sector companies is to<br />
manage a robust portfolio focused<br />
on the long term growth plan but<br />
can also deal with the changes<br />
in local operating conditions and<br />
global market movements. In this<br />
way an organisation should hope<br />
to have a portfolio with strong<br />
alignment to both their long term<br />
growth plan and shorter term<br />
financial and operational objectives.<br />
At the highest level, asset portfolios<br />
should maintain an A grade credit<br />
rating and deliver a steady dividend<br />
stream to shareholders.<br />
However many organisations<br />
can compromise their long term<br />
growth plans by adopting a singular<br />
<strong>appraisal</strong> approach to each project<br />
under consideration.<br />
A singular approach, no matter how<br />
robust, has the potential to knock out<br />
high potential value at many stages in<br />
the investment review lifecycle. In the<br />
current environment, it is common<br />
that shortages <strong>of</strong> qualified labour, long<br />
lead times for specialist equipment<br />
delivery and high sovereign risk factors<br />
can all sink a project with an otherwise<br />
attractive value. This is particularly sub<br />
optimal when an organisation seeks to<br />
maintain as much flexibility as possible<br />
across its growth portfolio while<br />
understanding and managing the<br />
aggregate demands on working <strong>capital</strong>.<br />
Many organisations remain at a<br />
modest stage <strong>of</strong> maturity in terms<br />
<strong>of</strong> how they evaluate investment<br />
alternatives, prioritise their <strong>capital</strong><br />
allocation and measure the overall<br />
position <strong>of</strong> their portfolios.<br />
There are many potential<br />
consequences <strong>of</strong> poor portfolio<br />
optimisation:<br />
• Misalignment <strong>of</strong> stakeholders’<br />
expectations <strong>of</strong> risk pr<strong>of</strong>ile<br />
• Misalignment <strong>of</strong> shareholders’<br />
expected return on<br />
equity investment<br />
• Poor long term working<br />
<strong>capital</strong> forecasts leading to<br />
credit downgrades or lumpy<br />
dividend streams.<br />
The principle reason<br />
why some companies<br />
are consistently<br />
successful in portfolio<br />
management <strong>of</strong> <strong>capital</strong><br />
<strong>projects</strong> is due to their<br />
strict adherence to<br />
a standard <strong>appraisal</strong><br />
methodology.<br />
2<br />
<strong>Investment</strong> <strong>appraisal</strong> <strong>of</strong> <strong>mining</strong> <strong>capital</strong> <strong>projects</strong>
Linking growth<br />
plans to strategy<br />
Establishing the link between the<br />
strategic objectives <strong>of</strong> a company<br />
and the portfolio growth plan<br />
provides the shareholders and the<br />
market with a fuller explanation <strong>of</strong><br />
the direction <strong>of</strong> that organisation.<br />
Most top tier <strong>mining</strong> companies have<br />
clearly stated strategic objectives.<br />
In BHP Billiton’s case; two key goals<br />
are to own a portfolio <strong>of</strong> assets<br />
that have diversity across markets,<br />
commodities and geography and<br />
that are long life, large, low cost,<br />
expandable and upstream. These are<br />
the strategic objectives that shape the<br />
growth plan <strong>of</strong> new <strong>capital</strong> <strong>projects</strong>.<br />
Rio Tinto has also demonstrated a<br />
strategic focus on transforming their<br />
<strong>capital</strong> portfolio <strong>of</strong> <strong>projects</strong> through<br />
a disciplined portfolio management<br />
approach with a focus on high return<br />
production creep and modernisation<br />
<strong>projects</strong> while delivering cost and<br />
productivity improvements.<br />
This focused strategy aims to reshape<br />
the portfolio <strong>of</strong> <strong>projects</strong> resulting in<br />
efficient operations, reduced carbon<br />
footprint, and modern, large scale,<br />
long life assets in the first and second<br />
quartile on the industry cost curve<br />
For a large global company operating<br />
without a clearly articulated<br />
growth plan, there is considerable<br />
opportunity for wasted effort as<br />
individual business units pursue<br />
potential <strong>projects</strong> that are not<br />
consistent with the growth plan.<br />
Seemingly attractive <strong>projects</strong> at the<br />
business unit level can waste tens<br />
<strong>of</strong> millions <strong>of</strong> investment dollars in<br />
feasibility studies due to a lack <strong>of</strong><br />
visibility or clarity <strong>of</strong> the corporate<br />
growth plan.<br />
Alignment can also provide<br />
subsidiaries with a unified corporate<br />
objective and focus. The integration<br />
between head <strong>of</strong>fice strategy and<br />
subsidiaries’ strategies is critical to<br />
align portfolio development with long<br />
term expectations <strong>of</strong> shareholders.<br />
This is a common point highlighted by<br />
CFOs <strong>of</strong> global <strong>mining</strong> companies.<br />
Figure 1: Strategic alignment <strong>of</strong> business unit growth plans<br />
1 2 3<br />
Environment Review Strategic Alignment Business Unit Strategic Plan<br />
Industry<br />
Markets<br />
Competitors<br />
Customers<br />
Products<br />
Stakeholders<br />
Corporate Strategy<br />
Alignment<br />
Business Unit<br />
Strategy Refreshed<br />
Capital Prioritisation<br />
Capital Allocation<br />
Growth Plan Alignment<br />
Portfolio Optimisation<br />
Performance Goals<br />
June 2012 3
Phased project<br />
planning<br />
Mining companies must have<br />
strong frameworks in place for the<br />
evaluation and prioritisation <strong>of</strong> their<br />
portfolio investment alternatives.<br />
A structured approach to assessing<br />
individual <strong>projects</strong> is the first step<br />
to ensure rigorous evaluation with<br />
investment decisions made on sound<br />
financial, social, environmental and<br />
sustainable development analysis.<br />
In Rio Tinto’s case, the focus is on<br />
the highest quality options through<br />
a disciplined <strong>capital</strong> phased<br />
approval process while allocating<br />
cash for investment through each<br />
investment cycle.<br />
A ‘stage gate’ or ‘toll gate’ is the entry<br />
or approval point for the next project<br />
evaluation stage. Varying degrees <strong>of</strong><br />
rigour are required depending on the<br />
level <strong>of</strong> <strong>capital</strong> under consideration.<br />
For most major <strong>mining</strong> companies,<br />
formal toll gating is required for all<br />
major <strong>capital</strong> <strong>projects</strong> although the<br />
definition <strong>of</strong> a major <strong>capital</strong> project<br />
itself does vary. Typically though,<br />
any project requiring upwards <strong>of</strong><br />
$500million investment would be<br />
considered a major <strong>capital</strong> project by<br />
all top tier <strong>mining</strong> companies.<br />
A key component <strong>of</strong> stage gating<br />
is to clearly assign accountabilities<br />
at each stage. It is a formal process<br />
that ensures all stakeholders clearly<br />
understand the impact <strong>of</strong> approving<br />
funds and resources to the next<br />
evaluation stage, and ultimately,<br />
the project.<br />
Figure 2: Stage gating terminology used by major <strong>mining</strong> companies<br />
Anglo Coal<br />
Xstrata Coal<br />
Vale<br />
Concept Pre-feasability Feasability Implementation<br />
Rio Tinto<br />
Order <strong>of</strong><br />
magnitude<br />
Pre-feasability<br />
Detailed<br />
feasability<br />
Implementation<br />
Peabody<br />
Concept<br />
Front End<br />
Engineering<br />
Detailed Design<br />
Construction<br />
BHP Biliton<br />
Indentification Selection Definition Implementation<br />
Methodical and phased approach:<br />
• Establish a formal approach to portfolio optimisation<br />
based on consistency and a strong structure<br />
• Identify and assess the key portfolio risks as part<br />
<strong>of</strong> the stage gate process<br />
• Communicate the strategic objective <strong>of</strong> each stage<br />
to all individuals involved<br />
• Assign clear accountabilities to key stakeholders.<br />
4<br />
<strong>Investment</strong> <strong>appraisal</strong> <strong>of</strong> <strong>mining</strong> <strong>capital</strong> <strong>projects</strong>
Identifying investment<br />
alternatives<br />
Prior to any portfolio consideration,<br />
potential <strong>projects</strong> should be considered<br />
for basic financial feasibility.<br />
A portfolio approach at a minimum<br />
should rank <strong>projects</strong> on such metrics<br />
as NPV, IRR and Capital Efficiency<br />
Ratio. Good methodologies will<br />
also include key indicators such as<br />
cost curve percentile, margin curve<br />
percentile, future option value and<br />
a metric representing some internal<br />
measure <strong>of</strong> strategic fit. The best<br />
methodologies will also identify and<br />
quantify key enablers or the drivers<br />
<strong>of</strong> cost and margin.<br />
Most major organisations will at this<br />
point also evaluate the likely project<br />
position on relevant industry cost<br />
and margin curves. Best practice<br />
organisations will go one step further<br />
and evaluate project risk, strategic<br />
fit and any major dependencies<br />
such as enabling infrastructure.<br />
As an example, BHP which has the<br />
biggest global pipeline <strong>of</strong> <strong>capital</strong><br />
<strong>projects</strong>, considers all these factors<br />
when undertaking initial project<br />
evaluation.<br />
This initial project evaluation<br />
should give a strong picture <strong>of</strong> the<br />
robustness <strong>of</strong> the project as a standalone<br />
proposition with the only<br />
portfolio assumptions at this stage<br />
being the delivery <strong>of</strong> any other major<br />
<strong>projects</strong> deemed as critical enablers.<br />
Figure 3: Ranking and prioritising future growth options for further<br />
study based on strategy, value and dependencies<br />
High<br />
Corporate Fit<br />
Priority <strong>projects</strong><br />
Low<br />
Capital Efficiency Ratio<br />
High<br />
June 2012 5
Selecting the investment<br />
alternatives<br />
Major <strong>mining</strong> companies use a<br />
variety <strong>of</strong> decision rules such as<br />
benchmarking and option analysis<br />
when analysing <strong>capital</strong> investment.<br />
Best practice requires the early<br />
development <strong>of</strong> a comprehensive<br />
study with option analysis that can<br />
be carried through to the execution<br />
stage with modification as required.<br />
Interactive workshops with<br />
operational and business unit<br />
stakeholders at the early stages <strong>of</strong><br />
options development is a practical<br />
starting point to develop a realistic<br />
set <strong>of</strong> opportunities and choices for<br />
any particular investment.<br />
Framing investment alternatives at<br />
an early stage is designed to highlight<br />
the following :<br />
• How might the alternatives affect<br />
the portfolio?<br />
• Which alternatives do we really<br />
need to approve?<br />
• What are the <strong>capital</strong> requirements?<br />
• What is the impact on logistics,<br />
such as rail and port capacities?<br />
• What is the potential<br />
incremental value?<br />
• What major site infrastructure will<br />
be required?<br />
• What type <strong>of</strong> workforce will be<br />
required?<br />
This evaluation process should<br />
become a structured approach<br />
to deducing and quantifying the<br />
most noteworthy matters related<br />
to the investment case and should<br />
provide a logical path to arriving<br />
at the most attractive options.<br />
It should also enable the full array<br />
<strong>of</strong> possible risks and constraints to<br />
be identified, from localised<br />
operational matters to changes in the<br />
global market environment.<br />
A key tenet in this analytical<br />
progression is that investment<br />
alternatives are aligned with the<br />
growth plan and the strategic goals<br />
<strong>of</strong> the company.<br />
This process ensures a robust<br />
consensus <strong>of</strong> the alternatives<br />
reducing the likelihood <strong>of</strong> costly and<br />
time-consuming rework.<br />
Figure 4: Framing the opportunity encourages creative thinking to capture all strategic drivers and objectives<br />
to select a preferred option<br />
Opportunity framing<br />
Opportunity realisation<br />
High level<br />
mine schedule<br />
Economic<br />
evaluation<br />
Alternation<br />
ranking<br />
Alternating<br />
selection<br />
Go forward<br />
alternative<br />
Capital and<br />
operating cost<br />
Risk<br />
evaluation<br />
Sensitivity<br />
analysis<br />
Benchmarking<br />
Production<br />
pr<strong>of</strong>iles<br />
HSEC<br />
evaluation<br />
Marketing<br />
assumptions<br />
Configuration<br />
assumptions<br />
Financial<br />
Assumptions<br />
6<br />
<strong>Investment</strong> <strong>appraisal</strong> <strong>of</strong> <strong>mining</strong> <strong>capital</strong> <strong>projects</strong>
Bringing it<br />
all together<br />
Optimising a portfolio requires<br />
an organisation to maintain<br />
alignment to business objectives<br />
and ensure <strong>projects</strong> are still<br />
integrated with the growth plan.<br />
Project sponsors must be able to<br />
effectively report any deviations<br />
or changes to project scope to<br />
senior stakeholders. In the event<br />
<strong>of</strong> adjustments arising in the<br />
execution phases, there should<br />
be a defined process to rigorously<br />
manage these changes. This process<br />
should incorporate analysis <strong>of</strong> both<br />
direct and indirect impacts on the<br />
outcome <strong>of</strong> the project and on the<br />
optimisation <strong>of</strong> the portfolio.<br />
Strong portfolios tend to have<br />
regular independent reviews across<br />
the portfolio. It is critical that key<br />
stakeholders are well informed on the<br />
progress <strong>of</strong> all <strong>projects</strong> at all times.<br />
Figure 5: Portfolio management focuses attention on closing the gap<br />
between anticipated performance and strategic goals<br />
US $ M<br />
2000<br />
1500<br />
1000<br />
Target<br />
Gap closure<br />
Target<br />
Gap closure<br />
500<br />
0<br />
Historical<br />
Forward looking<br />
Qtr 1 Qtr 2 Qtr 3 Qtr 4 Qtr 1 Qtr 2 Qtr 3 Qtr 4 Qtr 1<br />
Quarters<br />
Forecast<br />
Budget<br />
In 2010, the <strong>PwC</strong> global review <strong>of</strong> <strong>mining</strong><br />
trends found that over the past decade,<br />
only 2.5% <strong>of</strong> major <strong>capital</strong> <strong>projects</strong> in the<br />
<strong>mining</strong> sector were successfully achieved<br />
across the critical dimensions <strong>of</strong> schedule,<br />
cost, scope, and business benefits.<br />
A portfolio model ought to be able to<br />
integrate all pre‐selected investment<br />
alternatives and future value options.<br />
June 2012 7
D J B G H C I<br />
E F C Short-term Capacity<br />
D J B G H C I E F A Rail Line<br />
30<br />
G H A Rail Line B Rail Line C Rail Line<br />
300<br />
160<br />
25<br />
140<br />
N X AG SUM (D:BJ) 250<br />
Sales Revenue - Cash Stream 1 US$M<br />
Operating Cost - Cash Stream 2 US$M<br />
Cum Underlying Asset - Nominal US$ Million Nominal net cashflow <strong>of</strong> underlying asset - nominal US$ million nominal<br />
20<br />
120<br />
Capital Cost - Cash Stream 3 US$M<br />
Taxes and Royalty - Cash Stream 4 US$M<br />
200<br />
Net Cashflow <strong>of</strong> Underlying Asset - Real US$M<br />
1,500<br />
100<br />
1,500<br />
15<br />
150<br />
1,000<br />
80<br />
60<br />
10<br />
100<br />
1,000<br />
500<br />
40<br />
50<br />
0<br />
5<br />
20<br />
500<br />
0<br />
-500<br />
0<br />
0<br />
FY11 FY12 FY13 FY14 FY15 FY16 FY17 FY18 FY19 FY20<br />
FY11 FY12 FY13 FY14 FY15 FY16 FY17 FY18 FY19 FY20<br />
FY1 FY2 FY3 FY4 FY5 FY6 FY7 FY8 HQCC/HCC FY9 FY10 FY11 FY13 FY14 FY15 FY16 FY17<br />
US$/tonne<br />
-1,000<br />
-<br />
SSCC<br />
US$/tonne<br />
-1,500<br />
C Short-term Thermal Capacity B Rail Line<br />
G H C Rail Line<br />
Y Z Capacity Terminale<br />
US$/tonne<br />
80<br />
0 25 50 75 (500) 100 125<br />
100<br />
60<br />
-2,000<br />
90<br />
70 CER 0.5<br />
Production (Mt)<br />
Production (Mt)<br />
-2,500<br />
1,500<br />
CER 0.1<br />
50<br />
80<br />
(1,000)<br />
60<br />
-3,000<br />
70<br />
40<br />
50<br />
60<br />
Total Stripping Cost ($/bcm)<br />
Mining Cost - Underground and Opencut ($/t)<br />
-3,500<br />
Processing Costs ($/t)<br />
Minesite Cash (1,500) Cost (4/t)<br />
1,000<br />
Project Group 1, 8<br />
Project 1 Project 2<br />
50<br />
Project 3 Project 4 Project 5 Project 6 Project 1 Project 2 Project 3 Project 4 Project 5 30<br />
40<br />
Project 6 Project 1 Project 2 Project 3 Project 4 Project 5 Project 6 Project 1 Project 2 Project 3 Project 4 Project 5 Project 6<br />
40<br />
30<br />
20<br />
10<br />
-<br />
60<br />
50<br />
40<br />
30<br />
20<br />
10<br />
0<br />
700<br />
FY11 FY12 FY13 FY14 FY15 FY16 FY17 FY18 FY19 FY20<br />
600<br />
500<br />
400<br />
300<br />
200<br />
100<br />
0<br />
Coal Sales Revenue - HQHCC (Product 1) US$ Million Real<br />
Coal Sales Revenue - PCI (Product 4) US$ Million Real<br />
Total Plant Production Mt<br />
Capacity<br />
Terminal<br />
Coal Sales Revenue - SHCC / SSCC (Product 3) US$ Million Real<br />
Coal Sales Revenue - Thermal (Product 5) US$ Million Real<br />
FY11 FY12 FY13 FY14 FY15 FY16 FY17 FY18 FY19 FY20<br />
8.00<br />
7.00<br />
6.00<br />
5.00<br />
4.00<br />
3.00<br />
2.00<br />
1.00<br />
0.00<br />
20<br />
10<br />
0<br />
55<br />
45<br />
35<br />
25<br />
15<br />
5<br />
-5<br />
30<br />
Sales Revenue - Cash Stream 1 US$M<br />
Total Operating Cost - Stripping A$ Million Real<br />
Total Project Plant Group Production 6, 6 Mt Total Growth Capex US$M Total Sustaining Capex US$M<br />
Total Operating Cost - Mining A$ Million Real<br />
Total Operating Cost - Processing A$ Million Real 20<br />
Project Group 3, 9<br />
Total Closure Cost A$ Million Real<br />
Total Cost - Rail A$ Million Real<br />
500<br />
Total Cost - Offload and Port A$ million real<br />
Total Operating Cost - Indirects A$ million real<br />
1,600<br />
FOB Margin excluding Royalties<br />
10<br />
Project Group 4, 5<br />
1,400<br />
0<br />
FY11 FY12 FY13 FY14 FY15 FY16 FY17 FY18 FY19 FY20<br />
FY11 FY12 1,400 FY13 FY14 FY15 FY16 FY17 FY18 FY19 FY20<br />
0<br />
1,200<br />
1,200<br />
Project Group 5, 4<br />
YYY ZZZ XYZ Terminal<br />
XYZ Capacity Ports<br />
Project Group 7, 5<br />
1,000<br />
Project Group 2, 7<br />
60<br />
1,000<br />
- 2,000 4,000 6,000 8,000 10,000 12,000 14,000<br />
-500<br />
800<br />
600<br />
400<br />
200<br />
0<br />
FY11 FY12 FY13 FY14 FY15 FY16 FY17 FY18 FY19 FY20<br />
-1,000<br />
50<br />
40<br />
30<br />
20<br />
10<br />
0<br />
800<br />
600<br />
400<br />
200<br />
0<br />
Capex Growth (US$M Nominal 100% Share)<br />
FY11 FY12 FY13 FY14 FY15 FY16 FY17 FY18 FY19 FY20<br />
8.00<br />
7.00<br />
6.00<br />
5.00<br />
4.00<br />
3.00<br />
2.00<br />
1.00<br />
0.00<br />
It is therefore critical that all<br />
stakeholders understand the<br />
intricacies <strong>of</strong> portfolio optimisation.<br />
The best way to speed up an<br />
investment is to front end load as<br />
much <strong>of</strong> the feasibility study as<br />
possible and effectively plan the<br />
concept and feasibility phases. This<br />
makes it easier to ensure that the<br />
project will fit with the portfolio,<br />
particularly from a timing perspective<br />
around capex requirements.<br />
Once a robust identification<br />
process has been put in place and<br />
the investment alternatives are<br />
narrowed, stakeholders must then<br />
measure and rank all reasonable<br />
value creating options.<br />
This process should be followed by<br />
a ranking procedure, evaluating<br />
<strong>projects</strong> based on the pre-established<br />
KPIs that are aligned to corporate<br />
strategy such as NPV, IRR, Capital<br />
Efficiency Ratio, operational drivers,<br />
cost curve percentile, margin curve<br />
percentile and strategic fit.<br />
A portfolio model should integrate all<br />
pre-selected investment alternatives<br />
and future value options, ranking<br />
<strong>projects</strong> by their respective return<br />
rates. Amalgamated dashboards can<br />
be used to summarise the entire value<br />
<strong>of</strong> the portfolio and highlight further<br />
constraints.<br />
Figure 6: New approaches to portfolio management are essential if<br />
returns are to be maintained<br />
From<br />
Non-integrated<br />
Finance owned<br />
Process<br />
Ownership<br />
To<br />
Strategically grounded<br />
Collaborative across divisions and units<br />
Spreadsheet driven<br />
System Integrated systems<br />
Static, finance focus<br />
Siloed, inconsistent<br />
Cost Curve<br />
Dashboard 4 : Benchmarking<br />
Outlook<br />
Data<br />
Delivering<br />
Higher quality and value<br />
Better, faster decision-making<br />
Greater efficiency and lower cost<br />
Improved control and compliance<br />
Margin Curve<br />
Dynamic, financial and operational focus<br />
Integrated, Transparent<br />
Figure 7: A holistic portfolio model enables project ranking,<br />
prioritisation, internal and external benchmarking and links<br />
to potential infrastructure bottlenecks<br />
120<br />
100<br />
Dashboard 5 : Rail and Port Capacity<br />
Project Comparison<br />
First Coal<br />
Free on Board<br />
Capex<br />
Internal Rate <strong>of</strong><br />
Total Tonnage Max Tonnes<br />
Last Coal Free on Rail<br />
Strip Ratio Mine Cash 90Costs<br />
Yield Rail Port Approx. NPV<br />
(inc. Dev)<br />
(exc. Royalties)<br />
Growth<br />
Return Capital<br />
Payback Period<br />
A$ / Prod t A$ / Prod t<br />
Strip<br />
Mining Process A$ / Indirects<br />
Avg<br />
A$ / t<br />
US$ M<br />
US$ M<br />
Efficiency Ratio<br />
100<br />
Project Product Mt Product Mt Year Year<br />
Avg<br />
A$ / t Railed<br />
A$ / Prod t<br />
% Real<br />
Real<br />
Real<br />
A$ / Bcm A$ / ROM t Feed t A$ / Prod t<br />
%<br />
Shipped<br />
Real<br />
100%<br />
Production Dashboard 1 : High-Level Project View<br />
Total Capacity Rail Line<br />
Project 1 300 10.0 2015 2080 80.0 90.0 10.0 5.0 16.0 80 7.0 13.0 75% 7.0 4.0 1,500 9.0 250 15% 0.5 15<br />
Project 2 200 6.0 2020 2080 70.0 80.0 11.0 6.0 15.0 8.0 14.0 76% 8.0 5.0 1,600 8.0 350 10% 0.4 10<br />
Project 3 400 8.0 2018 2080 60.0 70.0 0.0 14.0 9.0 15.0 77% 9.0 6.0 2,500 7.0 400 12% 0.3 10<br />
Project 4 100 5.0 2015 2080 60.0 85.0 13.0<br />
70<br />
10.0 16.0 73% 10.0 4.0 2,000 10.0 -200 13% -0.2 11<br />
80<br />
Project 5 Project50 2.0 2021 2080 Project 70.0 1<br />
75.0 7.0 3.0 12.0 11.0 16.0 75% 10.0 5.0 1,500 12.0 -100 18% -0.1 12<br />
Project 6 800 12.0 2021 2080 80.0 95.0 8.0 4.0 10.0 11.0 15.0 79% 9.0 6.0 3,500 10.0 -300 20% -0.1 20<br />
60<br />
Project 7 Value 100 Driver Summary 10.0 2025 2080 80.0 90.0 Payback 10.0 Period 10.0 14.0 80% 8.0 6.0 1,300 13.0Valuation Cash 250Streams<br />
15% 0.2 15<br />
Project 8 120 7.0 2025 2080 70.0 80.0 12.0 9.0 13.0 69% 7.0 5.0 500 15.0 350 6% 0.3 13<br />
Measure Unit FY12 FY12-16 FY17-21 FY22-26 Life<br />
Project 9 400 8.0 2024 2080 60.0 70.0 5.0 2.0 13.0 8.0 12.0 74% 6.0 4.0 1,200 14.0 200 8% 0.4 14<br />
60<br />
50<br />
Project 10 10 1.5 2021 2080 D-H 60.0 I-M 85.0 N-R 9.0 D-AG 5.0 14.0 7.0 11.0 73% 5.0 3.0 1,500 9.0 150 10% 0.5 15<br />
A$/Product Tonne - - 10.0 50.0 35.0<br />
Project 11 FOR 120 2.0 2017 2080 70.0 75.0 15.0 7.0 10.0 79% 4.0 5.0 1,600 8.0 -200 12% -0.2 10<br />
US$/Product Tonne - - 8.0 40.0 28.0<br />
Project 12 140 4.0 2018 2080 80.0 95.0 16.0<br />
40<br />
8.0 11.0 90% 10.0 6.0 2,500 7.0 -300 15% -0.1 10<br />
Project 13 FOB 500 5.0 A$/Product 2019 Tonne 2080 - 80.0 - 90.013.0 12.0 65.0 45.56.0 16.0 9.0 15.0 60% 9.0 4.0 2,000 10.0 -150 6% -0.1 11<br />
40<br />
Project 14 (Excl Royalty) 400 10.0 US$/Product 2020 Tonne 2080 - 70.0 - 80.09.0 11.0 45.0 31.55.0 15.0 10.0 12.0 65% 8.0 4.0 1,500 12.0 250 14% 0.2 12<br />
Project 15 200 5.0 2020 2080 60.0 70.0 14.0 30 11.0 13.0 70% 7.0 5.0 3,500 13.0 350 15% 0.3 20<br />
Project 16 50 2.5 2019 A$M Real 2080 - 60.0 - 85.0 1,950.0 6.8 35.4<br />
13.0 11.0 15.0 80% 5.0 6.0 1,300 10.0 200 6% 0.4 15<br />
Project 17 Total Capex 10 1.5 2018 2080 70.0 75.0 10.0 4.0 12.0 10.0 11.0 85% 6.0 4.0 500 9.0 150 8% 0.5 13<br />
US$M Real - - 1,580.0 5.9 29.3<br />
Project 18 20 1.0 2017 2080 80.0 95.0 11.0 5.0 10.0 20 9.0 14.0 75% 8.0 2.0 1,200 8.0 -200 10% -0.2 14<br />
20 Project 19 150 6.0 2021 2080 70.0 80.0 10.0 8.0 13.0 65% 9.0 3.0 600 10.0 -300 12% -0.1 13<br />
Project 20 250 8.0 2024 2080 - 80.0 - 85.030.0 35.6 35.9<br />
12.0 7.0 12.0 55% 10.0 4.0 800 12.0 -150 15% -0.1 12<br />
Project 21 100 6.5 2025 2080 90.0 90.0 9.0 5.0 13.0 10 8.0 10.0 70% 9.0 5.0 100 15.0 250 6% 0.2 14<br />
Rail Line<br />
Project 22 Price 15 5.0 2025 2080 - 50.0 - 75.0- 12.0 - Rail Line - 6.0 14.0 9.0 15.0 80% 8.0 6.0<br />
Terminal<br />
1,200 13.0 300 14% 0.3 13<br />
Project 23 30 6.5 2021 2080 40.0 80.0 15.0 10.0 13.0 85% 7.0 4.0 3,500 14.0 100 15% 0.4 10<br />
0<br />
- - - - -<br />
0<br />
0 Capital Expenditure 25 and 50 Net Cash Flow 75 Forecast 100 125 150 175 200 225<br />
Project Pr<strong>of</strong>iles<br />
Growth Capital Expenditure<br />
A$/Product Tonne - - 30.0 10.0 9.2<br />
Max<br />
(A$M Real 100% Share)<br />
Cash<br />
Tonnes<br />
Margin<br />
FY12 FY13 FY14 FY15 FY16 FY17 FY18 FY19 FY20 FY21 FY22 Total<br />
US$/Product Tonne<br />
Project 1<br />
- - 22.5 7.5 6.9<br />
10.0 - - - - 500 650 800 700 1,600 1,000 - 5,250<br />
Key Performance Project Indicators 2 6.0 - - - - - - - - - - - -<br />
Project 3 8.0 - A$/Product - Tonne - - - - - 137.5 34.3 - 34.7- - - - - -<br />
Project 4 Mine Site 5.0Cash Costs 500 1,900 1,500 80 580 414 248 82 (84) (250) - 4,970<br />
Project 5 2.0 - US$/Product - Tonne - - 200 - - 128.3 31.6 - 32.0- - - - - 200<br />
Project 6 12.0 600 700 130 150 - - - - - - - 1,580<br />
Project 7 10.0 - - 150 160 50 40 - - - - - 400<br />
2004 2.0 2.0 2.0 2.0 2.0 2.0 2.0 2.0 2.0 2.0 2.0 2.0 2.0 2.0 2.0 2.0 2.0 2.0 2.0 2.0 2.0 2.0 2.0 2.0<br />
Project 8 Sales Revenue 7.0 Breakdown - vs Product - Tonnes - 205 1,500 2,100 120 1,068 Opex Breakdown 1,102 vs Sales Revenue - - 6,095<br />
CAPEX Breakdown vs Product Tonnes<br />
Project 9 8.0 - - - - - - - - - 500 1,500 2,000<br />
2005 2.0 2.0 2.0 2.0 2.0 2.0 2.0 2.0 2.0 2.0 2.0 2.0 2.0 2.0 2.0 2.0 2.0 2.0 2.0 2.0 2.0 2.0 2.0 2.0<br />
Project 10 1.5 - - - - - - 5,000 5,000 - - - 10,000<br />
2006 Project 11 2.0 2.0 2.0 2.0 2.0 - 2.0 - 2.0 - 2.0 -2.0 2.0- 2.0 - 2.0 - 2.0 - 2.0 - 2.0 2.0 - 2.0- 2.0 - 2.0 2.0 2.0 2.0 2.0 2.0 2.0<br />
Project 12 4.0 - - - - - - - - - - - -<br />
2007 Project 13 2.0 2.0 2.0 5.0 2.0 - 2.0 - 2.0 - 2.0 -2.0 2.0- 2.0 - 2.0 - 2.0 - 2.0 - 2.0 2.0 - 2.0- 2.0 - 2.0 2.0 2.0 2.0 2.0 2.0 2.0<br />
Project 14 10.0 - - (1,000) (500) 190 250 1,200 1,100 500 - - 1,740<br />
2008 2.0 2.0 2.0 2.0 2.0 2.0 2.0 2.0 2.0 2.0 2.0 2.0 2.0 2.0 2.0 2.0 2.0 2.0 2.0 2.0 2.0 2.0 2.0 2.0<br />
Project 15 5.0 - - - - - - - 150 600 400 300 1,450<br />
Project 16 2.5 - - - - - - - - - 150 700 850<br />
2009 3.0 Coal Terminal 3.0 3.0 3.0 3.0 3.0 3.0 3.0 3.0 3.0 Coal 3.0 Terminal 3.0 3.0 3.0 3.0 3.0 3.0 3.0 3.0 Terminal 3.0 3.0 3.0 3.0 3.0<br />
Project 17 1.5 - - - - - - - - - - - -<br />
2010 Project 18 3.0 3.0 3.0 1.0 3.0 - 3.0 30 3.0 703.0 3.0 50 3.0 70 3.0 80 3.0 - 3.0 - 3.0 - 3.0 3.0 - 3.0- 3.0 300 3.0 3.0 3.0 3.0 3.0 3.0 3.0<br />
Project 19 6.0 100 190 350 350 350 350 350 350 - - - 2,390<br />
2011 Project 20 3.0 3.0 3.0 8.0 3.0 5 3.0 40 3.0 803.0 120 3.0 3.0- 3.0 - 3.0 - 3.0 - 3.0 - 3.0 3.0 - 3.0- 3.0 245 3.0 3.0 3.0 3.0 3.0 3.0 3.0<br />
Project 21 6.5 40 25 50 20 (10) (40) - - - - - 85<br />
2012<br />
Project 22<br />
4.0 4.0 4.0 4.0 4.0 4.0 4.0 4.0 4.0 4.0 4.0 4.0 4.0 4.0 4.0 4.0 4.0 4.0 4.0 4.0 4.0 4.0 4.0 4.0<br />
5.0 30 150 50 (50) - - - - - - - 180<br />
Project 23 6.5 - 70 210 160 160 - - - - - - 600<br />
2013 4.0 4.0 4.0 4.0 4.0 4.0 4.0 4.0 4.0 4.0 4.0 4.0 4.0 4.0 4.0 4.0 4.0 4.0 4.0 4.0 4.0 4.0 4.0 4.0<br />
2014 Total Capex Growth 5.0 A$M 5.0 5.0 5.01,275 5.0 3,105 5.0 1,5905.0 945 5.0 5.0 3,390 5.03,844 5.0 7,718 5.0 8,450 5.0 3,718 5.0 1,800 5.0 5.0 2,500 5.0 38,335 5.0 5.0 5.0 5.0 5.0 5.0 5.0<br />
Total Sustaining Capex A$M - 40 160 170 180 220 280 330 390 500 2,360<br />
2015 Total Capex A$M5.0 5.0 5.0 5.01,275 5.0 3,145 5.0 1,6805.0 1,105 5.0 5.0 3,560 5.04,024 5.0 7,938 5.0 8,730 5.0 4,048 5.0 2,190 5.0 5.0 3,000 5.0 40,695 5.0 5.0 5.0 5.0 5.0 5.0 5.0<br />
Total Production Pr<strong>of</strong>ile Mt - 5 15 26 30 20 25 40 50 60 70 341<br />
2016<br />
Total Net Cash US$M<br />
5.0 5.0 5.0 5.0 5.0 5.0 5.0 5.0 5.0 5.0 5.0 5.0 5.0 5.0 5.0 5.0 5.0 5.0 5.0 5.0 5.0 5.0 5.0 5.0<br />
(1,200) (3,000) (1,500) (500) (80) (1,000) (4,500) 400 (150) 700 800 (10,030)<br />
FOB Cash Cost US$/Product Tonne<br />
Tonnage (Mt)<br />
Tonnage (Mt)<br />
Tonnage (Mt)<br />
Dashboard 1 : Portfolio View<br />
Revenue (US$M Real)<br />
Tonnage (Mt)<br />
Tonnage (Mt)<br />
Tonnage (Mt)<br />
Product Tonnes (Mt)<br />
FOB Margin US$/Product Tonne<br />
(A$M Real)<br />
Cumulative NPV (US$M)<br />
NPV (US$M 100% Share)<br />
Tonnage (Mt)<br />
Tonnage (Mt)<br />
Tonnage (Mt)<br />
Cash Streams (US$M Real)<br />
CAPEX<br />
Product Tonnes<br />
8<br />
<strong>Investment</strong> <strong>appraisal</strong> <strong>of</strong> <strong>mining</strong> <strong>capital</strong> <strong>projects</strong>
Integrating risk<br />
and uncertainty<br />
A number <strong>of</strong> risk<br />
management activities<br />
should occur at each stage<br />
<strong>of</strong> project evaluation:<br />
• Enhancing the<br />
consideration and<br />
quantification <strong>of</strong> risk<br />
into standard commercial<br />
project evaluation<br />
methodologies<br />
(NPV, IRR, etc.)<br />
• Identifying project<br />
options and impact on<br />
project design and value<br />
• Reviewing uncertainty<br />
around project delivery<br />
parameters<br />
• Review <strong>of</strong> OH&S<br />
compliance parameters<br />
and KPIs<br />
• Sovereign risk from<br />
changes to tax, royalties<br />
or environmental law.<br />
As <strong>projects</strong> become comparable<br />
on a time and value basis, the<br />
risk component must also be<br />
incorporated into the ranking<br />
process. At this stage, analysts<br />
should undertake detailed reviews<br />
<strong>of</strong> any portfolio risks.<br />
Key risks for <strong>mining</strong> <strong>capital</strong> <strong>projects</strong>:<br />
• Change in project scope<br />
• Poor project cost estimations<br />
• Undisciplined project<br />
management approaches<br />
• Unrealistic availability<br />
estimates for labour,<br />
equipment and materials<br />
• Poor understanding <strong>of</strong> <strong>projects</strong>,<br />
and interdependencies<br />
• Lack <strong>of</strong> independent review,<br />
assessment and reporting.<br />
It is important that all stakeholders<br />
understand the possible challenges,<br />
risks and potential returns across the<br />
selection <strong>of</strong> investments.<br />
Key benefits <strong>of</strong> early formal risk<br />
management are:<br />
• Established contingency and<br />
mitigation strategy<br />
• Established risk distribution<br />
modelling<br />
• Increased stakeholder awareness<br />
<strong>of</strong> “unknowns”.<br />
Risk workshops should also be<br />
undertaken to challenge and discuss<br />
the magnitude or materiality <strong>of</strong> the<br />
impact <strong>of</strong> the identified risks to the<br />
portfolio. These workshops should be<br />
attended by both project members and<br />
independent assessors. An integrated<br />
risk register must be maintained and<br />
updated with mitigating actions across<br />
the portfolio.<br />
At both BHP Billiton and Anglo<br />
American, risk and project evaluation<br />
practitioners work closely together<br />
using a number <strong>of</strong> problem-framing<br />
techniques, including workshops and<br />
strategy table discussions.<br />
“Once <strong>projects</strong> have<br />
undertaken a rigorous process<br />
<strong>of</strong> analysis and review, it is<br />
vital for a portfolio to highlight<br />
the connection between risk<br />
and return on investment”<br />
Mike Allen, General Manager Infrastructure<br />
Strategy, Anglo American<br />
Figure 8: An ongoing process <strong>of</strong> identification and mitigation <strong>of</strong> risks<br />
against project value<br />
High<br />
Project Value<br />
Low<br />
Project Risk<br />
Dogs<br />
High<br />
June 2012 9
Maintaining the<br />
rigour in boom times<br />
During commodity price booms or<br />
at times <strong>of</strong> optimism around global<br />
growth, it is tempting for even the<br />
most stringent <strong>of</strong> companies to loosen<br />
their approach to the approval <strong>of</strong><br />
major <strong>capital</strong> investment <strong>projects</strong>.<br />
Even if the basic rationale for the<br />
investment is economically sound,<br />
accelerated investment approval<br />
without robust analysis methods can<br />
result in significant delays and cost<br />
blowouts due to practical problems<br />
around scheduling and procurement.<br />
For a company like BHP with an<br />
extensive number <strong>of</strong> major <strong>capital</strong><br />
<strong>projects</strong> in selection, definition and<br />
execution, maintaining that rigour<br />
across all commodity cycles is vital.<br />
In Rio Tinto’s case the Project<br />
Development and Implementation<br />
(PDI) centralised group is responsible<br />
for partnering with Rio Tinto’s<br />
product groups and business units<br />
to achieve repeatable success in<br />
delivering major <strong>capital</strong> <strong>projects</strong>.<br />
PDI consists <strong>of</strong> a Project Management<br />
Office (PMO) and Project Delivery<br />
Hubs. The PMO is responsible for<br />
developing, delivering, promoting<br />
and governing the standards and<br />
tools for <strong>projects</strong>. The Project<br />
Delivery Hubs are responsible for<br />
managing and delivering sustainable<br />
new business and assets for Rio Tinto.<br />
PDI manages <strong>capital</strong> <strong>projects</strong> on<br />
behalf <strong>of</strong> the business units.<br />
Past experience has proven that the integration <strong>of</strong> the<br />
operating plan with the growth pr<strong>of</strong>ile and execution<br />
<strong>of</strong> these large scale <strong>projects</strong> can be very complex when<br />
coordinating an investment with the portfolio <strong>of</strong> <strong>projects</strong>.<br />
10<br />
<strong>Investment</strong> <strong>appraisal</strong> <strong>of</strong> <strong>mining</strong> <strong>capital</strong> <strong>projects</strong>
Conclusion<br />
The top tier global companies in the <strong>mining</strong> sector are all reasonably<br />
sophisticated around the investment evaluation and comparison <strong>of</strong> <strong>capital</strong><br />
investment opportunities.<br />
For many emerging companies venturing into new geographies, implementing<br />
a robust approach to investment analysis is vital to maintain a healthy growth<br />
portfolio <strong>of</strong> <strong>projects</strong>. Implementation and adherence <strong>of</strong> standard phased approach<br />
will help ensure continuous alignment with growth plans and allow easier<br />
comparison <strong>of</strong> significantly differing <strong>projects</strong> competing for the same <strong>capital</strong>.<br />
This approach is most valuable when <strong>projects</strong> become comparable on a time<br />
and value basis and the many components <strong>of</strong> risk become the deciding factor<br />
when allocating <strong>capital</strong>.<br />
It is most important during boom commodity cycles, when robust approaches<br />
to project <strong>appraisal</strong> <strong>capital</strong> allocation are <strong>of</strong>ten circumvented. Accelerated<br />
investment approval in such circumstances can lead to widely unbalanced<br />
portfolios even when each singular investment is sound.<br />
June 2012<br />
11
Acknowledgements<br />
This paper has been developed following insights gained by <strong>PwC</strong> while<br />
working on major feasibility studies and operational improvement <strong>projects</strong><br />
with Anglo American, BHP Billiton, Peabody, Xstrata Coal and Xstrata Copper.<br />
Jason Economidis <strong>of</strong> BHP Billiton Mitsubishi Alliance, Mike Allen <strong>of</strong> Anglo<br />
American Metallurgical Coal and John Searls <strong>of</strong> Rio Tinto all took the<br />
time to provide us with the valuable insights to the realities <strong>of</strong> managing<br />
a portfolio <strong>of</strong> large <strong>capital</strong> <strong>projects</strong>. Our special thanks to BHP Billiton<br />
Mitsubishi Alliance and Anglo American, who have engaged us to assist<br />
in the ongoing evaluation and strategic development <strong>of</strong> major <strong>mining</strong> and<br />
infrastructure <strong>projects</strong> for their extended coal operations in Australia.<br />
Thanks also to our <strong>PwC</strong> colleagues; Chris Sullivan, Edina Ente, and<br />
Gui Capper who worked with Pedro Bueno on the development <strong>of</strong> this<br />
publication and also contributed with many ideas contained in this paper.<br />
References<br />
PricewaterhouseCoopers, 2010. “Mine: Back to the Boom Review<br />
<strong>of</strong> global trends in the <strong>mining</strong> industry” Global Energy, Utilities<br />
and Mining.<br />
Fabio Buckeridge, Brian Gillespie and Stephen Loadsman, 2010.<br />
“Optimising Extended Mining Operations Through Value Driver<br />
Modelling”.<br />
Anjuli Steffen, Jane Couchman and Brian Gillespie, 2008. “Avoiding<br />
cost blow-outs and lost time on <strong>mining</strong> <strong>capital</strong> <strong>projects</strong> through<br />
effective project stage gating”.<br />
Krogh, G. and Cusumano, M. 2001. “Three Strategies for Managing<br />
Fast Growth” MIT Sloan Management Review.<br />
Khanna, T. 2010 “Vale: Global Expansion in the Challenging World<br />
<strong>of</strong> Mining”. Harvard Business Review.<br />
Kloppers, M. 2012 “Presentation to Global Metals, Mining and Steel<br />
Conference, Miami, 15 May”<br />
Borensztein, E. and C.M. Reinhart, 1994. “The Macroeconomic<br />
Determinants <strong>of</strong> Commodity Prices,” IMF Working Paper 94/9.<br />
Garnaut, R. and L. Song, 2006. “China’s Resources Demand at the<br />
Turning Point.” TheTurning Point in China’s Economic development,<br />
Australian National University Press.<br />
Pain, N., I. Koske, and M. Sollie, 2006. “Globalisation and Inflation in<br />
the OECD Economies.” OECD WP1(2006)14 on Macroeconomic and<br />
Structural Policy Analysis.
<strong>PwC</strong> Mining Thought Leadership Publications<br />
Our commitment to the industry goes beyond our services. As industry leaders, we are globally recognised for our broad knowledge <strong>of</strong> the<br />
<strong>mining</strong> industry and the laws that govern it. For a full list <strong>of</strong> our publications visit our website: www.pwc.com/<strong>mining</strong><br />
2011 Global Mine Publication Contact Details<br />
Australia<br />
Canada<br />
Contact Details<br />
“The Game Has Changed”<br />
“Rise & Shine”<br />
“Junior Mine”<br />
Tim Goldsmith, Melbourne, Australia<br />
Tim Goldsmith, Melbourne, Australia<br />
Telephone: +61 3 8603 2016<br />
Telephone: +61 3 8603 2016<br />
Email : tim.goldsmith@au.pwc.com<br />
Email: tim.goldsmith@au.pwc.com<br />
Ben Gargett, Melbourne, Australia<br />
www.pwc.com<br />
John Gravelle, Toronto, Canada<br />
Telephone: +61 3 8603 2539<br />
Telephone +1 416 869 8727<br />
Email: benjamin.gargett@au.pwc.com<br />
Email: john.gravelle@ca.pwc.com<br />
Hein Boegman, Johannesburg,<br />
South Africa<br />
Telephone: +27 11 797 4335<br />
2011 Global Mining Deals Contact Details<br />
South Africa<br />
Russia<br />
Email: hein.boegman@za.pwc.com<br />
“Riders on the Storm”<br />
Tim Goldsmith, Melbourne, Australia “Review <strong>of</strong> trends in “Metals & Mining”<br />
John Campbell, Moscow, Russia<br />
Telephone: +61 3 8603 2016<br />
the South African<br />
Telephone: +7 495 967 6279<br />
Email: tim.goldsmith@au.pwc.com <strong>mining</strong> industry”<br />
Email: john.c.campbell@ru.pwc.com<br />
John Gravelle, Toronto, Canada<br />
Telephone +1 416 869 8727<br />
Email: john.gravelle@ca.pwc.com<br />
Global Mining Tax Comparison Contact Details<br />
“Income taxes, <strong>mining</strong> taxes and<br />
Steve Ralbovsky, Phoenix, U.S.A<br />
<strong>mining</strong> royalties”<br />
Telephone: +1 (602) 364 8193<br />
Email: steve.ralbovsky@us.pwc.com<br />
Contacts:<br />
The game has changed<br />
Global Mining Leader Africa<br />
Brazil<br />
Canada<br />
and Australia<br />
September 2011<br />
Review <strong>of</strong> global trends<br />
Tim Goldsmith Hein Boegman Ronaldo Valino John Gravelle<br />
Melbourne<br />
Johannesburg<br />
Rio de Janiero<br />
Toronto<br />
in the <strong>mining</strong> industry<br />
T: +61 3 8603 2016<br />
T: +27 11 797 4335<br />
T: + 55 21 3232 6139<br />
T: +1 (416) 869 8727<br />
E: tim.goldsmith@au.pwc.com E: hein.boegman@za.pwc.com E: ronaldo.valino@br.pwc.com E: john.gravelle@ca.pwc.com<br />
Chile<br />
China<br />
India<br />
Indonesia<br />
Colin Becker<br />
Ken Su<br />
Kameswara Rao Sacha Winzenried<br />
Santiago<br />
Beijing<br />
Hyderabad<br />
Jakarta<br />
T: +56 (2) 940 0016<br />
T: +86 (10) 6533 7290<br />
T: +91 40 6624 6688<br />
T: +62 21 5289 0968<br />
E: colin.becker@cl.pwc.com E: ken.x.su@cn.pwc.com E: kameswara.rao@in.pwc.com E: sacha.winzenried@id.pwc.com<br />
Russia and Central United Kingdom United States<br />
& Eastern Europe<br />
John Campbell Jason Burkitt<br />
Steve Ralbovsky<br />
Moscow<br />
London<br />
Phoenix<br />
T: +7 (495) 967 6279<br />
T: +44 (20) 7213 2515<br />
T: +1 (602) 364 8193<br />
E: john.c.campbell@ru.pwc.com E: jason.e.burkitt@uk.pwc.com E: steve.ralbovsky@us.pwc.com<br />
Global Mining Knowledge Manager<br />
Ben Gargett<br />
Melbourne<br />
T: +61 3 8603 2539<br />
E: benjamin.gargett@au.pwc.com<br />
© 2011© <strong>PwC</strong>. All rights reserved. Not for further distribution without the permission <strong>of</strong> <strong>PwC</strong>. “<strong>PwC</strong>” refers to the network <strong>of</strong> member firms <strong>of</strong> PricewaterhouseCoopers International Limited (<strong>PwC</strong>IL), or,<br />
as the context requires, individual member firms <strong>of</strong> the <strong>PwC</strong> network. Each member firm is a separate legal entity and does not act as agent <strong>of</strong> <strong>PwC</strong>IL or any other member firm. <strong>PwC</strong>IL does not provide any<br />
services to clients. <strong>PwC</strong>IL is not responsible or liable for the acts or omissions <strong>of</strong> any <strong>of</strong> its member firms nor can it control the exercise <strong>of</strong> their pr<strong>of</strong>essional judgment or bind them in any way. No member firm<br />
is responsible or liable for the acts or omissions <strong>of</strong> any other member firm nor can it control the exercise <strong>of</strong> another member firm’s pr<strong>of</strong>essional judgment or bind another member firm or <strong>PwC</strong>IL in any way.<br />
pwc.com<br />
Statement <strong>of</strong> capabilities<br />
Survey <strong>of</strong> senior and junior<br />
gold <strong>mining</strong> companies<br />
www.pwc.com/ca/<strong>mining</strong><br />
Mining Excellence@<strong>PwC</strong><br />
While issues faced by miners across the industry may be similar, we understand<br />
that ‘value’ means different things to different people. That’s why at <strong>PwC</strong> it’s<br />
not just about providing the ‘right’ answers. Our team <strong>of</strong> <strong>mining</strong> specialists<br />
remain focused on relationships to help our clients navigate the complex<br />
<strong>mining</strong> world and deliver on objectives. We are passionate about <strong>mining</strong> and<br />
have a team <strong>of</strong> highly skilled pr<strong>of</strong>essionals exclusively focused on improving<br />
efficiency and adding value across the industry.<br />
Mining Excellence@<strong>PwC</strong> provides our clients:<br />
leading edge knowledge and insight<br />
We have made considerable investments<br />
to ensure our people are not only<br />
technically strong, but also have strong<br />
industry experience and expertise. Our<br />
Thought Leadership program is focused<br />
on providing in depth commentary on<br />
the key issues being faced by miners in<br />
today’s complex operating arena.<br />
Mining Excellence@<strong>PwC</strong> includes:<br />
• a comprehensive industry insight<br />
program. This includes:<br />
––<br />
flagship publications such as Mine<br />
and Mining Deals<br />
––<br />
web casts available at pwc.com<br />
––<br />
insight publications focused on<br />
key industry issues<br />
Mine 2011<br />
Riders on<br />
the Storm...<br />
Global <strong>mining</strong> deals<br />
2011 mid-year update<br />
Mining enters<br />
a new era<br />
2012 Gold Price<br />
Report<br />
Keeping up with the<br />
price <strong>of</strong> gold<br />
connections to our vast network<br />
<strong>of</strong> <strong>mining</strong> experts and global<br />
client portfolio<br />
We have the widest network <strong>of</strong> <strong>mining</strong><br />
experts who work out <strong>of</strong> strategic hubs<br />
across the globe to help better connect you<br />
to vital <strong>mining</strong> markets.<br />
Our connections provide:<br />
• collaborative cross-border account<br />
management, which ensures seamless<br />
client service<br />
• a global community <strong>of</strong> <strong>mining</strong> leaders,<br />
allowing our clients to connect with key<br />
players in all markets to maximise<br />
deal potential<br />
• a well-connected and mobile workforce.<br />
Mining Excellence@<strong>PwC</strong><br />
delivers a team <strong>of</strong> industry<br />
experts exclusively focused<br />
on the <strong>mining</strong> sector<br />
the delivery <strong>of</strong> an experience that<br />
meets our clients’ definition <strong>of</strong> ‘value’<br />
With <strong>mining</strong> experts working in each key<br />
Australian state, our award winning teams<br />
are helping clients deliver on specific<br />
<strong>projects</strong> and organisational growth<br />
aspirations. We <strong>of</strong>fer Advisory, Tax and<br />
Audit services to global corporations and<br />
locally listed companies.<br />
Mining Excellence@<strong>PwC</strong> complements<br />
this with:<br />
• a suite <strong>of</strong> niche <strong>mining</strong> consulting<br />
capabilities focused on optimising<br />
value across <strong>mining</strong> operations and<br />
effectively managing risk<br />
• a comprehensive Client Feedback<br />
program to ensure we are consistently<br />
delivering on individual client needs.<br />
Brian Gillespie Brisbane<br />
Wim Blom Brisbane<br />
Darren Smith Perth<br />
Roger Port Perth<br />
• an extensive industry development<br />
program, including on-site and in-class<br />
learning opportunities for our people<br />
and clients.<br />
John Gravelle Toronto<br />
John Campbell<br />
Moscow<br />
Mark Coughlin<br />
Adelaide<br />
Richard Abadie London<br />
Kameswara Rao<br />
Hyderabad<br />
Jock O’Callaghan Melbourne<br />
Ken Su Beijing<br />
Kai Zhang<br />
Sydney<br />
Steve Ralbovsky Phoenix<br />
Sacha Winzenreid Jakarta<br />
Colin<br />
Becker<br />
Santiago<br />
Hein Boegman Johannesburg<br />
Ronaldo Valino Rio de Janeiro<br />
Global Mining Leader<br />
Tim Goldsmith Melbourne<br />
June 2012 13
Authors<br />
Pedro Bueno Da Silva<br />
Pedro is a Senior Manager in the<br />
<strong>PwC</strong> Consulting practice in Australia<br />
where he focuses on the Mining sector<br />
specialising in major <strong>capital</strong> <strong>projects</strong>,<br />
sustainable cost management and<br />
corporate performance management.<br />
Pedro has several years <strong>of</strong> international<br />
experience in both the <strong>mining</strong> and<br />
finance sectors. Most recently, Pedro<br />
spent two years working on evaluation<br />
<strong>of</strong> major <strong>capital</strong> <strong>projects</strong> for BHP Billiton<br />
Mitsubishi Alliance, the largest coal miner<br />
in Australia. Before that Pedro worked on<br />
the redesign and implementation <strong>of</strong> Anglo<br />
American’s global planning and corporate<br />
performance framework and operational<br />
improvement <strong>projects</strong> across Xstrata’s Coal<br />
operations in Queensland.<br />
Pedro holds a Bachelor <strong>of</strong> Commerce<br />
with Finance and Accounting majors from<br />
the University <strong>of</strong> Queensland, a Masters<br />
<strong>of</strong> Applied Finance and he is a Certified<br />
Practising Accountant, with CPA Australia.<br />
Pedro Bueno Da Silva<br />
Senior Manager, Consulting<br />
Brisbane, Australia<br />
T:+61 7 3257 8489<br />
E: pedro.bueno@au.pwc.com<br />
Brian Gillespie<br />
Brian is the Lead Partner for Capital<br />
Projects and Infrastructure in Australia.<br />
In recent years, Brian has led large<br />
<strong>projects</strong> both in Australia and globally<br />
with organisations such as Anglo<br />
American, BHP Billiton, Peabody, Rio<br />
Tinto, Xstrata, Queensland Rail Coal<br />
Division and Dalrymple Bay Coal<br />
Terminal.<br />
Brian has published a number <strong>of</strong><br />
publications dealing with the specific<br />
challenges <strong>of</strong> the <strong>mining</strong>, oil and gas<br />
sectors, including papers on mine site<br />
operational improvement, global credit<br />
risk management, major <strong>capital</strong> project<br />
stage‐gating and safety classification.<br />
Brian holds the degrees <strong>of</strong> BSc (Hons)<br />
and MBA from the University <strong>of</strong><br />
Queensland and is a Chartered Engineer<br />
with the Institute <strong>of</strong> Technology and<br />
Engineering in the UK.<br />
Brian Gillespie<br />
Partner, Capital Projects<br />
and Infrastructure<br />
Brisbane, Australia<br />
T:+61 7 3257 5656<br />
E: brian.gillespie@au.pwc.com<br />
Fabio Buckeridge<br />
Fabio is a Senior Manager in the <strong>PwC</strong><br />
Consulting practice in Australia. Fabio<br />
has eight years <strong>of</strong> international Resources<br />
sector experience and has knowledge <strong>of</strong><br />
electrical engineering, logistics, <strong>mining</strong>,<br />
accounting and finance. He has worked<br />
on <strong>projects</strong> in South America, USA, UK<br />
and Australia.<br />
In recent years Fabio has managed<br />
large operational improvement <strong>projects</strong><br />
for Anglo American, BHP Billiton and<br />
Xstrata. Fabio has experience across<br />
several commodities and has recently<br />
managed the development <strong>of</strong> operational<br />
improvement models across all Xstrata<br />
Coal mine sites in Australia.<br />
Fabio holds a Bachelor <strong>of</strong> Finance and<br />
Accounting (first class distinction) from<br />
the Queensland University <strong>of</strong> Technology<br />
and is a Chartered Accountant, with the<br />
Institute <strong>of</strong> Chartered Accountants <strong>of</strong><br />
Australia. Fabio is currently undertaking<br />
his MBA at the London Business School.<br />
Fabio Buckeridge<br />
Senior Manager, Consulting<br />
Brisbane, Australia<br />
T: +61 7 3257 8354<br />
E: fabio.buckeridge@au.pwc.com<br />
Contacts<br />
Global Mining Leader<br />
Tim Goldsmith<br />
Melbourne<br />
T: +61 3 8603 2016<br />
E: tim.goldsmith@au.pwc.com<br />
Australia<br />
Brian Gillespie<br />
Brisbane<br />
T: +61 (7) 3257 5656<br />
E: brian.gillespie@au.pwc.com<br />
South Africa<br />
Hein Boegman<br />
Johannesburg<br />
T: +27 11 797 4335<br />
E: hein.boegman@za.pwc.com<br />
Latin America<br />
Ronaldo Valino<br />
Rio de Janiero<br />
T: + 55 21 3232 6139<br />
E: ronaldo.valino@br.pwc.com<br />
Canada<br />
John Gravelle<br />
Toronto<br />
T: +1 (416) 869 8727<br />
E: john.gravelle@ca.pwc.com<br />
Global Capital<br />
Projects and<br />
Infrastructure Leader<br />
Richard Abadie<br />
London<br />
T: +44 20 7213 3225<br />
E: richard.abadie@uk.pwc.com<br />
China<br />
Ken Su<br />
Beijing<br />
T: +86 (10) 6533 7290<br />
E: ken.x.su@cn.pwc.com<br />
India<br />
Kameswara Rao<br />
Hyderabad<br />
T: +91 40 6624 6688<br />
E: kameswara.rao@in.pwc.com<br />
Russia and Central<br />
& Eastern Europe<br />
Moscow<br />
John Campbell<br />
T: +7 (495) 967 6279<br />
E: john.c.campbell@ru.pwc.com<br />
United States<br />
Steve Ralbovsky<br />
Phoenix<br />
T: +1 (602) 364 8193<br />
E: steve.ralbovsky@us.pwc.com<br />
© 2012 PricewaterhouseCoopers. All rights reserved. In this document, “<strong>PwC</strong>” refers to PricewaterhouseCoopers a partnership formed in Australia,<br />
which is a member firm <strong>of</strong> PricewaterhouseCoopers International Limited, each member firm <strong>of</strong> which is a separate legal entity.<br />
245265