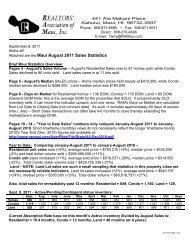
Attached are the Maui April 2012 Sales Statistics - Barry Brown Team
Attached are the Maui April 2012 Sales Statistics - Barry Brown Team
Attached are the Maui April 2012 Sales Statistics - Barry Brown Team

You also want an ePaper? Increase the reach of your titles
YUMPU automatically turns print PDFs into web optimized ePapers that Google loves.
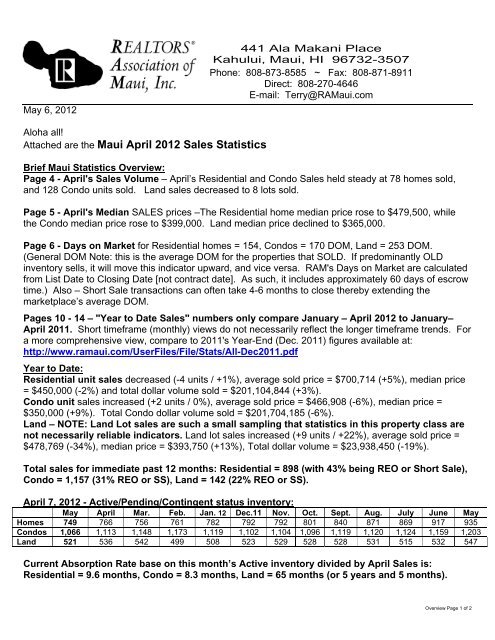
May 6, <strong>2012</strong><br />
441 Ala Makani Place<br />
Kahului, <strong>Maui</strong>, HI 96732-3507<br />
Phone: 808-873-8585 ~ Fax: 808-871-8911<br />
Direct: 808-270-4646<br />
E-mail: Terry@RA<strong>Maui</strong>.com<br />
Aloha all!<br />
<strong>Attached</strong> <strong>are</strong> <strong>the</strong> <strong>Maui</strong> <strong>April</strong> <strong>2012</strong> <strong>Sales</strong> <strong>Statistics</strong><br />
Brief <strong>Maui</strong> <strong>Statistics</strong> Overview:<br />
Page 4 - <strong>April</strong>'s <strong>Sales</strong> Volume – <strong>April</strong>’s Residential and Condo <strong>Sales</strong> held steady at 78 homes sold,<br />
and 128 Condo units sold. Land sales decreased to 8 lots sold.<br />
Page 5 - <strong>April</strong>'s Median SALES prices –The Residential home median price rose to $479,500, while<br />
<strong>the</strong> Condo median price rose to $399,000. Land median price declined to $365,000.<br />
Page 6 - Days on Market for Residential homes = 154, Condos = 170 DOM, Land = 253 DOM.<br />
(General DOM Note: this is <strong>the</strong> average DOM for <strong>the</strong> properties that SOLD. If predominantly OLD<br />
inventory sells, it will move this indicator upward, and vice versa. RAM's Days on Market <strong>are</strong> calculated<br />
from List Date to Closing Date [not contract date]. As such, it includes approximately 60 days of escrow<br />
time.) Also – Short Sale transactions can often take 4-6 months to close <strong>the</strong>reby extending <strong>the</strong><br />
marketplace’s average DOM.<br />
Pages 10 - 14 – "Year to Date <strong>Sales</strong>" numbers only comp<strong>are</strong> January – <strong>April</strong> <strong>2012</strong> to January–<br />
<strong>April</strong> 2011. Short timeframe (monthly) views do not necessarily reflect <strong>the</strong> longer timeframe trends. For<br />
a more comprehensive view, comp<strong>are</strong> to 2011's Year-End (Dec. 2011) figures available at:<br />
http://www.ramaui.com/UserFiles/File/Stats/All-Dec2011.pdf<br />
Year to Date:<br />
Residential unit sales decreased (-4 units / +1%), average sold price = $700,714 (+5%), median price<br />
= $450,000 (-2%) and total dollar volume sold = $201,104,844 (+3%).<br />
Condo unit sales increased (+2 units / 0%), average sold price = $466,908 (-6%), median price =<br />
$350,000 (+9%). Total Condo dollar volume sold = $201,704,185 (-6%).<br />
Land – NOTE: Land Lot sales <strong>are</strong> such a small sampling that statistics in this property class <strong>are</strong><br />
not necessarily reliable indicators. Land lot sales increased (+9 units / +22%), average sold price =<br />
$478,769 (-34%), median price = $393,750 (+13%), Total dollar volume = $23,938,450 (-19%).<br />
Total sales for immediate past 12 months: Residential = 898 (with 43% being REO or Short Sale),<br />
Condo = 1,157 (31% REO or SS), Land = 142 (22% REO or SS).<br />
<strong>April</strong> 7, <strong>2012</strong> - Active/Pending/Contingent status inventory:<br />
May <strong>April</strong> Mar. Feb. Jan. 12 Dec.11 Nov. Oct. Sept. Aug. July June May<br />
Homes 749 766 756 761 782 792 792 801 840 871 869 917 935<br />
Condos 1,066 1,113 1,148 1,173 1,119 1,102 1,104 1,096 1,119 1,120 1,124 1,159 1,203<br />
Land 521 536 542 499 508 523 529 528 528 531 515 532 547<br />
Current Absorption Rate base on this month’s Active inventory divided by <strong>April</strong> <strong>Sales</strong> is:<br />
Residential = 9.6 months, Condo = 8.3 months, Land = 65 months (or 5 years and 5 months).<br />
Overview Page 1 of 2
IN A NUT SHELL......<br />
<strong>the</strong> good, <strong>the</strong> bad….. AND THE ROAD AHEAD ……<br />
The pace of sales held steady in <strong>April</strong>. Well priced properties <strong>are</strong> attracting multiple offers making for a quick<br />
sale. Inventories have declined 11-20% over <strong>the</strong> past 12 months in Residential and Condo classes. Many short<br />
sales and REO (bank owned) properties <strong>are</strong> being absorbed as sales as we begin to move ahead to a more<br />
normal marketplace. Mortgage Interest Rates have twitched upward just recently however <strong>are</strong> still near historic<br />
record lows which may help motivate would-be Buyers to go ahead and buy IF <strong>the</strong>y can qualify. While general<br />
U.S. economic news looks hopeful, current World and US events will have ripple effects on cost of living,<br />
consumer confidence, and our Real Estate Market.<br />
FOR SELLERS: Sellers who don’t really need to sell (just “fishing?”) should stay off <strong>the</strong> market, and clear <strong>the</strong><br />
marketplace for those who REALLY have to sell. UNLESS- you <strong>are</strong> motivated to Upsize, Downsize or<br />
Upgrade – While selling now will “net” less, your next property will cost less. Sharpen your pencil, talk to<br />
your CPA and Realtor® to explore <strong>the</strong> hidden benefits or consequences. Make no assumptions that will<br />
sting later.<br />
To be successful, Sellers need to beat competing properties with better property condition, REALISTIC pricing,<br />
good marketing, and flexible, creative terms (Seller Second Loan, Agreement of Sale, Lease-with-option-to-buy,<br />
and Sale-with-lease-back to seller). Days on Market figures show that properties priced right will sell in a<br />
reasonable timeframe. “Priced Right” is still <strong>the</strong> determining factor.<br />
BEST Deals <strong>are</strong> selling, everything else is getting old.<br />
Pro-Active Sellers <strong>are</strong> getting <strong>the</strong>ir properties appraised, inspected and surveyed in advance to encourage<br />
realistic offers from knowledgeable Buyers. This can prevent unanticipated escrow fallout or Buyers whittling your<br />
price down during <strong>the</strong> transaction when previously unknown facts come to light. Unrealistic Sellers continue to<br />
be ignored by <strong>the</strong> market and miss current opportunities that later become woefully app<strong>are</strong>nt. They may even<br />
end up in a Short Sale or Foreclosure situation that could have been avoided.<br />
FOR BUYERS: Very Low interest rates prevail, however could inch up. Buyers should get Pre-Approved so<br />
<strong>the</strong>y can shop in confidence (fewer last minute disappointments due to non-funding loans).<br />
More "short-sales" and foreclosures <strong>are</strong> happening in <strong>the</strong> marketplace, yet <strong>the</strong>y can be less of a bargain than <strong>the</strong>y<br />
seem, requiring more hurdles to leap and more time (often 4-6 months) to close, if at all.<br />
Be prep<strong>are</strong>d, but BE REALISTIC. Lenders <strong>are</strong> much more stringent now on requirements for loan approval.<br />
First-Time Home Buyers – Many programs <strong>are</strong> available….. Attend a First-Time Home Buyers workshop, get<br />
familiar with <strong>the</strong> process, get qualified/approved, do your homework to get your own home. Many current owners<br />
never thought <strong>the</strong>y would be able to own until <strong>the</strong>y attended a workshop, discovered <strong>the</strong>y could own a home,<br />
and <strong>are</strong> glad <strong>the</strong>y did.<br />
This low point in <strong>the</strong> market is your r<strong>are</strong> chance, so check it out c<strong>are</strong>fully.<br />
Disclaimer: Zooming in on <strong>the</strong> figures of a specific geographic <strong>are</strong>a or property type may lead to different<br />
conclusions that looking at <strong>the</strong> overall view.<br />
<strong>Maui</strong>'s market place is much smaller than Oahu's, and a few high or low sales have a greater effect on <strong>the</strong><br />
statistical numbers without necessarily indicating a big market swing one way or ano<strong>the</strong>r.<br />
For questions regarding today’s market, please call our RAM <strong>2012</strong> President, Bob Lightbourn at<br />
808-283-4384.<br />
If you have any questions regarding hard numbers, call Terry at 808-270-4646.<br />
Mahalo,<br />
Terry Tolman<br />
RAM Chief Staff Executive<br />
Overview Page 2 of 2
Single Family Monthly <strong>Sales</strong> Volume<br />
For Month Ending 4/30/<strong>2012</strong><br />
Area Name<br />
Current Month<br />
Units Volume Median<br />
Previous Month<br />
Units Volume Median<br />
Year Ago Month<br />
Units Volume Median<br />
Central 17 $6,200,000 $350,000 19 $7,234,099 $372,000 26 $11,042,289 $417,000<br />
Haiku 8 $6,496,100 $744,250 6 $3,055,000 $417,500 4 $3,150,000 $822,500<br />
Hana 1 $450,000 $450,000 2 $609,900 $304,950 0 $0 $0<br />
Kaanapali 0 $0 $0 5 $10,864,000 $1,750,000 3 $5,460,000 $1,285,000<br />
Kihei 12 $7,887,845 $476,000 19 $9,068,400 $450,000 15 $7,171,100 $405,000<br />
Kula/Ulupalakua/Kanaio 9 $6,443,000 $700,000 6 $5,525,500 $494,000 6 $3,375,000 $570,000<br />
Lahaina 3 $2,160,000 $630,000 3 $1,312,000 $417,000 5 $6,699,000 $1,300,000<br />
Lanai 2 $495,000 $247,500 2 $390,000 $195,000 2 $580,000 $290,000<br />
Makawao/Olinda/Haliimaile 6 $3,064,000 $377,000 4 $3,211,000 $383,000 7 $2,493,450 $289,500<br />
<strong>Maui</strong> Meadows 3 $3,045,000 $1,100,000 2 $2,890,000 $1,445,000 2 $3,049,000 $1,524,500<br />
Molokai 1 $200,000 $200,000 1 $270,000 $270,000 2 $383,775 $191,888<br />
Nahiku 1 $299,000 $299,000 0<br />
$0 $0 0 $0 $0<br />
Napili/Kahana/Honokowai 6 $4,336,400 $675,750 3 $5,557,500 $615,000 3 $2,003,236 $733,000<br />
Pukalani 5 $2,016,000 $469,000 4 $1,988,000 $509,000 9 $4,732,000 $580,000<br />
Sprecklesville/Paia/Kuau 2 $1,865,000 $932,500 2 $837,000 $418,500 2 $727,000 $363,500<br />
Wailea/Makena 2 $3,084,000 $1,542,000 3 $9,690,000 $1,200,000 3 $6,745,000 $1,345,000<br />
<strong>Maui</strong> Summary : 78 $48,041,345 $479,500 81 $62,502,399 $435,000 89 $57,610,850 $500,000<br />
SOURCE: REALTORS Association of <strong>Maui</strong> - www.RA<strong>Maui</strong>.com<br />
MLS Sale data - Information deemed reliable, however not guaranteed Page 1
Condominium Monthly <strong>Sales</strong> Volume<br />
For Month Ending 4/30/<strong>2012</strong><br />
Area Name<br />
Current Month<br />
Units Volume Median<br />
Previous Month<br />
Units Volume Median<br />
Year Ago Month<br />
Units Volume Median<br />
Central 11 $2,237,990 $200,000 16 $3,551,480 $159,000 9 $1,743,500 $152,500<br />
Hana 1 $465,000 $465,000 0<br />
$0 $0 0 $0 $0<br />
Kaanapali 17 $9,374,500 $434,900 19 $13,556,700 $569,000 19 $14,398,200 $650,000<br />
Kapalua 5 $2,552,500 $485,000 4 $4,415,000 $890,000 4 $4,080,000 $527,500<br />
Kihei 47 $15,918,905 $226,000 37 $14,526,104 $279,900 38 $11,185,150 $230,000<br />
Lahaina 5 $3,391,755 $389,000 14 $4,788,263 $355,838 6 $3,763,205 $369,000<br />
Lanai 0 $0 $0 1 $585,000 $585,000 0 $0 $0<br />
Maalaea 3 $1,332,000 $420,000 3 $825,000 $235,000 3 $884,500 $328,500<br />
Molokai 1 $95,000 $95,000 0<br />
$0 $0 1 $77,000 $77,000<br />
Napili/Kahana/Honokowai 20 $7,240,901 $325,000 26 $8,963,900 $262,500 25 $6,532,000 $250,000<br />
Pukalani 1 $345,000 $345,000 0<br />
$0 $0 0 $0 $0<br />
Wailea/Makena 17 $25,158,500 $965,000 10 $13,259,125 $808,000 15 $20,002,000 $755,000<br />
<strong>Maui</strong> Summary : 128 $68,112,051 $399,000 130 $64,470,572 $368,043 120 $62,665,555 $338,603<br />
SOURCE: REALTORS Association of <strong>Maui</strong> - www.RA<strong>Maui</strong>.com<br />
MLS Sale data - Information deemed reliable, however not guaranteed Page 2
Land Monthly <strong>Sales</strong> Volume<br />
For Month Ending 4/30/<strong>2012</strong><br />
Area Name<br />
Current Month<br />
Units Volume Median<br />
Previous Month<br />
Units Volume Median<br />
Year Ago Month<br />
Units Volume Median<br />
Central 1 $6,100 $6,100 7 $2,618,000 $400,000 1 $140,000 $140,000<br />
Haiku 3 $1,591,500 $387,500 3 $1,550,000 $480,000 2 $1,195,000 $597,500<br />
Hana 0 $0 $0 1 $335,000 $335,000 0 $0 $0<br />
Kaanapali 1 $375,000 $375,000 2 $855,000 $427,500 2 $1,120,000 $560,000<br />
Kahakuloa 0 $0 $0 1 $140,000 $140,000 2 $605,415 $302,708<br />
Kapalua 0 $0 $0 0<br />
$0 $0 1 $630,000 $630,000<br />
Kihei 0 $0 $0 1 $160,000 $160,000 0 $0 $0<br />
Kula/Ulupalakua/Kanaio 0 $0 $0 3 $2,880,000 $1,000,000 3 $1,345,000 $385,000<br />
Lahaina 0 $0 $0 3 $2,595,000 $985,000 2 $1,415,000 $707,500<br />
Makawao/Olinda/Haliimaile 1 $355,000 $355,000 1 $290,000 $290,000 0 $0 $0<br />
Molokai 0 $0 $0 0<br />
$0 $0 1 $130,000 $130,000<br />
Napili/Kahana/Honokowai 1 $275,000 $275,000 0<br />
$0 $0 0 $0 $0<br />
Olowalu 1 $575,000 $575,000 0<br />
$0 $0 0 $0 $0<br />
<strong>Maui</strong> Summary : 8 $3,177,600 $365,000 22 $11,423,000 $467,500 14 $6,580,415 $382,500<br />
SOURCE: REALTORS Association of <strong>Maui</strong> - www.RAMui.com<br />
MLS Sale data - Information deemed reliable, however not guaranteed Page 3
<strong>Sales</strong> Unit Volume By Month<br />
For Month Ending 4/30/<strong>2012</strong><br />
180<br />
160<br />
140<br />
120<br />
100<br />
80<br />
60<br />
40<br />
20<br />
0<br />
Jan-07<br />
Mar-07<br />
May-07<br />
2007<br />
Jul-07<br />
Sep-07<br />
Nov-07<br />
Jan-08<br />
Mar-08<br />
May-08<br />
Jul-08<br />
Sep-08<br />
Nov-08<br />
Jan-09<br />
2008<br />
Mar-09<br />
May-09<br />
Jul-09<br />
Con Lnd Re s<br />
2009<br />
Sep-09<br />
Nov-09<br />
Jan-10<br />
Mar-10<br />
May-10<br />
Jul-10<br />
Sep-10<br />
Nov-10<br />
2010<br />
2011<br />
Jan-11<br />
Mar-11<br />
May-11<br />
Jul-11<br />
Sep-11<br />
Nov-11<br />
Jan-12<br />
Mar-12<br />
<strong>2012</strong><br />
Month<br />
Single<br />
Family<br />
Condo Land<br />
Single<br />
Family<br />
Condo<br />
Land<br />
Single<br />
Family<br />
Condo<br />
Land<br />
Single<br />
Family<br />
Condo<br />
Land<br />
Single<br />
Family<br />
Condo<br />
Land<br />
Single<br />
Family<br />
Condo<br />
Land<br />
Jan<br />
Feb<br />
106 99 15<br />
104 84 30<br />
57 89 7<br />
76 95 24<br />
31 110 3<br />
34 84 6<br />
48 75 12<br />
54 95 7<br />
54 87 9<br />
59 98 7<br />
50 91 8<br />
78 83 12<br />
Mar<br />
Apr<br />
May<br />
Jun<br />
Jul<br />
Aug<br />
Sep<br />
131 95 17<br />
96 117 26<br />
101 111 29<br />
112 113 26<br />
86 99 13<br />
83 115 10<br />
74 84 16<br />
95 92 10<br />
78 94 8<br />
97 84 9<br />
76 56 11<br />
97 68 7<br />
66 56 6<br />
66 56 7<br />
56 71 14<br />
50 42 11<br />
60 52 8<br />
65 55 8<br />
59 78 12<br />
53 66 3<br />
54 63 10<br />
72 125 12<br />
91 162 15<br />
81 105 16<br />
81 106 9<br />
61 69 15<br />
69 81 7<br />
65 98 7<br />
89 125 11<br />
89 120 14<br />
71 114 15<br />
81 102 14<br />
68 98 14<br />
81 86 12<br />
80 84 12<br />
81 130 22<br />
78 128 8<br />
Oct<br />
Nov<br />
Dec<br />
80 112 17<br />
83 86 16<br />
87 73 14<br />
81 51 4<br />
66 29 4<br />
55 43 2<br />
74 61 8<br />
67 70 17<br />
90 82 11<br />
64 73 6<br />
58 66 7<br />
73 93 14<br />
74 77 8<br />
76 77 9<br />
79 89 9<br />
SOURCE: REALTORS Association of <strong>Maui</strong> - www.RA<strong>Maui</strong>.com<br />
MLS <strong>Sales</strong> data - Information deemed reliable, however not guaranteed Page 4
<strong>Sales</strong> Median By Month<br />
For Month Ending 4/30/<strong>2012</strong><br />
$700,000<br />
$600,000<br />
$500,000<br />
$400,000<br />
$300,000<br />
$200,000<br />
$100,000<br />
$0<br />
Jan-07<br />
Apr-07<br />
Jul-07<br />
Oct-07<br />
Jan-08<br />
Apr-08<br />
Jul-08<br />
Oct-08<br />
Jan-09<br />
Apr-09<br />
Jul-09<br />
Oct-09<br />
Jan-10<br />
Apr-10<br />
Jul-10<br />
Oct-10<br />
Jan-11<br />
Apr-11<br />
Jul-11<br />
Oct-11<br />
Jan-12<br />
Apr-12<br />
Jul-12<br />
Oct-12<br />
Con Lnd Res<br />
Month<br />
Jan<br />
2007<br />
Single<br />
Family<br />
Condo Land<br />
602000 600000 700000<br />
2008<br />
Single<br />
Family<br />
Condo Land<br />
563225 610000 600000<br />
Single<br />
Family<br />
2009<br />
Condo<br />
Land<br />
558000 820000 70000<br />
2010<br />
Single<br />
Family<br />
Condo Land<br />
464500 404000 516300<br />
2011<br />
Single<br />
Family<br />
Condo Land<br />
495415 295000 300000<br />
<strong>2012</strong><br />
Single<br />
Family<br />
Condo Land<br />
399000 330000 330000<br />
Feb<br />
635000 596000 342000<br />
624391 575000 1195000 545000 692500 262500<br />
504150 424000 350000<br />
440000 371200 282500<br />
513750 287000 333925<br />
Mar<br />
625000 469500 550000<br />
620000 538500 537500 504500 480000 1669250<br />
460000 499000 600000<br />
450000 289000 500000<br />
435000 368043 467500<br />
Apr<br />
May<br />
Jun<br />
Jul<br />
Aug<br />
671000 485000 843750<br />
653746 531325 550000<br />
667000 475000 682500<br />
650000 510000 575000<br />
639996 592000 662500<br />
577500 600000 477000 497000 411000 1100000<br />
567000 512500 600000 482500 399000 665000<br />
606000 577500 700000 495000 469000 441000<br />
610000 615000 1025000 532000 417000 322500<br />
645000 647500 422505 500000 371250 999990<br />
465000 450000 540000<br />
442000 410000 547500<br />
480000 435000 360000<br />
500000 390000 400000<br />
460000 310000 387500<br />
500000 338603 382500<br />
418000 349500 275000<br />
429000 294500 302000<br />
394500 320000 340000<br />
410000 266000 189500<br />
479500 399000 365000<br />
Sep<br />
586000 599000450000<br />
537500 442500 290500 440000 307500 712500<br />
440000 315635 285000<br />
412000 334950 330000<br />
Oct<br />
591000 552000 450000<br />
510000 420000 590000 488500 400842 382450<br />
427500 320000 207500<br />
482500 310000 465000<br />
Nov<br />
631900 640156 465000<br />
475500 399000 507140 465000 399000 450000<br />
445000 349990 425000<br />
422500 265000 505000<br />
Dec<br />
582002 626000 650000<br />
570000 577680 2171300 477000 401500 420000<br />
460000 352000 394850<br />
411000 304000 375000<br />
SOURCE: REALTORS Association of <strong>Maui</strong> - www.RA<strong>Maui</strong>.com<br />
MLS <strong>Sales</strong> data - Information deemed reliable, however not guaranteed Page 5
<strong>Sales</strong> Days on Market By Month<br />
For Month Ending 4/30/<strong>2012</strong><br />
700<br />
600<br />
500<br />
400<br />
300<br />
200<br />
100<br />
0<br />
Jan-07<br />
Apr-07<br />
Jul-07<br />
Oct-07<br />
Jan-08<br />
Apr-08<br />
Jul-08<br />
Oct-08<br />
Jan-09<br />
Apr-09<br />
Jul-09<br />
Oct-09<br />
Jan-10<br />
Apr-10<br />
Jul-10<br />
Oct-10<br />
Jan-11<br />
Apr-11<br />
Jul-11<br />
Oct-11<br />
Jan-12<br />
Apr-12<br />
Jul-12<br />
Oct-12<br />
Con Lnd Re s<br />
2007<br />
2008<br />
2009<br />
2010<br />
2011<br />
<strong>2012</strong><br />
Month<br />
Single<br />
Family<br />
Condo Land<br />
Single<br />
Family<br />
Condo<br />
Land<br />
Single<br />
Family<br />
Condo<br />
Land<br />
Single<br />
Family<br />
Condo<br />
Land<br />
Single<br />
Family<br />
Condo<br />
Land<br />
Single<br />
Family<br />
Condo<br />
Land<br />
Jan<br />
Feb<br />
113 180 162<br />
138 174 432<br />
151 223 379<br />
134 141 679<br />
176 1126 496<br />
199 1152 228<br />
224 247 248<br />
127 229 351<br />
112 180 240<br />
147 192 180<br />
165 144 168<br />
153 172 371<br />
Mar<br />
Apr<br />
May<br />
Jun<br />
Jul<br />
Aug<br />
Sep<br />
150 152 230<br />
167 145 197<br />
158 153 184<br />
186 152 314<br />
146 161 147<br />
112 175 203<br />
137 157 231<br />
162 176 137<br />
138 175 164<br />
183 140 227<br />
154 147 180<br />
167 172 218<br />
209 140 174<br />
174 180 217<br />
163 203 108<br />
137 212 195<br />
150 127 337<br />
111 115 300<br />
212 190 230<br />
159 216 427<br />
158 135 185<br />
138 233 230<br />
153 179 162<br />
132 192 200<br />
131 184 174<br />
119 132 292<br />
118 202 124<br />
122 129 169<br />
150 185 231<br />
146 142 362<br />
138 201 175<br />
141 145 150<br />
150 201 219<br />
136 179 82.5<br />
117 158 136<br />
135 171 173<br />
154 170 253<br />
Oct<br />
Nov<br />
Dec<br />
165 143 163<br />
163 204 259<br />
176 200 181<br />
158 186 93<br />
142 160 312<br />
159 200 88<br />
190 143 384<br />
168 192 284<br />
154 178 111<br />
181 141 220<br />
166 147 196<br />
153 172 190<br />
187 140 140<br />
140 163 317<br />
155 126 211<br />
SOURCE: REALTORS Association of <strong>Maui</strong> - www.RA<strong>Maui</strong>.com<br />
MLS Sale data - Information deemed reliable, however not guaranteed Page 6
Single Family Median Prices by Area<br />
For Month Ending 4/30/<strong>2012</strong><br />
Current Month Information<br />
Central<br />
Haiku<br />
Hana<br />
Kaanapali<br />
Kihei<br />
Kula/Ulupalakua/ Kanaio<br />
Lahaina<br />
Lanai<br />
M akawao/Olinda/Haliimaile<br />
M aui M eadows<br />
Molokai<br />
Nahiku<br />
Napili/Kahana/Honokowai<br />
Pukalani<br />
Sprecklesville/Paia/Kuau<br />
Wailea/ M akena<br />
0 250,000 500,000 750,000 1,000,000 1,250,000 1,500,000 1,750,000 2,000,000<br />
Area Current Month Previous Month Year Ago Month<br />
Central<br />
$350,000 $372,000 $417,000<br />
Haiku<br />
$744,250 $417,500 $822,500<br />
Hana<br />
$450,000 $304,950 $0<br />
Kaanapali<br />
$0 $1,750,000 $1,285,000<br />
Kihei<br />
$476,000 $450,000 $405,000<br />
Kula/Ulupalakua/Kanaio<br />
$700,000 $494,000 $570,000<br />
Lahaina<br />
$630,000 $417,000 $1,300,000<br />
Lanai<br />
$247,500 $195,000 $290,000<br />
Makawao/Olinda/Haliimaile<br />
$377,000 $383,000 $289,500<br />
<strong>Maui</strong> Meadows<br />
$1,100,000 $1,445,000 $1,524,500<br />
Molokai<br />
$200,000 $270,000 $191,888<br />
Nahiku<br />
$299,000 $0 $0<br />
Napili/Kahana/Honokowai<br />
$675,750 $615,000 $733,000<br />
Pukalani<br />
$469,000 $509,000 $580,000<br />
Sprecklesville/Paia/Kuau<br />
$932,500 $418,500 $363,500<br />
Wailea/Makena<br />
$1,542,000 $1,200,000 $1,345,000<br />
SOURCE: REALTORS Association of <strong>Maui</strong> - www.RA<strong>Maui</strong>.com<br />
MLS Sale data - Information deemed reliable, however not guaranteed Page 7
Condominium Median Prices by Area<br />
For Month Ending 4/30/<strong>2012</strong><br />
Current Month Information<br />
$1,200,000<br />
$1,000,000<br />
$800,000<br />
$600,000<br />
$400,000<br />
$200,000<br />
$0<br />
Central<br />
Hana<br />
Kaanapali<br />
Kapalua<br />
Kihei<br />
Lahaina<br />
Lanai<br />
Maalaea<br />
Molokai<br />
Napili/Kahana/Honokowai<br />
Pukalani<br />
Wailea/Makena<br />
Area Current Month Previous Month Year Ago Month<br />
Central<br />
$200,000 $159,000 $152,500<br />
Hana<br />
$465,000 $0 $0<br />
Kaanapali<br />
$434,900 $569,000 $650,000<br />
Kapalua<br />
$485,000 $890,000 $527,500<br />
Kihei<br />
$226,000 $279,900 $230,000<br />
Lahaina<br />
$389,000 $355,838 $369,000<br />
Lanai<br />
$0 $585,000 $0<br />
Maalaea<br />
$420,000 $235,000 $328,500<br />
Molokai<br />
$95,000 $0 $77,000<br />
Napili/Kahana/Honokowai<br />
$325,000 $262,500 $250,000<br />
Pukalani<br />
$345,000 $0 $0<br />
Wailea/Makena<br />
$965,000 $808,000 $755,000<br />
SOURCE: REALTORS Association of <strong>Maui</strong> - www.RA<strong>Maui</strong>.com<br />
MLS Sale data - Information deemed reliable, however not guaranteed Page 8
Land Median Prices by Area<br />
For Month Ending 4/30/<strong>2012</strong><br />
Current Month Information<br />
Central<br />
Haik u<br />
Hana<br />
Kaanapali<br />
Kahak uloa<br />
Kapalua<br />
Kihe i<br />
Kula/Ulupalakua/Kanaio<br />
Lahaina<br />
Makawao/Olinda/Haliimaile<br />
Molokai<br />
Napili/Kahana/Honokow ai<br />
Olow alu<br />
$0 $200,000 $400,000 $600,000 $800,000 $1,000,000<br />
Area Current Month Previous Month Year Ago Month<br />
Central<br />
Haiku<br />
Hana<br />
Kaanapali<br />
Kahakuloa<br />
Kapalua<br />
Kihei<br />
Kula/Ulupalakua/Kanaio<br />
Lahaina<br />
Makawao/Olinda/Haliimaile<br />
Molokai<br />
Napili/Kahana/Honokowai<br />
Olowalu<br />
$6,100 $400,000 $140,000<br />
$387,500 $480,000 $597,500<br />
$0 $335,000 $0<br />
$375,000 $427,500 $560,000<br />
$0 $140,000 $302,708<br />
$0 $0 $630,000<br />
$0 $160,000 $0<br />
$0 $1,000,000 $385,000<br />
$0 $985,000 $707,500<br />
$355,000 $290,000 $0<br />
$0 $0 $130,000<br />
$275,000 $0 $0<br />
$575,000 $0 $0<br />
SOURCE: REALTORS Association of <strong>Maui</strong> - www.RA<strong>Maui</strong>.com<br />
MLS Sale data - Information deemed reliable, however not guaranteedc Page 9
Single Family Year To Date <strong>Sales</strong> Information<br />
Comparing 1/1/<strong>2012</strong> thru 4/30/<strong>2012</strong> with 1/1/2011 thru 4/30/2011<br />
Number of <strong>Sales</strong><br />
Average <strong>Sales</strong> Price<br />
Median <strong>Sales</strong> Price<br />
Total Dollar Volume<br />
Area<br />
Current<br />
YTD<br />
<strong>Sales</strong><br />
Year<br />
Ago<br />
YTD<br />
Changes<br />
Units %<br />
Current<br />
YTD<br />
Average<br />
Year Ago<br />
YTD<br />
Average<br />
Percent<br />
Change<br />
Current<br />
YTD<br />
Median<br />
Year Ago<br />
YTD<br />
Median<br />
Percent<br />
Change<br />
Current<br />
YTD<br />
Volume<br />
Year Ago<br />
YTD<br />
Volume<br />
Percent<br />
Change<br />
Central 73 82 -9 -11% $392,623 $407,450 -4% $367,000 $386,000 -5% $28,661,499 $33,410,910 -14%<br />
Haiku 24 13 11 85% $774,313 $726,785 7% $701,000 $625,000 12% $18,583,500 $9,448,200 97%<br />
Hana 4 0 4 N/A $421,225 $0 N/A $399,950 $0 N/A $1,684,900 $0 N/A<br />
Kaanapali 7 14 -7 -50% $1,816,286 $1,169,357 55% $1,350,000 $922,000 46% $12,714,000 $16,371,000 -22%<br />
Kahakuloa 1 0 1 N/A $749,900 $0 N/A $749,900 $0 N/A $749,900 $0 N/A<br />
Kapalua 2 3 -1 -33% $2,880,000 $6,483,333 -56% $2,880,000 $3,250,000 -11% $5,760,000 $19,450,000 -70%<br />
Kihei 54 53 1 2% $595,692 $524,581 14% $449,000 $403,000 11% $32,167,345 $27,802,800 16%<br />
Kula/Ulupalakua/Kanaio 23 22 1 5% $798,109 $593,063 35% $565,000 $477,500 18% $18,356,500 $13,047,390 41%<br />
Lahaina 15 13 2 15% $576,300 $1,133,846 -49% $430,000 $770,000 -44% $8,644,500 $14,740,000 -41%<br />
Lanai 7 3 4 133% $229,286 $283,333 -19% $195,000 $270,000 -28% $1,605,000 $850,000 89%<br />
Makawao/Olinda/Haliimaile 18 21 -3 -14% $486,750 $474,731 3% $338,000 $365,000 -7% $8,761,500 $9,969,350 -12%<br />
<strong>Maui</strong> Meadows 9 10 -1 -10% $1,153,889 $926,290 25% $950,000 $774,500 23% $10,385,000 $9,262,900 12%<br />
Molokai 3 6 -3 -50% $339,167 $343,963 -1% $270,000 $332,500 -19% $1,017,500 $2,063,775 -51%<br />
Nahiku 2 0 2 N/A $262,000 $0 N/A $262,000 $0 N/A $524,000 $0 N/A<br />
Napili/Kahana/Honokowai 14 11 3 27% $930,029 $618,158 50% $608,250 $678,000 -10% $13,020,400 $6,799,736 91%<br />
Olowalu 0 1 -1 -100% $0 $414,000 -100% $0 $414,000 -100% $0 $414,000 -100%<br />
Pukalani 14 24 -10 -42% $445,993 $586,471 -24% $479,500 $518,654 -8% $6,243,900 $14,075,308 -56%<br />
Sprecklesville/Paia/Kuau 6 9 -3 -33% $560,000 $624,567 -10% $394,000 $545,000 -28% $3,360,000 $5,621,100 -40%<br />
Wailea/Makena 11 6 5 83% $2,624,127 $1,875,000 40% $1,305,000 $1,147,500 14% $28,865,400 $11,250,000 157%<br />
<strong>Maui</strong> Summary:<br />
287 291 -4 -1% $700,714 $668,648 5% $450,000 $460,000 -2% $201,104,844 $194,576,469 3%<br />
SOURCE: REALTORS Association of <strong>Maui</strong> - www.RA<strong>Maui</strong>.com<br />
MLS Sale data - Information deemed reliable, however not guaranteed Page 10
Condominium Year To Date <strong>Sales</strong> Information<br />
Comparing 1/1/<strong>2012</strong> thru 4/30/<strong>2012</strong> with 1/1/2011 thru 4/30/2011<br />
Number of <strong>Sales</strong><br />
Average <strong>Sales</strong> Price<br />
Median <strong>Sales</strong> Price<br />
Total Dollar Volume<br />
Area<br />
Current<br />
YTD<br />
<strong>Sales</strong><br />
Year<br />
Ago<br />
YTD<br />
Changes<br />
Units %<br />
Current<br />
YTD<br />
Average<br />
Year Ago<br />
YTD<br />
Average<br />
Percent<br />
Change<br />
Current<br />
YTD<br />
Median<br />
Year Ago<br />
YTD<br />
Median<br />
Percent<br />
Change<br />
Current<br />
YTD<br />
Volume<br />
Year Ago<br />
YTD<br />
Volume<br />
Percent<br />
Change<br />
Central 38 45 -7 -16% $199,417 $197,623 1% $160,000 $175,000 -9% $7,577,860 $8,893,035 -15%<br />
Hana 1 0 1 N/A $465,000 $0 N/A $465,000 $0 N/A $465,000 $0 N/A<br />
Kaanapali 60 47 13 28% $575,155 $825,890 -30% $459,900 $650,000 -29% $34,509,300 $38,816,850 -11%<br />
Kapalua 16 8 8 100% $987,719 $892,538 11% $570,500 $576,000 -1% $15,803,500 $7,140,300 121%<br />
Kihei 149 159 -10 -6% $335,738 $316,465 6% $240,000 $260,000 -8% $50,024,915 $50,317,920 -1%<br />
Lahaina 25 21 4 19% $359,661 $424,970 -15% $346,676 $350,000 -1% $8,991,518 $8,924,360 1%<br />
Lanai 1 6 -5 -83% $585,000 $1,227,483 -52% $585,000 $1,022,700 -43% $585,000 $7,364,900 -92%<br />
Maalaea 12 16 -4 -25% $359,322 $297,541 21% $308,500 $304,575 1% $4,311,866 $4,760,650 -9%<br />
Molokai 2 5 -3 -60% $77,500 $124,780 -38% $77,500 $85,000 -9% $155,000 $623,900 -75%<br />
Napili/Kahana/Honokowai 84 77 7 9% $341,192 $290,718 17% $297,000 $260,000 14% $28,660,101 $22,385,299 28%<br />
Pukalani 2 1 1 100% $358,500 $320,000 12% $358,500 $320,000 12% $717,000 $320,000 124%<br />
Wailea/Makena 42 45 -3 -7% $1,188,170 $1,448,300 -18% $730,000 $829,000 -12% $49,903,125 $65,173,500 -23%<br />
<strong>Maui</strong> Summary:<br />
432 430 2 0% $466,908 $499,350 -6% $350,000 $321,250 9% $201,704,185 $214,720,714 -6%<br />
SOURCE: REALTORS Association of <strong>Maui</strong> - www.RA<strong>Maui</strong>.com<br />
MLS Sale data - Information deemed reliable, however not guaranteed Page 11
Fee Simple Condominium Year To Date <strong>Sales</strong> Information<br />
Comparing 1/1/<strong>2012</strong> thru 4/30/<strong>2012</strong> with 1/1/2011 thru 4/30/2011<br />
Number of <strong>Sales</strong><br />
Average <strong>Sales</strong> Price<br />
Median <strong>Sales</strong> Price<br />
Total Dollar Volume<br />
Area<br />
Current<br />
YTD<br />
<strong>Sales</strong><br />
Year<br />
Ago<br />
YTD<br />
Changes<br />
Units %<br />
Current<br />
YTD<br />
Average<br />
Year Ago<br />
YTD<br />
Average<br />
Percent<br />
Change<br />
Current<br />
YTD<br />
Median<br />
Year Ago<br />
YTD<br />
Median<br />
Percent<br />
Change<br />
Current<br />
YTD<br />
Volume<br />
Year Ago<br />
YTD<br />
Volume<br />
Percent<br />
Change<br />
Central 38 45 -7 -16% $199,417 $197,623 1% $160,000 $175,000 -9% $7,577,860 $8,893,035 -15%<br />
Hana 1 0 1 N/A $465,000 $0 N/A $465,000 $0 N/A $465,000 $0 N/A<br />
Kaanapali 55 41 14 34% $604,387 $892,801 -32% $469,900 $690,000 -32% $33,241,300 $36,604,850 -9%<br />
Kapalua 16 8 8 100% $987,719 $892,538 11% $570,500 $576,000 -1% $15,803,500 $7,140,300 121%<br />
Kihei 148 159 -11 -7% $335,067 $316,465 6% $237,500 $260,000 -9% $49,589,915 $50,317,920 -1%<br />
Lahaina 23 21 2 10% $382,001 $424,970 -10% $350,000 $350,000 0% $8,786,018 $8,924,360 -2%<br />
Lanai 1 6 -5 -83% $585,000 $1,227,483 -52% $585,000 $1,022,700 -43% $585,000 $7,364,900 -92%<br />
Maalaea 10 9 1 11% $399,787 $397,906 0% $365,000 $399,000 -9% $3,997,866 $3,581,150 12%<br />
Molokai 2 4 -2 -50% $77,500 $140,500 -45% $77,500 $130,000 -40% $155,000 $562,000 -72%<br />
Napili/Kahana/Honokowai 72 58 14 24% $349,669 $303,360 15% $304,500 $260,000 17% $25,176,201 $17,594,899 43%<br />
Pukalani 2 1 1 100% $358,500 $320,000 12% $358,500 $320,000 12% $717,000 $320,000 124%<br />
Wailea/Makena 42 45 -3 -7% $1,188,170 $1,448,300 -18% $730,000 $829,000 -12% $49,903,125 $65,173,500 -23%<br />
<strong>Maui</strong> Summary:<br />
410 397 13 3% $478,043 $520,093 -8% $357,995 $335,000 7% $195,997,785 $206,476,914 -5%<br />
SOURCE: REALTORS Association of <strong>Maui</strong> - www.RA<strong>Maui</strong>.com<br />
MLS Sale data - Information deemed reliable, however not guaranteed Page 12
Leasehold Condominium Year To Date <strong>Sales</strong> Information<br />
Comparing 1/1/<strong>2012</strong> thru 4/30/<strong>2012</strong> with 1/1/2011 thru 4/30/2011<br />
Number of <strong>Sales</strong><br />
Average <strong>Sales</strong> Price<br />
Median <strong>Sales</strong> Price<br />
Total Dollar Volume<br />
Area<br />
Current<br />
YTD<br />
<strong>Sales</strong><br />
Year<br />
Ago<br />
YTD<br />
Changes<br />
Units %<br />
Current<br />
YTD<br />
Average<br />
Year Ago<br />
YTD<br />
Average<br />
Percent<br />
Change<br />
Current<br />
YTD<br />
Median<br />
Year Ago<br />
YTD<br />
Median<br />
Percent<br />
Change<br />
Current<br />
YTD<br />
Volume<br />
Year Ago<br />
YTD<br />
Volume<br />
Percent<br />
Change<br />
Kaanapali 5 6 -1 -17% $253,600 $368,667 -31% $230,000 $241,000 -5% $1,268,000 $2,212,000 -43%<br />
Kihei 1 0 1 N/A $435,000 $0 N/A $435,000 $0 N/A $435,000 $0 N/A<br />
Lahaina 2 0 2 N/A $102,750 $0 N/A $102,750 $0 N/A $205,500 $0 N/A<br />
Maalaea 2 7 -5 -71% $157,000 $168,500 -7% $157,000 $150,000 5% $314,000 $1,179,500 -73%<br />
Molokai 0 1 -1 -100% $0 $61,900 -100% $0 $61,900 -100% $0 $61,900 -100%<br />
Napili/Kahana/Honokowai 12 19 -7 -37% $290,325 $252,126 15% $194,000 $230,000 -16% $3,483,900 $4,790,400 -27%<br />
<strong>Maui</strong> Summary:<br />
22 33 -11 -33% $259,382 $249,812 4% $221,500 $205,000 8% $5,706,400 $8,243,800 -31%<br />
SOURCE: REALTORS Association of <strong>Maui</strong> - www.RA<strong>Maui</strong>.com<br />
MLS Sale data - Information deemed reliable, however not guaranteed Page 13
Land Year To Date <strong>Sales</strong> Information<br />
Comparing 1/1/<strong>2012</strong> thru 4/30/<strong>2012</strong> with 1/1/2011 thru 4/30/2011<br />
Number of <strong>Sales</strong><br />
Average <strong>Sales</strong> Price<br />
Median <strong>Sales</strong> Price<br />
Total Dollar Volume<br />
Area<br />
Current<br />
YTD<br />
<strong>Sales</strong><br />
Year<br />
Ago<br />
YTD<br />
Changes<br />
Units %<br />
Current<br />
YTD<br />
Average<br />
Year Ago<br />
YTD<br />
Average<br />
Percent<br />
Change<br />
Current<br />
YTD<br />
Median<br />
Year Ago<br />
YTD<br />
Median<br />
Percent<br />
Change<br />
Current<br />
YTD<br />
Volume<br />
Year Ago<br />
YTD<br />
Volume<br />
Percent<br />
Change<br />
Central 12 6 6 100% $294,092 $500,867 -41% $191,500 $409,749 -53% $3,529,100 $3,005,200 17%<br />
Haiku 8 5 3 60% $484,563 $436,000 11% $406,250 $300,000 35% $3,876,500 $2,180,000 78%<br />
Hana 1 0 1 N/A $335,000 $0 N/A $335,000 $0 N/A $335,000 $0 N/A<br />
Kaanapali 5 6 -1 -17% $416,000 $487,250 -15% $400,000 $530,000 -25% $2,080,000 $2,923,500 -29%<br />
Kahakuloa 1 3 -2 -67% $140,000 $295,138 -53% $140,000 $280,000 -50% $140,000 $885,415 -84%<br />
Kapalua 1 3 -2 -67% $1,600,000 $893,333 79% $1,600,000 $1,000,000 60% $1,600,000 $2,680,000 -40%<br />
Keanae 0 0 0 N/A $0 $0 N/A $0 $0 N/A $0 $0 N/A<br />
Kihei 2 4 -2 -50% $642,500 $1,432,500 -55% $642,500 $330,000 95% $1,285,000 $5,730,000 -78%<br />
Kipahulu 0 0 0 N/A $0 $0 N/A $0 $0 N/A $0 $0 N/A<br />
Kula/Ulupalakua/Kanaio 6 4 2 50% $849,667 $391,250 117% $890,000 $372,500 139% $5,098,000 $1,565,000 226%<br />
Lahaina 4 3 1 33% $886,250 $735,000 21% $967,500 $790,000 22% $3,545,000 $2,205,000 61%<br />
Lanai 0 0 0 N/A $0 $0 N/A $0 $0 N/A $0 $0 N/A<br />
Makawao/Olinda/Haliimaile 2 1 1 100% $322,500 $259,000 25% $322,500 $259,000 25% $645,000 $259,000 149%<br />
Molokai 5 4 1 25% $137,400 $132,532 4% $54,000 $132,500 -59% $687,000 $530,126 30%<br />
Napili/Kahana/Honokowai 2 1 1 100% $271,425 $265,000 2% $271,425 $265,000 2% $542,850 $265,000 105%<br />
Olowalu 1 0 1 N/A $575,000 $0 N/A $575,000 $0 N/A $575,000 $0 N/A<br />
Pukalani 0 0 0 N/A $0 $0 N/A $0 $0 N/A $0 $0 N/A<br />
Wailea/Makena 0 1 -1 -100% $0 $7,300,000 -100% $0 $7,300,000 -100% $0 $7,300,000 -100%<br />
<strong>Maui</strong> Summary:<br />
50 41 9 22% $478,769 $720,201 -34% $393,750 $350,000 13% $23,938,450 $29,528,241 -19%<br />
SOURCE: REALTORS Association of <strong>Maui</strong> - www.RA<strong>Maui</strong>.com<br />
MLS Sale data - Information deemed reliable, however not guaranteed Page 14