Mobinil - Rasmala Investment Bank
Mobinil - Rasmala Investment Bank
Mobinil - Rasmala Investment Bank

Create successful ePaper yourself
Turn your PDF publications into a flip-book with our unique Google optimized e-Paper software.
Equity | Egypt | Telecommunications<br />
12 May 2010<br />
Initiation of coverage<br />
Buy<br />
Target price<br />
E£243.41<br />
Price<br />
E£191.20<br />
Short term (0-60 days)<br />
n/a<br />
Sector view<br />
No Weighting<br />
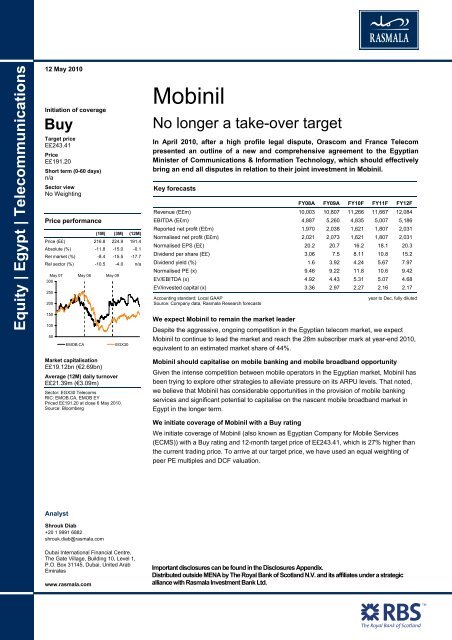
Price performance<br />
(1M) (3M) (12M)<br />
Price (E£) 216.8 224.9 191.4<br />
Absolute (%) -11.8 -15.0 -0.1<br />
Rel market (%) -8.4 -15.5 -17.7<br />
Rel sector (%) -10.5 -4.0 n/a<br />
May 07 May 08 May 09<br />
300<br />
250<br />
200<br />
150<br />
100<br />
50<br />
EMOB.CA<br />
EGX30<br />
<strong>Mobinil</strong><br />
No longer a take-over target<br />
In April 2010, after a high profile legal dispute, Orascom and France Telecom<br />
presented an outline of a new and comprehensive agreement to the Egyptian<br />
Minister of Communications & Information Technology, which should effectively<br />
bring an end all disputes in relation to their joint investment in <strong>Mobinil</strong>.<br />
Key forecasts<br />
FY08A FY09A FY10F FY11F FY12F<br />
Revenue (E£m) 10,003 10,807 11,266 11,667 12,084<br />
EBITDA (E£m) 4,887 5,260 4,835 5,007 5,186<br />
Reported net profit (E£m) 1,970 2,038 1,621 1,807 2,031<br />
Normalised net profit (E£m) 2,021 2,073 1,621 1,807 2,031<br />
Normalised EPS (E£) 20.2 20.7 16.2 18.1 20.3<br />
Dividend per share (E£) 3.06 7.5 8.11 10.8 15.2<br />
Dividend yield (%) 1.6 3.92 4.24 5.67 7.97<br />
Normalised PE (x) 9.46 9.22 11.8 10.6 9.42<br />
EV/EBITDA (x) 4.92 4.43 5.31 5.07 4.68<br />
EV/invested capital (x) 3.36 2.97 2.27 2.16 2.17<br />
Accounting standard: Local GAAP<br />
Source: Company data, <strong>Rasmala</strong> Research forecasts<br />
year to Dec, fully diluted<br />
We expect <strong>Mobinil</strong> to remain the market leader<br />
Despite the aggressive, ongoing competition in the Egyptian telecom market, we expect<br />
<strong>Mobinil</strong> to continue to lead the market and reach the 28m subscriber mark at year-end 2010,<br />
equivalent to an estimated market share of 44%.<br />
Market capitalisation<br />
E£19.12bn (€2.69bn)<br />
Average (12M) daily turnover<br />
E£21.39m (€3.09m)<br />
Sector: EGX30 Telecoms<br />
RIC: EMOB.CA, EMOB EY<br />
Priced E£191.20 at close 6 May 2010.<br />
Source: Bloomberg<br />
<strong>Mobinil</strong> should capitalise on mobile banking and mobile broadband opportunity<br />
Given the intense competition between mobile operators in the Egyptian market, <strong>Mobinil</strong> has<br />
been trying to explore other strategies to alleviate pressure on its ARPU levels. That noted,<br />
we believe that <strong>Mobinil</strong> has considerable opportunities in the provision of mobile banking<br />
services and significant potential to capitalise on the nascent mobile broadband market in<br />
Egypt in the longer term.<br />
We initiate coverage of <strong>Mobinil</strong> with a Buy rating<br />
We initiate coverage of <strong>Mobinil</strong> (also known as Egyptian Company for Mobile Services<br />
(ECMS)) with a Buy rating and 12-month target price of E£243.41, which is 27% higher than<br />
the current trading price. To arrive at our target price, we have used an equal weighting of<br />
peer PE multiples and DCF valuation.<br />
Analyst<br />
Shrouk Diab<br />
+20 1 9991 6882<br />
shrouk.diab@rasmala.com<br />
Dubai International Financial Centre,<br />
The Gate Village, Building 10, Level 1,<br />
P.O. Box 31145, Dubai, United Arab<br />
Emirates<br />
www.rasmala.com<br />
Important disclosures can be found in the Disclosures Appendix.<br />
Distributed outside MENA by The Royal <strong>Bank</strong> of Scotland N.V. and its affiliates under a strategic<br />
alliance with <strong>Rasmala</strong> <strong>Investment</strong> <strong>Bank</strong> Ltd.
<strong>Investment</strong> view<br />
We expect intense competition in the Egyptian market to push prices down further,<br />
propelling mobile penetration to reach c100% by 2015F. We think <strong>Mobinil</strong> will remain the<br />
market leader and can capitalise on its larger subscriber base, once competition stabilises.<br />
Underlying growth drivers<br />
Launch of mobile banking<br />
services<br />
We expect <strong>Mobinil</strong> to remain the<br />
market leader<br />
Mobile broadband opportunity<br />
Possibility of higher dividends<br />
distribution<br />
<strong>Mobinil</strong> is in the process of finalising discussions with the Central <strong>Bank</strong> of Egypt (CBE) for the<br />
setup of a mechanism for offering mobile banking services in the Egyptian market. With Egyptian<br />
banking penetration rates standing at less than 10% of the total Egyptian population, (equivalent<br />
to an average of 8.0m individuals with banking accounts), <strong>Mobinil</strong>, which commands a 24m<br />
subscriber base as of year-end 2009, has significant potential to capitalise on both the banked<br />
and the un-banked segment of its subscriber base.<br />
We expect <strong>Mobinil</strong> to continue to lead the market and reach the 28m subscriber mark at year-end<br />
2010, equivalent to an estimated market share of 44%. Given our belief that <strong>Mobinil</strong> would<br />
continue to remain the market leader, it should be able to capitalise on its larger subscriber base,<br />
once competition starts to stabilise in the market.<br />
According to the International Telecommunications Union (ITU) by the end of 2008, total mobile<br />
broadband penetration reached 4.9%, equivalent to 4m subscribers. According to <strong>Mobinil</strong>’s<br />
management, as at the end of 2009, revenue from broadband constituted less than 3% of<br />
<strong>Mobinil</strong>’s total revenue, while total mobile broadband subscribers were still under the 1m mark.<br />
Given that <strong>Mobinil</strong> has recently upgraded its network to 3G and is still in the process of receiving<br />
spectrum from the National Telecommunications Regulative Authority (NTRA), we believe there is<br />
significant potential for Egypt to capitalise on the nascent mobile broadband market in Egypt in the<br />
longer-term.<br />
During the last couple of years, <strong>Mobinil</strong> had significantly cut its dividend payout ratio to c16% in<br />
2008 and c36% in 2009, compared to c93% in 2007, due to strained access to bank financing. We<br />
believe if <strong>Mobinil</strong>’s management decides to resume its former higher dividend payout ratio that it<br />
would be a positive catalyst for the stock, since top line growth seems to be under pressure in the<br />
short to medium term.<br />
Valuation and target price<br />
We initiate coverage of <strong>Mobinil</strong> (also known as Egyptian Company for Mobile Services (ECMS))<br />
with a Buy rating and 12-month target price of E£243.41, which is 27% higher than the current<br />
trading price. To arrive at our target price, we have used an equal weighting of peer PE multiples<br />
and DCF valuation.<br />
Discounted cash flow<br />
<strong>Mobinil</strong>’s DCF valuation yields a 12-month fair value of E£276.3 per share. The assumptions<br />
underlying our DCF valuations are a 14.0% cost of equity, based on a risk-free rate of 9.0% and<br />
an equity-risk premium of 5.0%. We also use a 3.5% terminal growth, a WACC of 13%, a 12.0%<br />
cost of debt and a beta of 1x.<br />
<strong>Mobinil</strong> | <strong>Investment</strong> View | 12 May 2010 2<br />
34
Table 1 : DCF valuation<br />
(E£m) Free cash flow PV of FCF<br />
2010 -1,090 -1,174<br />
2011 2,133 1,775<br />
2012 3,091 2,279<br />
2013 3,862 2,503<br />
2014 4,026 2,262<br />
2015 4,346 2,139<br />
Terminal value 44,716 22,011<br />
Enterprise value 31,797<br />
Minus: net debt 4,166<br />
Equity value 27,631<br />
Number of shares 100<br />
12-month fair value per share 276.3<br />
Source: Company data, <strong>Rasmala</strong> estimates<br />
We have also undertaken a sensitivity analysis, using different rates for the cost of equity and<br />
terminal growth rate to illustrate how sensitive our DCF-based target price is to changes in these<br />
assumptions.<br />
Table 2 : DCF sensitivity analysis<br />
(E£ per share)<br />
Cost of equity<br />
Terminal growth rate 12.00% 13.00% 14.00% 15.00% 16.00%<br />
1.50% 236.3 236.3 236.3 236.2 236.2<br />
2.50% 254.5 254.5 254.5 254.4 254.4<br />
3.50% 276.3 276.4 276.3 276.3 276.2<br />
4.50% 303.1 303.0 303.0 302.9 302.9<br />
5.50% 336.3 336.4 336.2 336.2 336..2<br />
Source: <strong>Rasmala</strong> estimates<br />
Peer valuation<br />
Our peer group valuation, which comprises average PE multiples for FY10F of 13.1x and FY11F<br />
of 11.5x for our coverage universe, gives us a fair value of E£210.48 per share.<br />
Table 3 : Estimated PE 2010 and 2011 for telecom peers<br />
Peers PE 2010F PE 2011F<br />
Telefonos de Mexico 8.8 8.5<br />
Reliance Industries 19.6 14.1<br />
Telekom Malaysia 23.1 21.3<br />
Globe Telecom Inc 9.8 9.4<br />
Advanced Info Service 12.8 12.3<br />
Indosat TBK 17.7 14.9<br />
MTN Group 10.48 8.8<br />
Excelcomindo Pratama 15.4 12.4<br />
Turkcell Iletisim Hizmet 10.5 9.7<br />
Vodacom Group 10.53 9.2<br />
Bharti Airtel 12.3 13.2<br />
America Movil SAB de C 13 11.7<br />
China Telecom Corp 17.7 14.6<br />
Celtel Zambia 10.6 9.7<br />
Magyar 9.2 9.4<br />
Turk Telekomunikasyon 9.3 8.5<br />
Mobile Telesystems 12.6 7.8<br />
Average 13.1 11.5<br />
Source: Bloomberg<br />
How we differ from consensus<br />
We are lower than Bloomberg’s consensus estimates for 2010 and 2011 on revenues, EBITDA<br />
and EPS. Our base case assumes higher ARPU dilution due to a more aggressive climate in the<br />
Egyptian mobile sector.<br />
<strong>Mobinil</strong> | <strong>Investment</strong> View | 12 May 2010 3<br />
35
Risks to our central scenario<br />
Increased aggressive competition could lead to more strongly diluted ARPUs applying further<br />
pressure on EBITDA margins, since management has indicated that it is willing to sacrifice<br />
profitability in the short run, in order to capture and maintain market share.<br />
Losing the interconnection lawsuit with Telecom Egypt, would be a risk to our scenario, since we<br />
are applying the same pricing assumptions for <strong>Mobinil</strong> to account for interconnection rates. The<br />
loss of the lawsuit would mean higher-than-estimated operating expenses, in addition to the<br />
retroactive statement of the difference between the old and new interconnection rate, which<br />
according to management, the total interconnect dispute is around E£326m on net gross margin.<br />
It is worth mentioning that <strong>Mobinil</strong> does not provision against losing this lawsuit, since under<br />
current accounting rules, if there is more than a 50% probability of winning the lawsuit, provisions<br />
are not required.<br />
<strong>Mobinil</strong> | <strong>Investment</strong> View | 12 May 2010 4<br />
36
Company dynamics<br />
Competition remains intense in the Egyptian market, as the three operators try to establish<br />
and maintain their own market foothold.<br />
Operational strategy and forecasts<br />
Dynamics still highly attractive<br />
With a mobile penetration rate of approximately 66% at the end of December 2009, Egypt is<br />
among the most under penetrated countries in the region, even when compared to countries with<br />
similar PPP/Capita, namely Jordan and Morocco, as demonstrated in the table below. Although<br />
Egypt has a PPP/Capita comparable to Jordan and Morocco at the end of 2009, the mobile<br />
penetration rate is much lower. Egypt is still witnessing double-digit growth in its mobile market,<br />
illustrating further room for growth and that mobile saturation in the Egyptian market is still far<br />
away.<br />
Table 4 : Selected MENA key indicators as of 2009<br />
Country PPP/Capita (US$) Mobile penetration rate (%)<br />
Jordan 5,161 96%<br />
Morocco 4,597 80%<br />
Egypt 5,658 66%<br />
Source: EIU, <strong>Rasmala</strong><br />
We believe due to the relatively comparable economic conditions with both Morocco and Jordan<br />
and the increased level of liberalisation in the Egyptian telecommunications sector, that the<br />
Egyptian telecom sector has potential for strong growth in the coming years. That noted we<br />
expect Egypt’s mobile penetration rate to reach close to 100% by 2015, supported by a number of<br />
catalytic trends taking place in the industry, as explained later.<br />
Is a 100% mobile penetration rate achievable?<br />
In our view there are a number of developments that are taking place in the telecommunications<br />
industry that could help Egypt reach a mobile penetration rate close to 100%, which include:<br />
! Aggressive competition and promotional rollouts: Egypt’s three mobile operators have<br />
been staging competitive marketing campaigns in the past couple of years, designed to attract<br />
both the high and lower income segment of the population. Per second billing, fixing monthly<br />
postpaid fees for unlimited minutes usage as well as fixing international call rates according to<br />
country zones are all examples of promotions that were launched by the competing mobile<br />
operators.<br />
! Double sims trend: Relying on anecdotal evidence, the double sims trend has become more<br />
popular in the business sector specifically, where subscribers choose to have a sim for private<br />
usage and another one for business purposes. The introduction of Blackberries handsets and<br />
other business-specific handsets has further encouraged this trend.<br />
! Lower handset prices: In our view the continued lowering of handset prices and the rise of<br />
the second-hand handset markets, aids the widespread use of mobile usage, as it becomes<br />
more affordable for the lower-income segment, in particular, to afford the “mobile lifestyle”.<br />
Realising the significance of how the price of mobile handsets can be a significant barrier of<br />
entry for potential subscribers, mobile operators have also offered bundled packages, for<br />
instance, offering cheap handsets plus free minutes to add new subscribers.<br />
Competition remains aggressive in the Egyptian market<br />
Having paid US$2.9bn in 2007, UAE-based, Etisalat became the third mobile operator in the<br />
Egyptian mobile market, effectively ending <strong>Mobinil</strong> and Vodafone’s duopoly. The mobile license<br />
won by Etisalat included a 3G spectrum and a monopoly-breaking international voice<br />
gateway. Etisalat’s entrance into the Egyptian mobile market acted as a catalyst for<br />
subscriber growth, with annual net subscriber additions leaping to approximately 12m<br />
subscribers compared to a historical average of 4m annual net subscriber additions.<br />
<strong>Mobinil</strong> | <strong>Investment</strong> View | 12 May 2010 5<br />
37
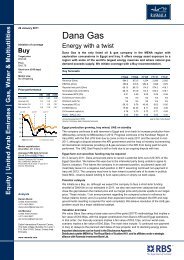
Chart 1 : Egypt mobile subscriber and penetration<br />
90<br />
80<br />
m<br />
100%<br />
90%<br />
70<br />
60<br />
50<br />
40<br />
30<br />
20<br />
10<br />
0<br />
`<br />
2003 2004 2005 2006 2007 2008 2009 2010E 2011F 2012F<br />
Total mobile subscribers (m) Penetration (%)<br />
80%<br />
70%<br />
60%<br />
50%<br />
40%<br />
30%<br />
20%<br />
10%<br />
0%<br />
Source: Company filings, Ministry of Communications, ITU, <strong>Rasmala</strong><br />
Competition remains intense in the Egyptian market, as the three operators are trying to establish<br />
and maintain their own market foothold. We believe the market position of the operators will<br />
determine the type of users each company attracts. <strong>Mobinil</strong> is more or less established as the<br />
brand for the masses and Vodafone markets itself as the global quality brand, while Etisalat is<br />
trying to position itself as the leading technology provider in the Egyptian mobile market by<br />
upgrading its network infrastructure from 3G to 3.75G.<br />
Given the continued rollout of competitive marketing promotions ranging from cross-net<br />
promotions, favourable on-net tariff schemes to fixing monthly postpaid fees for unlimited minutes<br />
usage, we still believe growth opportunities in the Egyptian market are significant, particularly with<br />
mobile broadband becoming more popular for both the business end-users and the youth<br />
segment of the population.<br />
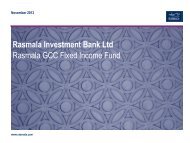
We expect <strong>Mobinil</strong> to remain the market leader<br />
We expect <strong>Mobinil</strong> to continue to lead the market and reach the 28m subscriber mark at year-end<br />
2010, equivalent to an estimated market share of 44%. We believe due to the ongoing intense<br />
competition in the Egyptian market, that overall prices are set to go down further, propelling<br />
mobile penetration rates to reach c100% by 2015. Given our belief that <strong>Mobinil</strong> would continue to<br />
remain the market leader, it should be able to capitalise on its larger subscriber base, once<br />
competition starts to stabilise in the market.<br />
Chart 2 : Mobile market share of operators (based on an active subscriber base)<br />
60%<br />
50%<br />
40%<br />
30%<br />
`<br />
20%<br />
10%<br />
0%<br />
2006 2007 2008 2009 2010E 2011F 2012F<br />
<strong>Mobinil</strong> Vodafone Etisalat<br />
Source: Company filings, <strong>Rasmala</strong><br />
<strong>Mobinil</strong> | <strong>Investment</strong> View | 12 May 2010 6<br />
38
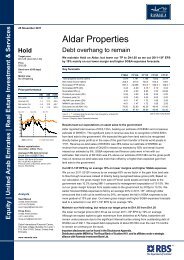
Chart 3 : <strong>Mobinil</strong> subscribers and market share<br />
40<br />
m<br />
48%<br />
35<br />
30<br />
25<br />
20<br />
47%<br />
46%<br />
45%<br />
15<br />
10<br />
5<br />
0<br />
`<br />
2008 2009 2010E 2011F 2012F<br />
44%<br />
43%<br />
42%<br />
<strong>Mobinil</strong> mobile subscribers<br />
<strong>Mobinil</strong> market share<br />
Source: Company data, <strong>Rasmala</strong><br />
Possibility of a fourth mobile licence<br />
The NTRA stated in January 2010, that it may licence for a fourth mobile operator if the current<br />
three mobile firms do not comply with pricing regulations. However, no further details were<br />
released as yet, whether an issuance will actually occur or not.<br />
Mobile broadband opportunity<br />
We still believe the broadband story in Egypt is largely underrated by the market, mainly because<br />
the contribution of the broadband business overall to revenue has remained minimal, so far.<br />
However, we strongly believe declining prices of personal computers will drive the up-take of<br />
broadband services in the same manner as declining prices of mobile handsets drove the<br />
increase of mobile penetration rates.<br />
The Egyptian Minister of Communication and IT had announced a plan to increase broadband<br />
penetration fourfold in the next four years to 4m households, with total investments expected to<br />
reach US$1bn within the next four years.<br />
According to the International Telecommunications Union (ITU) by the end of 2008, total mobile<br />
broadband penetration reached 4.9%, equivalent to 4m subscribers. According to <strong>Mobinil</strong>’s<br />
management, as at the end of 2009, revenue from broadband constituted less than 3% of<br />
<strong>Mobinil</strong>’s total revenue, while total mobile broadband subscribers were still under the 1m mark.<br />
Given that <strong>Mobinil</strong> has recently upgraded its network to 3G and is still in the process of receiving<br />
spectrum from the National Telecommunications Regulative Authority (NTRA), we believe there is<br />
significant potential for Egypt to capitalise on the nascent mobile broadband market in Egypt in the<br />
longer-term.<br />
Looking at a similar example of the potential of data revenue contribution for a telecom operator,<br />
Saudi-based, Mobily announced in its FY09 results, that data revenues contributed c14% of its<br />
total revenues, while <strong>Mobinil</strong> management stated that data revenues constituted less than 3% of<br />
overall revenues year-end 2009, signifying the importance of data revenues in the future of<br />
telecom operators.<br />
Launch of mobile banking services<br />
Amid a highly competitive market, declining ARPUs and an increasing churn rate, (<strong>Mobinil</strong> posted<br />
churn of 35% year-end 2009 compared to 30% year-end 2008), <strong>Mobinil</strong> has been trying to explore<br />
other strategies to mitigate its declining ARPU levels and churn rate. In that line of thought,<br />
<strong>Mobinil</strong> had been for some time trying to launch mobile banking services in the Egyptian market.<br />
<strong>Mobinil</strong> is in still in the process of finalising discussions with the Central <strong>Bank</strong> of Egypt (CBE) for<br />
the setup of a mechanism for offering mobile banking services in the Egyptian market. With<br />
Egyptian banking penetration rates standing at less than 10% of the total Egyptian population,<br />
(equivalent to an average of 8.0m individuals with banking accounts), <strong>Mobinil</strong>, which commands a<br />
24m subscriber base, has significant potential to capitalise on both the banked and the un-banked<br />
segment of its subscriber base.<br />
Given the conservative nature of the banking industry in Egypt, whereby total loans to deposits<br />
<strong>Mobinil</strong> | <strong>Investment</strong> View | 12 May 2010 7<br />
39
currently stand at less than c60%, and the low banking penetration rate of c10%, we believe there<br />
is significant potential for this service.<br />
Chart 4 : <strong>Mobinil</strong> revenue and growth<br />
Chart 5 : <strong>Mobinil</strong> EBITDA and EBITDA margin<br />
14,000<br />
EGP m<br />
25%<br />
5,300<br />
EGP m<br />
50%<br />
12,000<br />
10,000<br />
20%<br />
5,200<br />
5,100<br />
49%<br />
48%<br />
47%<br />
8,000<br />
15%<br />
5,000<br />
46%<br />
45%<br />
6,000<br />
4,000<br />
`<br />
10%<br />
4,900<br />
4,800<br />
`<br />
44%<br />
43%<br />
42%<br />
2,000<br />
5%<br />
4,700<br />
41%<br />
40%<br />
0<br />
2008 2009 2010E 2011F 2012F<br />
0%<br />
4,600<br />
2008 2009 2010E 2011F 2012F<br />
39%<br />
<strong>Mobinil</strong> revenue<br />
Revenue growth<br />
<strong>Mobinil</strong> EBITDA<br />
<strong>Mobinil</strong> EBITDA margin<br />
Source: Company data, <strong>Rasmala</strong><br />
Source: Company data, <strong>Rasmala</strong><br />
Issuance of E£1.5bn bond facilitates meeting debt obligations<br />
Besides capex spending in 2010, <strong>Mobinil</strong> has recently paid its third 3G instalment of E£750m in<br />
January 2010, in addition to the tail end payment of E£1.1bn for the second five megahertz of 3G<br />
frequency, which is expected to be paid in December 2010. Additionally, <strong>Mobinil</strong> was expected to<br />
pay approximately E£750m for its 2G frequencies; however, since <strong>Mobinil</strong> did not receive those<br />
2G frequencies, payment was postponed, and is expected to be paid sometime during 2010,<br />
pending deliverance. In addition, <strong>Mobinil</strong> is interested in acquiring LinkDotNet, Orascom<br />
Telecom's internet subsidiary arm that was offered for sale during 2009.<br />
Given <strong>Mobinil</strong>’s sizeable cash commitments during 2010, <strong>Mobinil</strong> had resorted to cutting its<br />
dividend payout ratio to 21% at the end of June 2009 versus 68% in the comparable period yoy in<br />
an effort to finance its cash needs internally, since it faced difficulties in acquiring new credit<br />
facilities from banks.<br />
Recently however, <strong>Mobinil</strong> issued an E£1.5bn bond, with the aim of financing its capital and<br />
investment expansions required for the growth and development of its mobile network in addition<br />
to other general uses. The success of this bond issue should be able to aid <strong>Mobinil</strong> with the<br />
payment of its cash obligations during 2010, and may in effect also help finance a larger dividend<br />
distribution if management decides to resume its former higher dividend payout ratio. The 5-year<br />
bond has a fixed annual yield of 12.25% payable semi-annually and has been partially used to<br />
pay a part of the E£750m 3G instalment. The bond has witnessed strong demand as the tranche<br />
offered to retail investors, worth E£100m has been covered 11.4 times and the tranche targeted at<br />
institutional investors, worth E£1.4bn, has been oversubscribed by 1.4 times.<br />
Orascom Telecom and France Telecom ceasefire<br />
In April 2010, following a lengthy and high profile legal dispute between Orascom Telecom<br />
Holding and France Telecom, France Telecom and Orascom Telecom Holding presented an<br />
outline of a new and comprehensive agreement on <strong>Mobinil</strong> and ECMS to the Egyptian Minister of<br />
Communications & Information Technology. The agreement, which has been signed will be<br />
finalised over the forthcoming period, and should effectively bring an end all disputes in relation to<br />
their joint investment in <strong>Mobinil</strong>.<br />
As a result of the reconciliation between France Telecom and Orascom Telecom, the integration<br />
of LINKdotNET (a subsidiary of Orascom Telecom offered for sale) into <strong>Mobinil</strong>, allowing the<br />
<strong>Mobinil</strong> , subject to the approval of its corporate bodies, to extend broadband and corporate<br />
communications services.<br />
<strong>Mobinil</strong> | <strong>Investment</strong> View | 12 May 2010 8<br />
40
France Telecom/Orascom Telecom Holding dispute<br />
The dispute between France Telecom and Orascom Telecom Holding over the ownership of<br />
<strong>Mobinil</strong> was a very lengthy and highly publicised issue and over the course of the past year.<br />
Egyptian Financial Supervisory Authority (EFSA) accepts offer from France Telecom<br />
Following a lengthy and high profile legal dispute between Orascom Telecom Holding and France<br />
Telecom, the Egyptian Financial Supervisory Authority (EFSA) accepted an offer from France<br />
Telecom's subsidiary, Orange Participations, to buy up to 100% of Egyptian Company for Mobile<br />
Services (ECMS)-<strong>Mobinil</strong> at a price of E£245 per share, which at the time of the offer, represented<br />
17.6% premium to <strong>Mobinil</strong>'s closing price.<br />
The EFSA’s approval of the tender offer came after the rejection of three consecutive 100%<br />
tender offers presented before by France Telecom, at the prices of E£187, E£237 and E£230 per<br />
share, respectively. The previous offers were rejected, because the EFSA claimed that the offers<br />
did not protect minority shareholders' rights and were different from that offered to Orascom<br />
Telecom for its stake in <strong>Mobinil</strong> Telecom.<br />
According to the EFSA (Egyptian Financial Supervisory Authority), its recent approval on the<br />
difference between the arbitration ruling price of E£273 per share and the E£245 per share was<br />
justified by two reasons. The first concerns management fees, which are paid by ECMS to <strong>Mobinil</strong><br />
Telecom, and thus, should be excluded from the value of ECMS. The other reason was cash<br />
balance at <strong>Mobinil</strong> Telecom's holding level, and thus, owned only by <strong>Mobinil</strong> Telecom<br />
shareholders.<br />
France Telecom's move to buyout <strong>Mobinil</strong>, came following an arbitration court ruling in April 2009,<br />
which France Telecom won, and had the right to buy out the Orascom Telecom's stake in <strong>Mobinil</strong><br />
Telecom. <strong>Mobinil</strong> Telecom is an Egyptian company that was formed for the specific purpose of<br />
acquiring Egypt's first mobile license, which currently holds a 51% stake in Egyptian Company for<br />
Mobile Services (ECMS), branded as <strong>Mobinil</strong> and listed on the Egyptian Stock Exchange. Since<br />
the arbitration court ruling triggered a 100% mandatory buyout, France Telecom at the time<br />
argued that it should not have to pay the same amount for freely traded shares as it was ordered<br />
to pay for shares in <strong>Mobinil</strong> Telecom.<br />
Orascom Telecom appealed the EFSA’s decision<br />
Chairman, Naguib Sawiris, stated that Orascom Telecom Holding would launch an appeal<br />
protesting against the EFSA’s decision to approve FT’s offer, and with regards to Orascom<br />
Telecom’s 34.66% stake in <strong>Mobinil</strong> (comprised of an indirect stake of 14.66% and a direct stake of<br />
20%), Orascom Telecom management stated that it is under no legal obligation to sell any part of<br />
its holding in <strong>Mobinil</strong>, since the time for compliance with the arbitration award that originally gave<br />
rise to that offer expired in April 2009.<br />
In May 2009, Orascom Telecom had filed a case before the Appeal Division of the Economic<br />
Court, requesting, as its primary claim, a declaration that the share sale agreement arising out of<br />
the arbitration Award issued on the 10th of March, 2009 has been rescinded due to France<br />
Telecom’s (and its subsidiaries') failure to pay the price of the shares by the time stipulated in the<br />
arbitration award.<br />
The Egyptian court blocked FT’s offer<br />
The Egyptian Financial Supervisory Authority (EFSA) stated that due to the court ruling France<br />
Telecom’s offer will be halted. France Telecom said in a statement that it regretted the decision<br />
and would seek to have the tender offer reinstated. The company also stated that the next hearing<br />
would be on 13 February 2010. It is worth noting that during the purchase offer period of France<br />
Telecom from December 15 to January 14, 5% of <strong>Mobinil</strong>’s shares were offered, the regulator<br />
stated that these selling offers were to be cancelled. This court ruling comes one day before the<br />
end of the tender offer period for France Telecom's subsidiary Orange Participations to buy all<br />
<strong>Mobinil</strong>'s outstanding shares at E£245 per share.<br />
France Telecom and Orascom Telecom come to an agreement<br />
In April 2010, France Telecom and Orascom Telecom Holding presented an outline of a new and<br />
comprehensive agreement on <strong>Mobinil</strong> and ECMS to the Egyptian Minister of Communications &<br />
Information Technology. The agreement, which has been signed will be finalised over the<br />
forthcoming period, and should effectively bring an end all disputes in relation to their joint<br />
<strong>Mobinil</strong> | <strong>Investment</strong> View | 12 May 2010 9<br />
41
investment in <strong>Mobinil</strong>. The two groups will continue their partnership on a renewed basis going<br />
forward, implementing a revised shareholder agreement but with no change to the existing<br />
ownership structure or their shareholders’ voting rights. The agreement also includes the<br />
integration of LINKdotNET – the leading ISP in Egypt – into ECMS, allowing the company, subject<br />
to the approval of its corporate bodies, to extend broadband and corporate communications<br />
services. The amended shareholder agreement will avail Orascom Telecom Holding operational<br />
rights commensurate with its co-owner and strategic partner position, in addition to significant<br />
protection and liquidity rights. Going forward, Orascom Telecom Holding will consolidate its<br />
participation in ECMS through equity method. As a result of the amended shareholder agreement,<br />
France Telecom will change its accounting method and will fully consolidate ECMS (ECMS was<br />
consolidated through proportional integration in 2009 and before).<br />
<strong>Mobinil</strong> | <strong>Investment</strong> View | 12 May 2010 10<br />
42
Appendix<br />
Company overview<br />
The Egyptian Company for Mobile Services (ECMS) – <strong>Mobinil</strong>, Egypt’s leading wireless telecom<br />
operator, was established in 1998 through a strategic partnership between three major telecom<br />
companies – France Telecom, Orascom Telecom, and Motorola. The company’s ownership<br />
underwent a structural change after the exit of Motorola in 2001 and the transfer of France<br />
Telecom’s holding to Orange Telecom. <strong>Mobinil</strong>’s strategy of strengthening its technology alliances<br />
with major telecom players such as Alcatel and Motorola facilitated the launch of services like<br />
<strong>Mobinil</strong> Life (GPRS) and <strong>Mobinil</strong> Business Solutions (Customized Solutions for Business). <strong>Mobinil</strong><br />
was the first to establish roaming agreements with operators in many countries, including those in<br />
North and South America. Starting from September 1st, 2008, <strong>Mobinil</strong> upgraded and its network<br />
infrastructure to offer 3G services.<br />
<strong>Mobinil</strong> | <strong>Investment</strong> View | 12 May 2010 11<br />
43
Income statement<br />
E£m FY08A FY09A FY10F FY11F FY12F<br />
Revenue 10003 10807 11266 11667 12084<br />
Cost of sales -2057 -2039 -2253 -2333 -2417<br />
Operating costs -3058 -3508 -4178 -4327 -4482<br />
EBITDA 4887 5260 4835 5007 5186<br />
DDA & Impairment (ex gw) -1710 -1942 -1932 -1942 -1994<br />
EBITA 3177 3318 2903 3064 3192<br />
Goodwill (amort/impaired) 0.00 0.00 0.00 0.00 0.00<br />
EBIT 3177 3318 2903 3064 3192<br />
Net interest -546.2 -688.0 -747.7 -671.4 -511.8<br />
Associates (pre-tax) 0.00 0.00 0.00 0.00 0.00<br />
Other pre-tax items -162.8 -56.7 -108.0 -111.8 -115.8<br />
Reported PTP 2468 2573 2047 2281 2564<br />
Taxation -499.0 -535.6 -426.1 -474.8 -533.7<br />
Minority interests 1.17 0.43 0.29 0.31 0.32<br />
Other post-tax items 0.00 0.00 0.00 0.00 0.00<br />
Reported net profit 1970 2038 1621 1807 2031<br />
Tot normalised items -50.3 -35.1 0.00 0.00 0.00<br />
Normalised EBITDA 4887 5260 4835 5007 5186<br />
Normalised PTP 2518 2608 2047 2281 2564<br />
Normalised net profit 2021 2073 1621 1807 2031<br />
Source: Company data, <strong>Rasmala</strong> Research forecasts<br />
year to Dec<br />
Balance sheet<br />
E£m FY08A FY09A FY10F FY11F FY12F<br />
Cash & market secs (1) 650.5 813.9 506.3 28.7 159.7<br />
Other current assets 937.1 1055 1180 1262 1370<br />
Tangible fixed assets 8871 9800 10347 10155 9369<br />
Intang assets (incl gw) 3187 2956 4806 5556 5556<br />
Oth non-curr assets 13.0 13.5 20.5 27.5 34.5<br />
Total assets 13658 14640 16860 17030 16491<br />
Short term debt (2) 374.8 559.4 0.00 0.00 0.00<br />
Trade & oth current liab 5054 5441 4423 4718 5050<br />
Long term debt (3) 4848 4013 6738 5940 4518<br />
Oth non-current liab 1139 947.5 967.0 893.5 907.0<br />
Total liabilities 11416 10961 12128 11552 10475<br />
Total equity (incl min) 2242 3679 4732 5478 6015<br />
Total liab & sh equity 13658 14640 16860 17030 16491<br />
Net debt 4900 4166 6559 6238 5145<br />
Source: Company data, <strong>Rasmala</strong> Research forecasts<br />
year ended Dec<br />
Cash flow statement<br />
E£m FY08A FY09A FY10F FY11F FY12F<br />
EBITDA 4887 5260 4835 5007 5186<br />
Change in working capital -278.0 -1575 -1062 212.8 -236.3<br />
Net interest (pd) / rec -490.8 688.0 -747.7 -671.4 -511.8<br />
Taxes paid -562.3 -330.9 -426.1 -474.8 -533.7<br />
Other oper cash items 0.00 0.00 0.00 0.00 0.00<br />
Cash flow from ops (1) 3556 4042 2599 4073 3904<br />
Capex (2) -2671 -2241 -4329 -2500 -1208<br />
Disposals/(acquisitions) 0.00 0.00 0.00 0.00 0.00<br />
Other investing cash flow -861.2 -123.6 -7.00 -7.00 -7.00<br />
Cash flow from invest (3) -3532 -2365 -4336 -2507 -1215<br />
Incr / (decr) in equity 0.00 0.00 0.00 0.00 0.00<br />
Incr / (decr) in debt 0.00 0.00 0.00 0.00 0.00<br />
Ordinary dividend paid -1197 -931.8 -810.7 -1084 -1523<br />
Preferred dividends (4) 0.00 0.00 0.00 0.00 0.00<br />
Other financing cash flow 1403 -767.2 2105 -871.9 -948.5<br />
Cash flow from fin (5) 206.2 -1699 1294 -1956 -2472<br />
Forex & disc ops (6) 5.34 184.6 134.6 -87.8 -85.8<br />
Inc/(decr) cash (1+3+5+6) 235.6 163.4 -307.6 -477.6 131.1<br />
Equity FCF (1+2+4) 885.2 1801 -1730 1573 2695<br />
Source: Company data, <strong>Rasmala</strong> Research forecasts<br />
year to Dec<br />
<strong>Mobinil</strong> | Key Financial Data | 12 May 2010<br />
44
Equity | Egypt | Telecommunications<br />
12 May 2010<br />
Initiation of coverage<br />
Buy<br />
Target price<br />
E£20.05<br />
Price<br />
E£17.50<br />
Short term (0-60 days)<br />
n/a<br />
Sector view<br />
No Weighting<br />
Price performance<br />
(1M) (3M) (12M)<br />
Price (E£) 17.36 19.58 15.97<br />
Absolute (%) 0.8 -10.6 9.6<br />
Rel market (%) 4.8 -11.1 -9.7<br />
Rel sector (%) 2.3 0.9 n/a<br />
May 07 May 08 May 09<br />
32<br />
28<br />
24<br />
20<br />
16<br />
12<br />
8<br />
ETEL.CA<br />
Market capitalisation<br />
E£29.87bn (€4.21bn)<br />
Average (12M) daily turnover<br />
E£31.68m (€4.49m)<br />
Sector: EGX30 Telecoms<br />
RIC: ETEL.CA, ETEL EY<br />
Priced E£17.50 at close 6 May 2010.<br />
Source: Bloomberg<br />
EGX30<br />
Telecom Egypt<br />
Fully rounded telecom player<br />
We initiate coverage of Telecom Egypt with a Buy rating and a 12-month target<br />
price of E£20.05 per share. To arrive at our target price, we use an equal<br />
weighting of valuations based on multiples, sum of the parts and DCF.<br />
Key forecasts<br />
FY08A FY09A FY10F FY11F FY12F<br />
Revenue (E£m) 10,117 9,960 10,028 9,722 9,937<br />
EBITDA (E£m) 5,048 4,579 4,469 4,404 4,545<br />
Reported net profit (E£m) 2,448 3,051 3,093 3,079 3,191<br />
Normalised net profit (E£m) 2,448 3,051 3,093 3,079 3,191<br />
Normalised EPS (E£) 1.43 1.79 1.81 1.8 1.87<br />
Dividend per share (E£) 1.3 0.75 1.45 1.53 1.68<br />
Dividend yield (%) 7.43 4.29 8.28 8.76 9.61<br />
Normalised PE (x) 12.2 9.79 9.66 9.7 9.36<br />
EV/EBITDA (x) 6.01 6.22 6.15 6.01 5.64<br />
EV/invested capital (x) 1.15 1.1 1.07 1.05 1.04<br />
Accounting standard: IFRS<br />
Source: Company data, <strong>Rasmala</strong> Research forecasts<br />
year to Dec, fully diluted<br />
We expect Telecom Egypt to maintain its monopoly<br />
Since its inception, Telecom Egypt (TE) has held a fixed-line monopoly in the Egyptian<br />
telecommunications market. Technically, the fixed-line business and international gateway<br />
service opened to competition in 1Q08 and at the end of 2005, respectively; however, no<br />
other players have entered the market. We expect Telecom Egypt to maintain its monopoly<br />
in fixed line.<br />
TE North to be launched in 2H10<br />
Telecom Egypt’s submarine cable project, TE North, which we believe will become the<br />
growth driver for Telecom Egypt’s wholesale revenue, is due to be completed in 2H10,<br />
according to TE management. The project aims to take advantage of the booming Internet<br />
traffic between Asia and Europe, utilising Egypt’s geographical position.<br />
Vodafone’s stake to mitigate fixed-to-mobile substitution<br />
Due to the recent trend of fixed-to-mobile substitution and new regulations from the National<br />
Telecom Regulatory Authority (NTRA), Telecom Egypt’s 44.95% stake in Vodafone is<br />
becoming increasingly important to the company’s bottom line (representing 46% of net<br />
income in FY09). Vodafone currently has 23m subscribers, and we still see room for growth<br />
for the mobile operator with the second-largest market share.<br />
Analyst<br />
Shrouk Diab<br />
+20 1 9991 6882<br />
shrouk.diab@rasmala.com<br />
Dubai International Financial Centre,<br />
The Gate Village, Building 10, Level 1,<br />
P.O. Box 31145, Dubai, United Arab<br />
Emirates<br />
www.rasmala.com<br />
Important disclosures can be found in the Disclosures Appendix.<br />
Distributed outside MENA by The Royal <strong>Bank</strong> of Scotland N.V. and its affiliates under a strategic<br />
alliance with <strong>Rasmala</strong> <strong>Investment</strong> <strong>Bank</strong> Ltd.
<strong>Investment</strong> view<br />
There is a prevalent fixed-to-mobile substitution trend in the Egyptian telecom market, but<br />
the negative impact on TE has been partially mitigated by its 44.95% stake in Vodafone<br />
Egypt, which has remained the primary driver behind TE’s bottom line growth.<br />
Underlying growth drivers<br />
Additional shares offering<br />
In March, Communications Minister Tarek Kamel announced that the Egyptian government may<br />
float a sizeable stake of Telecom Egypt on the Egyptian stock exchange within the next two years,<br />
but he did not specify how much.<br />
What if Vodafone were to outpace <strong>Mobinil</strong>?<br />
Vodafone has been characterised as a more rational player in terms of pricing than the other two<br />
mobile operators(<strong>Mobinil</strong> and Etisalat). Therefore, if Vodafone surpasses <strong>Mobinil</strong> in terms of<br />
market share – something we do not consider a strong possibility – it would significantly benefit<br />
Telecom Egypt’s bottom line, given TE’s 44.95% stake. On the other hand, we believe Vodafone<br />
could derive better margins than its competitors since it has positioned itself in the market as the<br />
leading quality play, which should enable Vodafone Egypt to charge higher premiums.<br />
Higher dividends possible<br />
Management cut the end-2009 dividend to E£0.75 per share from E£1.30 for end-2008, in the<br />
hope of retaining funds for potential investment opportunities. However, we see little chance of a<br />
fourth mobile licence being offered in Egypt in the medium term and, so, see little chance of such<br />
an opportunity arising. Therefore, we believe TE will be able to raise its dividend again, which<br />
should be perceived positively by investors.<br />
Valuation and target price<br />
We initiate coverage of Telecom Egypt (TE) with a Buy rating and a 12-month target price of<br />
E£20.05 per share. To arrive at our target price, we use an equal weighting of valuations based<br />
on multiples, sum of the parts and discounted cash flow.<br />
Sum of the parts and discounted cash flow<br />
TE’s sum of the parts/DCF valuation yields a 12-month fair value of E£17.82, which is 2% higher<br />
than the current price of E£17.49.<br />
Table 1 : DCF valuation<br />
Operation Assumptions<br />
Telecom Egypt DCF (risk free rate: 9.0%, risk premium: 5%, cost of debt: 13%,<br />
beta : 1x, WACC:14.0%, LTG: 1.5%)<br />
Vodafone Egypt DCF (risk free rate: 9.0%, risk premium: 7%, cost of debt: 12%,<br />
beta : 1x WACC:12.2%, LTG: 3.5%)<br />
Source: <strong>Rasmala</strong><br />
Table 2 : SOTP valuation<br />
Operation (all figures in E£m,<br />
Enterprise value Stake Proportionate EV<br />
unless stated otherwise)<br />
Telecom Egypt 25,349 100% 25,349<br />
Vodafone Egypt 11,266 44.95% 5,064<br />
Total enterprise value 30,413<br />
Minus: net debt 0<br />
Total equity value 30,413<br />
Total outstanding shares (m) 1,707<br />
Total SOTP (EGP per share) 17.82<br />
Source: <strong>Rasmala</strong><br />
Telecom Egypt | <strong>Investment</strong> View | 12 May 2010 2<br />
46
Peer valuation<br />
We also use peer group average PE multiples of 13.1x for FY10F and 11.5x for FY11F, based on<br />
Bloomberg estimates, to arrive at a valuation of E£22.28 per share.<br />
Table 3 : Estimated 2010 and 2011 PEs for telecom peers<br />
Peers 2010F 2011F<br />
Telefonos de Mexico 8.8 8.5<br />
Reliance Industries 19.6 14.1<br />
Telekom Malaysia 23.1 21.3<br />
Globe Telecom Inc 9.8 9.4<br />
Advanced Info Service 12.8 12.3<br />
Indosat TBK 17.7 14.9<br />
MTN Group 10.48 8.8<br />
Excelcomindo Pratama 15.4 12.4<br />
Turkcell Iletisim Hizmet 10.5 9.7<br />
Vodacom Group 10.53 9.2<br />
Bharti Airtel 12.3 13.2<br />
America Movil SAB de C 13 11.7<br />
China Telecom Corp 17.7 14.6<br />
Celtel Zambia 10.6 9.7<br />
Magyar 9.2 9.4<br />
Turk Telekomunikasyon 9.3 8.5<br />
Mobile Telesystems 12.6 7.8<br />
Average 13.1 11.5<br />
Source: Bloomberg<br />
How we differ from consensus<br />
We are 2% lower than Bloomberg consensus for both our 2010F and 2011F revenue estimates.<br />
Accordingly, we are 5% and 7% lower than Bloomberg estimates in terms of 2010F and 2011F<br />
EPS, respectively, partly due to our lower revenue forecast and partly to the fact that we anticipate<br />
increased competition, particularly in the mobile segment.<br />
Risks to our target price<br />
Downside risks include:<br />
! A price war in the Egyptian mobile market that exceeds expectations. The fixed-to-mobile<br />
substitution trend has been more evident recently; pressuring TE’s fixed-line revenues,<br />
particularly retail segment revenues, although this is partially mitigated by TE’s stake in<br />
Vodafone.<br />
! Increased competition in mobile broadband prices, which would undermine TE’s fixed<br />
broadband potential.<br />
! The possibility of <strong>Mobinil</strong> acquiring its own international gateway, although we believe this is<br />
unlikely in the short term because of <strong>Mobinil</strong>’s obligation to pay 3G instalments due in 2010.<br />
! TE losing its ongoing interconnection lawsuit against mobile operators, which would be a risk<br />
as we currently apply the same price assumptions as TE to account for interconnection rates.<br />
! The possibility of TE pursuing Egypt’s fourth mobile licence if is it offered by the NTRA, as we<br />
believe doing so could do damage between Vodafone Egypt and Telecom Egypt.<br />
Telecom Egypt | <strong>Investment</strong> View | 12 May 2010 3<br />
47
Company dynamics<br />
Telecom Egypt’s monopoly of the fixed line market, seems long term. In our opinion, we<br />
believe Telecom Egypt’s growth potential will come from the nascent fixed broadband<br />
market.<br />
Operational strategy and forecasts<br />
Monopoly in the fixed-line business seems long term<br />
Since its inception, Telecom Egypt has held a fixed-line monopoly in the Egyptian telecoms<br />
market. Technically, the fixed-line business and international gateway service have been open to<br />
competition since 1Q08 and the end of 2005, respectively; however, no other players have<br />
entered the market, allowing Telecom Egypt to maintain its monopoly. The Egyptian NTRA<br />
planned to offer a second fixed-line licence in 2008, but the subsequent global economic crisis<br />
and a lack of interest delayed the move. We believe the benefits to whoever was awarded the<br />
second fixed-line licence would be:<br />
! ownership of an international gateway;<br />
! the ability to offer bundled services;<br />
! an ability to offer triple- or even quad-play services; and<br />
However, after the second fixed-line licence offer was postponed, the NTRA offered several other<br />
licences, which included the right to own an international gateway (currently only Etisalat and<br />
Telecom Egypt own one) and two new triple-play services licences for new housing compounds.<br />
Given the NTRA’s recent rollout of new telecom licences, we believe the possibility of offering a<br />
‘traditional’ second fixed-line licence has diminished significantly. Accordingly, we believe<br />
Telecom Egypt will maintain its monopoly for the foreseeable future.<br />
Chart 1 : Fixed subscribers and penetration<br />
14.0<br />
12.0<br />
10.0<br />
8.0<br />
m<br />
18%<br />
16%<br />
14%<br />
12%<br />
10%<br />
6.0<br />
4.0<br />
2.0<br />
0.0<br />
`<br />
2008 2009 2010E 2011F 2012F<br />
TE fixed subscribers fixed penetration<br />
8%<br />
6%<br />
4%<br />
2%<br />
0%<br />
Source: Company filings, <strong>Rasmala</strong><br />
Telecom Egypt exploits the fixed-to-mobile substitution trend<br />
Telecom Egypt tapped into the lucrative mobile market when it acquired a 45% stake in Vodafone<br />
Egypt, capitalising on the prevalent fixed-to-mobile substitution trend in Egypt and in an effort to<br />
sustain operational cash flow streams. The substitution trend originated in December 2009, when<br />
the NTRA introduced a new regulation to increase competition in the mobile market, resulting in<br />
tariff cuts and consequently to higher fixed-to-mobile substitution.<br />
Telecom Egypt has two main revenue streams: retail and wholesale. Given we expect prolonged<br />
competition in the mobile market through the increased rollout of aggressive promotions, we<br />
expect to see more pressure on the retail revenues, which include voice, access and connection<br />
fees. On the other hand, the same issues mean TE’s wholesale should benefit, directly and<br />
indirectly, from the increased traffic in the mobile market. Directly, the company leases its<br />
Telecom Egypt | <strong>Investment</strong> View | 12 May 2010 4<br />
48
infrastructure to mobile operators and, so, increased mobile traffic would mean increased<br />
capacity-leasing activity. Indirectly, TE would be able to make up the fixed-line revenue it loses to<br />
mobile players via its 45% stake in Vodafone Egypt.<br />
Vodafone Egypt, with a 23m subscriber base at the end of December 2009, is ranked second in<br />
Egypt in terms of market share, and has continuously surpassed local rival <strong>Mobinil</strong> in terms of<br />
profitability.<br />
Chart 2 : Fixed-to-mobile substitution trend (x)<br />
Chart 3 : Vodafone mobile subscribers and market share<br />
7<br />
35.0<br />
m<br />
43%<br />
6<br />
5.7<br />
30.0<br />
43%<br />
5<br />
25.0<br />
42%<br />
4<br />
3.5<br />
20.0<br />
42%<br />
42%<br />
3<br />
2.7<br />
15.0<br />
`<br />
42%<br />
2<br />
1<br />
0.8<br />
1.3<br />
1.7<br />
10.0<br />
5.0<br />
42%<br />
41%<br />
0<br />
2004 2005 2006 2007 2008 2009<br />
0.0<br />
2008A 2009A 2010E 2011F 2012F<br />
41%<br />
Fixed-to-mobile substitution trend<br />
Vodafone mobile subscribers<br />
Vodafone market share<br />
Source: Company filings, <strong>Rasmala</strong><br />
Source: Company filings, <strong>Rasmala</strong><br />
Telecom Egypt capitalises on nascent broadband market<br />
Telecom Egypt's Internet and data services include the provision of Internet broadband access<br />
through its wholly owned subsidiary TE Data, data-transmission services and leased lines. TE<br />
Data is currently the market leader in Egypt, with market share of about 61% at year-end 2009.<br />
Total ADSL subscribers had reached 625,200 by year-end 2009, representing 47% yoy growth.<br />
Internet use in Egypt has grown at an exponential rate yoy since 2003, and total revenues from<br />
Internet and data services reached E£622.3m by end-2009, constituting 7% of total consolidated<br />
revenues. Total revenues from Internet and data services produced a CAGR of 58.6% for 2003-<br />
09. A high growth rate in the Internet and data market and TE’s increased focus on offering valueadded<br />
services (VAS), especially after issuance of two triple-play licences, should play a<br />
significant role in adding value to TE, in our view. We expect Internet and data revenue to<br />
continue to grow as a percentage of total consolidated revenues, as it constituted only 3.4% of<br />
total revenues in FY07, but almost doubled its weight in less than two years to reach 7% in FY09.<br />
We believe revenues from TE Data could reach about 11% of total revenues by 2012.<br />
Chart 4 : Internet and data revenue<br />
Chart 5 : ADSL subscribers and market share<br />
1,200<br />
EGP m<br />
120%<br />
1,600<br />
000<br />
80%<br />
1,000<br />
100%<br />
1,400<br />
70%<br />
1,200<br />
60%<br />
800<br />
80%<br />
1,000<br />
50%<br />
600<br />
60%<br />
800<br />
40%<br />
400<br />
`<br />
40%<br />
600<br />
400<br />
`<br />
30%<br />
20%<br />
200<br />
20%<br />
200<br />
10%<br />
0<br />
2004 2005 2006 2007 2008 2009 2010E 2011F 2012F<br />
0%<br />
0<br />
2004 2005 2006 2007 2008 2009 2010E 2011F 2012F<br />
0%<br />
Internet and Data revenue<br />
Revenue growth<br />
ADSL subscribers<br />
Market share<br />
Source: Company filings, <strong>Rasmala</strong><br />
Source: Company filings, <strong>Rasmala</strong><br />
Telecom Egypt | <strong>Investment</strong> View | 12 May 2010 5<br />
49
Telecom Egypt launches its first FTTH<br />
In September 2009, Egypt’s Minister of Communications & IT announced the offering of two new<br />
triple-play services licences, the first of their kind in Egypt. Minister Tarek Kamel stated that he<br />
expects this to generate US$1bn of investment over the next five years.<br />
The licences will only cover small gated communities encompassing 50-10,000 units where the<br />
two new licensees – in addition to Telecom Egypt – will be able to compete. For communities<br />
exceeding 10,000 units, TE will be the only telecom operator and will maintain its monopoly. The<br />
new licences will enable telecom providers to offer bundled services that include data and<br />
Internet. The licences offered in Egypt do not include voice services, meaning Telecom Egypt’s<br />
monopoly will not be affected. Importantly, there is no exclusivity for the two new licences, so TE<br />
can compete head to head with them – it is to be a level playing field. There is to be 8% revenue<br />
sharing with the government with no "significant" up-front fees.<br />
In October 2009, soon after the announcement of the offer of triple-play licences, Telecom Egypt<br />
launched its first fibre-to-the-home (FTTH) commercial service. Installation of the FTTH network<br />
makes TE the first telecom operator to provide triple-play services in Egypt. Deployment of this<br />
technology allows the company to serve areas with demand for high-speed broadband access<br />
that could reach 70 megabits/second. TE already faces competition within the broadband sector,<br />
as other Internet service providers (ISPs) can and do offer services over its network.<br />
Due to the significant cost of the installation of this network, the typical strategy is to target the<br />
needs of high-end subscribers and business customers. Given the rapid dynamics of<br />
technological innovation and development within the communications industry, multimedia<br />
convergence, mobile broadband and Internet use are set to be the next battleground for<br />
operators. Although voice communication is likely to remain the major revenue generator for<br />
mobile operations in the medium term, data and value-added services will play an important role<br />
in differentiating operators and increasing subscriber loyalty.<br />
One of the main barriers to fibre-technology deployment when it was first introduced was the very<br />
high initial cost of instalment; the view was that fibre connectivity was economically unfeasible.<br />
However, given a growing need for broadband applications, new infrastructure is required to meet<br />
bandwidth needs, and with the cost of deployment dropping over the years, FTTH has become<br />
more viable.<br />
On the sidelines of an investor conference in New York in late 2009, Telecom Egypt CEO Tarek<br />
Tantawy said, regarding the new triple-play licences, that TE would continue to provide fixed-line<br />
services for any new licences tendered, while future private operators will only be allowed to<br />
supply data and video. He said: “Maybe ‘triple play’ is not the accurate word, although that was<br />
what was announced. What's on offer does not include fixed voice at all. The two new licence<br />
operators will not be allowed to provide voice services; they will have to give us access to their<br />
network to provide voice services."<br />
While the FTTH service is being launched in Qatamiya, TE is working on fibre-to-the-exchange<br />
(FTTx) in many more suburbs of Cairo and in some parts of Alexandria. The company is also<br />
seeking exclusive contracts with real estate developers to provide ‘fibre-to-the-home’ services in<br />
the Cairo suburbs. It aims to help spread the cable to all suburban consumers in an effort to take<br />
control of this new market, which is a potential long-term source of income. In addition, TE should<br />
boost its own revenues as other operators will have to lease its infrastructure and it will have sole<br />
control over lease pricing.<br />
Submarine cable expected to launch soon<br />
Telecom Egypt’s submarine cable project, TE North, which we believe will become the driver for<br />
its wholesale revenue, is due to be completed in 2H10, according to management. The project<br />
aims to take advantage of the booming Internet traffic between Asia and Europe, utilising Egypt’s<br />
geographical position.<br />
According to TE’s management team, total revenues of TE North have reached a cumulative of<br />
US$219m as of 2009 of which 42.5% of its revenue recognition should begin to be recognised in<br />
2H10, while the remaining 57.5% would be equally distributed over the next 20 years.<br />
Telecom Egypt | <strong>Investment</strong> View | 12 May 2010 6<br />
50
Chart 6 : TE revenue and growth<br />
Chart 7 : TE EBITDA and EBITDA margin<br />
10,200<br />
EGP m<br />
3%<br />
5,200<br />
EGP m<br />
51%<br />
10,100<br />
2%<br />
5,000<br />
50%<br />
49%<br />
10,000<br />
9,900<br />
1%<br />
0%<br />
4,800<br />
48%<br />
47%<br />
9,800<br />
9,700<br />
`<br />
-1%<br />
-2%<br />
4,600<br />
4,400<br />
`<br />
46%<br />
45%<br />
44%<br />
9,600<br />
-3%<br />
4,200<br />
43%<br />
42%<br />
9,500<br />
2008 2009 2010E 2011F 2012F<br />
-4%<br />
4,000<br />
2008 2009 2010E 2011F 2012F<br />
41%<br />
TE Revenue Revenue growth<br />
TE EBITDA TE EBITDA margin<br />
Source: Company filings, <strong>Rasmala</strong><br />
Source: Company filings, <strong>Rasmala</strong><br />
Defensive cash flow stream<br />
Since Telecom Egypt is the only operator with exposure to the fixed-line, mobile and Internet<br />
markets in Egypt, it has a strong and diversified revenue stream, protecting it from aggressive<br />
mobile operators and helping it to maintain its margins. Technology is bringing these different<br />
segments closer. As in most developed markets, converged services is the new focus of telecom<br />
operators. We believe Telecom Egypt is the best positioned operator to capture most of the<br />
benefits of this new trend, due to its unique presence in each of these segments, and we believe it<br />
deserves recognition as a full telecom provider. The diversity of its revenue streams and the<br />
continued growth of the mobile market, in addition to the huge potential the broadband market<br />
offers, support what we see as TE’s defensive nature and sustainable cash flow from operations.<br />
International gateway<br />
Telecom Egypt is the only operator in the country with an international gateway, which is currently<br />
utilised by both Vodafone Egypt and <strong>Mobinil</strong>, adding to TE’s wholesale revenue. Etisalat is the<br />
only mobile operator that now operates its own international gateway for the use of its subscribers<br />
(which it introduced when it entered the Egyptian market).<br />
Recently, Telecom Egypt and Vodafone Egypt (VFE) announced they had signed an agreement<br />
for the provision of wholesale telecommunications services. We believe the deal represents a total<br />
value for TE of about E£4bn over the next three years. It will allow VFE to utilise TE’s international<br />
gateway services to transit all VFE customers’ incoming and outgoing international traffic, while<br />
relying on TE’s extensive domestic network for all VFE infrastructure-leasing needs. On the other<br />
hand, VFE’s competitor, <strong>Mobinil</strong>, stated that it could acquire an international gateway of its own if<br />
Telecom Egypt failed to provide it with properly competitive rates. <strong>Mobinil</strong> had previously refused<br />
to acquire an international gateway offered by the NTRA, because the company’s management<br />
viewed the licence as very expensive (E£100 per existing subscriber plus a revenue share of 6%).<br />
It decided to continue to channel its international traffic through Telecom Egypt's international<br />
gateway.<br />
Interconnection dispute<br />
During mid-2008, Telecom Egypt filed a complaint with the Dispute Resolution Board of the<br />
NTRA, aimed at altering the rates for interconnection fees or termination rates with mobile<br />
operators. The NTRA subsequently issued a ruling on the dispute in September 2008, changing<br />
the interconnect prices between the fixed and mobile networks. In 3Q08, <strong>Mobinil</strong> objected to the<br />
decision and filed a lawsuit against the NTRA before the Administrative Court, claiming that there<br />
was 'no legal or contractual basis' for the decision.<br />
Telecom Egypt continues to record interconnection revenues and expenses between the<br />
company and the mobile operators according to the NTRA’s administrative decision. The dispute<br />
encompasses the period from 3 August 2008 until the end of 2009. TE expects to receive<br />
EGP426.6m in the settlement, including E£298.4m related to the current year’s operations,<br />
starting from January 2009 to end of December 2009. The submissions of the company and the<br />
mobile operators are still being studied by the court.<br />
Telecom Egypt | <strong>Investment</strong> View | 12 May 2010 7<br />
51
Interest in acquiring a mobile licence in Egypt<br />
Management has shown a keen interest in entering directly into the lucrative mobile market by<br />
acquiring the fourth mobile licence in Egypt if it is offered by the NTRA. That said, we do not<br />
believe that acquiring the licence would benefit Telecom Egypt, as we believe it could damage the<br />
relationship between Telecom Egypt and Vodafone Egypt and could spark another price war in a<br />
market where competition is already very aggressive.<br />
Potential for higher dividend payout<br />
Management cut the end-2009 dividend to E£0.75 per share from E£1.30 for end-2008, in the<br />
hope of retaining funds for potential investment opportunities. However, we see little chance of a<br />
fourth mobile licence being offered in Egypt in the medium term and, so, see little chance of such<br />
an opportunity arising. Therefore, we believe TE will be able to raise its dividend again, which<br />
should be perceived positively by investors.<br />
Telecom Egypt | <strong>Investment</strong> View | 12 May 2010 8<br />
52
Appendix<br />
Company overview<br />
Telecom Egypt provides retail telecommunication services including access, local, long-distance<br />
and international voice, Internet and data, and other services. The company also provides<br />
wholesale services, including broadband capacity leasing to ISPs, and national and international<br />
interconnection services. The fixed-line telephony market in Egypt remains 100% dominated by<br />
the 80% government-owned Telecom Egypt. Telecom Egypt's Internet and data services include<br />
the provision of Internet broadband access through its wholly owned subsidiary, TE Data.<br />
Telecom Egypt also participates in the growing mobile segment in Egypt by providing mobile<br />
interconnectivity through its 44.7% holding in Vodafone Egypt, one of the three Egyptian mobile<br />
operators and ranked second in terms of market share.<br />
In December 2005, the IPO of Telecom Egypt took place at an unprecedented transaction value<br />
at the time – E£4,531m (US$824m). Telecom Egypt listed 20% of its shares on the market.<br />
Telecom Egypt is listed on both the Egyptian Stock Exchange and the London Stock Exchange.<br />
Telecom Egypt | <strong>Investment</strong> View | 12 May 2010 9<br />
53
Income statement<br />
E£m FY08A FY09A FY10F FY11F FY12F<br />
Revenue 10117 9960 10028 9722 9937<br />
Cost of sales -2868 -3269 -3409 -3208 -3180<br />
Operating costs -2201 -2112 -2149 -2110 -2212<br />
EBITDA 5048 4579 4469 4404 4545<br />
DDA & Impairment (ex gw) -3144 -2475 -2233 -2116 -2113<br />
EBITA 1904 2104 2237 2288 2432<br />
Goodwill (amort/impaired) 0.00 0.00 0.00 0.00 0.00<br />
EBIT 1904 2104 2237 2288 2432<br />
Net interest -117.5 -5.31 -44.0 -19.1 4.15<br />
Associates (pre-tax) 0.00 0.00 0.00 0.00 0.00<br />
Other pre-tax items 1180 1411 1366 1273 1235<br />
Reported PTP 2966 3510 3558 3542 3672<br />
Taxation -512.3 -453.4 -459.6 -457.5 -474.2<br />
Minority interests -5.71 -5.35 -5.71 -5.85 -6.21<br />
Other post-tax items 0.00 0.00 0.00 0.00 0.00<br />
Reported net profit 2448 3051 3093 3079 3191<br />
Tot normalised items 0.00 0.00 0.00 0.00 0.00<br />
Normalised EBITDA 5048 4579 4469 4404 4545<br />
Normalised PTP 2966 3510 3558 3542 3672<br />
Normalised net profit 2448 3051 3093 3079 3191<br />
Source: Company data, <strong>Rasmala</strong> Research forecasts<br />
year to Dec<br />
Balance sheet<br />
E£m FY08A FY09A FY10F FY11F FY12F<br />
Cash & market secs (1) 2735 2453 3451 3981 4358<br />
Other current assets 5326 4767 4794 4689 4545<br />
Tangible fixed assets 18213 17368 16368 15418 14618<br />
Intang assets (incl gw) 155.0 0.00 -10.0 -19.0 -26.0<br />
Oth non-curr assets 7009 7873 8680 9466 10227<br />
Total assets 33438 32461 33284 33535 33723<br />
Short term debt (2) 0.32 6.78 0.00 0.00 0.00<br />
Trade & oth current liab 5485 4272 4404 4494 4726<br />
Long term debt (3) 1663 857.9 850.8 459.1 0.00<br />
Oth non-current liab 486.3 56.6 56.6 56.6 56.6<br />
Total liabilities 7634 5193 5312 5010 4783<br />
Total equity (incl min) 25804 27268 27973 28525 28941<br />
Total liab & sh equity 33438 32461 33284 33535 33723<br />
Net debt 475.6 -1409 -2403 -3415 -4226<br />
Source: Company data, <strong>Rasmala</strong> Research forecasts<br />
year ended Dec<br />
Cash flow statement<br />
E£m FY08A FY09A FY10F FY11F FY12F<br />
EBITDA 5048 4579 4469 4404 4545<br />
Change in working capital -1089 228.6 60.1 282.4 339.2<br />
Net interest (pd) / rec -341.6 -208.7 -44.0 -19.1 4.15<br />
Taxes paid -449.3 -1250 -459.6 -457.5 -474.2<br />
Other oper cash items 1180 923.4 1366 1273 1235<br />
Cash flow from ops (1) 4348 4272 5391 5483 5650<br />
Capex (2) -918.9 -980.8 -1223 -1157 -1306<br />
Disposals/(acquisitions) 0.00 0.00 0.00 0.00 0.00<br />
Other investing cash flow 1555 1046 -807.6 -785.7 -761.4<br />
Cash flow from invest (3) 636.0 65.2 -2030 -1943 -2067<br />
Incr / (decr) in equity 0.00 0.00 0.00 0.00 0.00<br />
Incr / (decr) in debt 0.00 0.00 0.00 0.00 0.00<br />
Ordinary dividend paid -1706 -2367 -2474 -2617 -2872<br />
Preferred dividends (4) 0.00 0.00 0.00 0.00 0.00<br />
Other financing cash flow -1869 -2049 84.6 -397.3 -344.1<br />
Cash flow from fin (5) -3576 -4415 -2390 -3014 -3216<br />
Forex & disc ops (6) 1.23 -290.0 0.00 0.00 0.00<br />
Inc/(decr) cash (1+3+5+6) 1410 -367.8 971.3 526.1 366.1<br />
Equity FCF (1+2+4) 3429 3292 4169 4326 4344<br />
Source: Company data, <strong>Rasmala</strong> Research forecasts<br />
year to Dec<br />
Telecom Egypt | Key Financial Data | 12 May 2010<br />
54
Equity | Kuwait | Mobile Telcos<br />
12 May 2010<br />
Initiation of coverage<br />
Buy<br />
Target price<br />
KD2.15<br />
Price<br />
KD1.70<br />
Short term (0-60 days)<br />
n/a<br />
Market view<br />
No Weighting<br />
Price performance<br />
(1M) (3M) (12M)<br />
Price (KD) 1.60 1.54 1.56<br />
Absolute (%) 6.3 10.4 9.0<br />
Rel market (%) 13.5 11.8 18.1<br />
Rel sector (%) 14.5 11.4 7.5<br />
May 07 Apr 08 Apr 09<br />
4.0<br />
3.5<br />
3.0<br />
2.5<br />
2.0<br />
1.5<br />
1.0<br />
NMTC.KW<br />
Market capitalisation<br />
KD856.86m (€2.33bn)<br />
Average (12M) daily turnover<br />
KD0.31m (US$1.12m)<br />
Kuwait SE Index<br />
Sector: Kuwait Service Index<br />
RIC: NMTC.KW, NMTC KK<br />
Priced KD1.70 at close 6 May 2010.<br />
Source: Bloomberg<br />
Wataniya<br />
Attractive geographical spread<br />
Wataniya operates in Kuwait, Saudi Arabia, Palestine, Tunisia, Algeria and the<br />
Maldives. We initiate with a Buy rating and a 12-month target price of KD2.15. To<br />
arrive at our target price, we used an equal weighting of peer multiples, namely<br />
PE; a sum of parts; and DCF valuation to derive our 12 month target price.<br />
Key forecasts<br />
FY08A FY09A FY10F FY11F FY12F<br />
Revenue (KDm) 481.8 480.3 524.9 558.1 591.2<br />
EBITDA (KDm) 175.3 227.7 190.3 199.6 213.9<br />
Reported net profit (KDm) 82.4 108.3 85.1 82.9 92.3<br />
Normalised net profit (KDm) 82.4 108.3 85.1 82.9 92.3<br />
Normalised EPS (KD) 0.16 0.21 0.17 0.16 0.18<br />
Dividend per share (KD) 0.05 0.05 0.04 0.04 0.04<br />
Dividend yield (%) 2.92 2.92 2.38 2.32 2.58<br />
Normalised PE (x) 10.4 7.91 10.1 10.3 9.29<br />
EV/EBITDA (x) 5.13 3.81 4.01 3.44 2.81<br />
EV/invested capital (x) 1.96 1.75 1.76 1.66 1.5<br />
Accounting standard: IFRS<br />
Source: Company data, <strong>Rasmala</strong> Research forecasts<br />
year to Dec, fully diluted<br />
Attractive portfolio of assets<br />
We believe Wataniya‘s country portfolio, provides exposure to countries with very attractive<br />
demographics, which include high population growth rates, driven by a high youth segment,<br />
and high ARPUs. Despite our general opinion that a local play is usually better managed<br />
than a widely diversified range of operations, we believe Wataniya is one of the few<br />
operators that did not grow too fast, while maintaining control over its operations and deriving<br />
the benefits of economies of scale.<br />
Association with Qatar Telecom beneficial<br />
We believe Wataniya should benefit from its close relationship with Qatar Telecom, which<br />
owns a 52.5% stake in Wataniya, in that it should be able to capitalise on Qatar’s Telecom<br />
equipment purchasing power and derive roaming synergies with Qatar Telecom’s pool of<br />
countries.<br />
Low gearing<br />
Gearing remains low with net debt/EBITDA standing at 0.05x for 2009. With the absence of<br />
current acquisition opportunities, we do not expect debt to increase materially, as Wataniya<br />
has enjoyed a growing positive free cash flow position since 2005.<br />
Analyst<br />
Shrouk Diab<br />
+20 1 9991 6882<br />
shrouk.diab@rasmala.com<br />
Dubai International Financial Centre,<br />
The Gate Village, Building 10, Level 1,<br />
P.O. Box 31145, Dubai, United Arab<br />
Emirates<br />
www.rasmala.com<br />
Important disclosures can be found in the Disclosures Appendix.<br />
Distributed outside MENA by The Royal <strong>Bank</strong> of Scotland N.V. and its affiliates under a strategic<br />
alliance with <strong>Rasmala</strong> <strong>Investment</strong> <strong>Bank</strong> Ltd.
<strong>Investment</strong> view<br />
We initiate coverage of Wataniya with a Buy rating with a 12-month target price of KD2.15<br />
per share. We use a blended valuation methodology of sum-of-the-parts DCF valuation and<br />
peer multiples.<br />
With the upcoming IPOs of Palestine and Tunisia, Wataniya may have an increased flexibility in<br />
sources of funding. Furthermore, the upcoming IPOs should decrease the likelihood of potential<br />
problems in the repatriation of funds, as witnessed in the recent standoff between Orascom<br />
Telecom and the Algerian government.<br />
Given the increased news flow in the market recently of the possibility of MTN of South Africa<br />
buying out a number of Orascom Telecom’s operations, which include Tunisiana (the 50-50% joint<br />
venture between Wataniya and Egypt’s Orascom Telecom Holding) (Reuters, 27 April 2010), we<br />
believe it would be beneficial for Wataniya to obtain Orascom Telecom’s 50% share in Tunisiana<br />
(assuming a reasonable price), since it would eliminate any possible management struggles<br />
between Wataniya and the management of the new operator.<br />
Valuation and price target<br />
We initiate coverage of Wataniya with a Buy rating with a 12-month target price of KD2.15 per<br />
share, which is 26% higher than the current price of Wataniya. To arrive at our target price, we<br />
used an equal weighting of peer multiples, namely PE; a sum-of-the-parts DCF valuation to derive<br />
our 12-month target price.<br />
Table 1 : Estimated PE 2010 and 2011 for telecom peers<br />
Peers PE 2010F PE 2011F<br />
Telefonos de Mexico 8.8 8.5<br />
Reliance Industries 19.6 14.1<br />
Telekom Malaysia 23.1 21.3<br />
Globe Telecom Inc 9.8 9.4<br />
Advanced Info Service 12.8 12.3<br />
14.9 Indosat TBK 17.7 14.9<br />
MTN Group 10.48 8.8<br />
Excelcomindo Pratama 15.4 12.4<br />
Turkcell Iletisim Hizmet 10.5 9.7<br />
13.2 Vodacom Group 10.53 9.2<br />
Bharti Airtel 12.3 13.2<br />
America Movil SAB de C 13.0 11.7<br />
China Telecom Corp 17.7 14.6<br />
Celtel Zambia 10.6 9.7<br />
7.8 Magyar 9.2 9.4<br />
Turk Telekomunikasyon 9.3 8.5<br />
Mobile Telesystems 12.6 7.8<br />
Average 13.1 11.5<br />
Source: Bloomberg<br />
Our sum of parts valuation yielded a fair value of KD2.24 per share, which is 32% higher than the<br />
current trading price of KD1.70 per share.<br />
Table 2 : DCF assumptions<br />
Operation WACC Long term growth rate<br />
Kuwait 10.2% 2.5%<br />
Tunisia 10.2% 3.0%<br />
Algeria 10.7% 3.5%<br />
Saudi Arabia 10.2% 2.5%<br />
Maldives 10.0% 3.0%<br />
Palestine 10.0% 4.0%<br />
Source: <strong>Rasmala</strong><br />
Wataniya | <strong>Investment</strong> View | 12 May 2010 2<br />
56
Table 3 : SOTP valuation<br />
Operation (all figures in KD m, Enterprise value Stake Proportionate EV<br />
unless stated otherwise)<br />
Kuwait 597 100% 597<br />
Tunisia 632 50% 316<br />
Algeria 241 71% 171<br />
Saudi Arabia 66 56% 37<br />
Maldives 3 100% 3<br />
Palestine 27 57% 15<br />
Total enterprise value 1,566 1,140<br />
Minus: Net debt 10<br />
Total equity value 1,129<br />
Total outstanding shares (m) 504<br />
Total SOTP (KD per share) 2.24<br />
Source: <strong>Rasmala</strong> forecasts<br />
Peer valuation<br />
Using our peer group, which is an average of PE multiples for FY10F of 13.1x and FY11F of<br />
11.5x, we arrive at a target price of KD2.06 per share, which is 21% higher than the current<br />
trading share price of KD1.7 per share.<br />
How we differ from consensus<br />
We are in line with Bloomberg consensus estimates for revenues for 2010 and 2011. We are also<br />
in line for EBITDA estimates for 2010, but slightly lower in terms of EBITDA estimates for 2011.<br />
Accordingly our EPS estimates for 2010 are in line, but slightly lower for 2011, due to a lower<br />
EBITDA estimate.<br />
Risks to central scenario<br />
Our main concern is an increased level of competition in all markets under operation, particularly<br />
Kuwait, which accounts for the bulk of Wataniya’s revenue stream. For year-end 2009, Kuwait<br />
accounted for approximately 42% of overall revenue, and was the only country, which posted an<br />
annual revenue decline of 11% at the end of December 2009.<br />
The expected entry of France Telecom’s, Divona, into the Tunisian market by mid-2010, could<br />
result in a price war, thereby diluting ARPU and put EBITDA margins under pressure.<br />
Another risk to our forecasts is Wataniya’s inability to continue capitalising on its ‘window of<br />
opportunity’ in Algeria, following the significant customer base it managed to acquire from its<br />
leading competitor, Egyptian-owned Djezzy.<br />
Political instability, particularly in Iraq and Palestine, could mean increased security costs and<br />
delayed network rollout, all of which could put pressure on EBITDA margins.<br />
Finally, given the increased news flow in the market of the possibility of MTN of South Africa<br />
buying out a number of Orascom Telecom’s operations, which include Tunisiana (the 50-50% joint<br />
venture between Wataniya and Egypt’s Orascom Telecom Holding), a management or ownership<br />
struggle may occur, in the absence of a first right of refusal for Wataniya.<br />
Key drivers<br />
We believe Wataniya is one of the few operators which grew steadily, while maintaining control<br />
over its operations and deriving the benefits of economies of scale.<br />
Diversification of revenue<br />
Despite our general opinion that a local play is usually better managed than a widely diversified<br />
range of operations, we believe Wataniya is one of the few operators which grew steadily, while<br />
maintaining control over its operations and deriving the benefits of economies of scale.<br />
Attractive portfolio of exposure<br />
We believe Wataniya’s geographical footprint is attractive, giving exposure to countries with a<br />
young and fast-growing population, which are comprised of a high youth segment, in turn, leading<br />
to an increased potential in the offering of value-added services, such as multimedia content and<br />
broadband services.<br />
Wataniya | <strong>Investment</strong> View | 12 May 2010 3<br />
57
Association with Qatar Telecom beneficial<br />
The takeover by Qatar Telecom has brought many synergies. Wataniya International moved its<br />
headquarters from the UAE to Doha, Qatar, where Qatar Telecom’s headquarters are based.<br />
Additionally, Wataniya can leverage the relationships built by Qatar Telecom for its own<br />
operations such as contracting Ericsson, which has had a long-standing relationship with Qatar<br />
Telecom, to upgrade its networks in Palestine as an example.<br />
We believe Wataniya’s close relationship with Qatar Telecom, should prove beneficial in the longrun,<br />
as Qatar Telecom is continuing with its expansion strategy, with the target of becoming one of<br />
the top 20 global telecom players by 2020. There are multiple synergies that could be derived,<br />
including capitalising on a strong purchasing power from network vendors, roaming agreements,<br />
shared market experience, technology and software platforms<br />
Open to foreign investment<br />
Wataniya is completely open to foreign investment, unlike some of its GCC counterparts.<br />
Upcoming IPOs<br />
With the upcoming IPOs in Palestine and Tunisia, repatriation of funds should not become an<br />
issue as witnessed in the recent standoff between Orascom Telecom and the Algerian<br />
government.<br />
Leverage<br />
Gearing remains low with net debt/EBITDA standing at 0.05x for 2009. With the absence of<br />
current acquisition opportunities, we do not expect debt to increase materially; Wataniya has<br />
enjoyed a growing positive free cash flow position since 2005.<br />
Wataniya | <strong>Investment</strong> View | 12 May 2010 4<br />
58
Company dynamics<br />
Wataniya currently operates in several markets in the MENA region and South Asia,<br />
namely, Kuwait, Saudi Arabia, Palestine, Tunisia, Algeria and the Maldives.<br />
Wataniya – Kuwait forecasts (100% stake)<br />
The inception of Wataniya Telecom broke a 14-year monopoly enjoyed by Zain Group in the<br />
Kuwaiti telecom market. Kuwait continues to be the largest revenue driver to overall consolidated<br />
revenues, however, Wataniya is increasingly starting to realise larger proportions of its revenue<br />
from outside the country as operations abroad start to mature. In 2009, Kuwait accounted for<br />
approximately 42% of total revenue compared to 60% in 2003.<br />
With the entry of Saudi Telecom Company (STC), branded Viva, as the third mobile operator in<br />
Kuwait, Wataniya’s home market, Wataniya Kuwait lost market share, holding 38% by year-end of<br />
2009 compared to 43% in 2008. That being said, Wataniya managed to fare better than Zain, with<br />
market share loss estimated to be contained around 4% compared to Zain’s 11% market share<br />
loss for year-end 2009. Kuwait was the only segment to report a revenue decline in 2008-09.<br />
Due to Viva’s entrance, Wataniya Kuwait has focused on customer loyalty enhancement while<br />
also launching several new products and services. In 2009, it launched ‘Wink’, a new brand<br />
designed for the youth segment, comprising of 20 different initiatives structured into four main<br />
categories, accommodating an entertainment experience for both prepaid and postpaid<br />
customers. It also launched ‘Maxpress’, a prepaid line that provides a bonus of 25% on calls<br />
exceeding KD10 per month. According to the latest earnings call, Wataniya’s operations in Kuwait<br />
going forward will focus more on high-end prepaid customers, BlackBerry solutions and B2B<br />
services. By 3Q09, Wataniya Kuwait’s BlackBerry customers exceeded 11,000. Kuwait is counted<br />
as one of the more developed markets under Wataniya’s umbrella of operations, with the<br />
company upgrading its nationwide HSPDA network to deliver a 7.2Mbps service as management<br />
sees data services as a high-growth segment in a saturating market.<br />
Chart 1 : Wataniya Kuwait subs and market share<br />
Chart 2 : Wataniya Kuwait revenue and EBITDA margin<br />
2.0<br />
44%<br />
230<br />
60%<br />
1.5<br />
42%<br />
40%<br />
225<br />
220<br />
215<br />
50%<br />
40%<br />
1.0<br />
38%<br />
210<br />
205<br />
30%<br />
`<br />
36%<br />
200<br />
`<br />
20%<br />
0.5<br />
34%<br />
195<br />
190<br />
10%<br />
0.0<br />
32%<br />
185<br />
0%<br />
2008a 2009a 2010e 2011f 2012f<br />
Wataniya-Kuwait mobile subscribers (m)<br />
Wataniya-Kuwait market share (%)<br />
2008a 2009a 2010e 2011f 2012f<br />
Wataniya-Kuwait revenue (KWD mn)<br />
Wataniya-Kuwait EBITDA margin<br />
Source: Company data, <strong>Rasmala</strong> forecasts<br />
Source: Company data, <strong>Rasmala</strong> forecasts<br />
Blended ARPU in Kuwait is very high compared to its other geographies, possibly as a<br />
consequence of the long-standing duopoly or the high level of value-added services offered by<br />
Wataniya. Wataniya’s revenues from its business segment (corporate solutions) are also reflected<br />
in the ARPU, which may dilute the integrity of the metric. Wataniya Kuwait’s blended ARPU at the<br />
end of 4Q09 was KD10.7, a drop of 22% compared to KD13.7 in 2008.<br />
We expect pressure on both margins and market share to continue as a result of the increased<br />
level of competition; however, we believe Wataniya’s customer retention efforts and the<br />
segmented programmes and market promotions would mitigate the effects.<br />
Wataniya | <strong>Investment</strong> View | 12 May 2010 5<br />
59
Valuation<br />
Our estimated value for Kuwait’s operations is KD1.18 per share, based on a DCF valuation,<br />
which constitutes around 52% of Wataniya’s total enterprise value.<br />
Nedjma- Algeria forecasts (71% stake)<br />
Branded Nedjma, Wataniya Telecom Algeria commenced operations in 2004 and has now<br />
become the second-largest mobile operator in the country, reaching 8m subscribers year end<br />
2009. As of 2009, Nedjma contributed more than 29% of Wataniya Telecom’s revenue.<br />
Chart 3 : Algeria total mobile subscribers and penetration rate<br />
35.0<br />
30.0<br />
25.0<br />
20.0<br />
15.0<br />
10.0<br />
5.0<br />
0.0<br />
2003a 2004a 2005a 2006a 2007a 2008a 2009a 2010e 2011f 2012f<br />
Algeria mobile subscribers (m) Penetration rate (%)<br />
`<br />
90%<br />
80%<br />
70%<br />
60%<br />
50%<br />
40%<br />
30%<br />
20%<br />
10%<br />
0%<br />
Source: Company data, ITU, Operators, <strong>Rasmala</strong> forecasts<br />
In a twist of fate, Wataniya was able to capitalise on the tensions resulting from the outcome an<br />
Algeria-Egypt World Cup-qualifying football match on 14 November 2009 erupted in riots, and<br />
then later the African Cup of Nations football match between Egypt and Algeria. With national<br />
sentiment overpowering everything else, Wataniya was able to seize the ‘window of opportunity’<br />
that presented itself to take over market share from its leading rival, Egyptian-based, Orascom<br />
Telecom Algeria (Djezzy), by taking a strategic decision to sponsor the Algerian football team. The<br />
sponsorship proved to be very rewarding, as customer sentiment accelerated subscriber growth in<br />
the fourth quarter of 2009, reaching a total net subscriber addition of almost 3m, compared to an<br />
average of 0.8m during the first three quarters of 2009.<br />
On the other hand, EBITDA margins weakened sharply during the fourth quarter of 2009, as a<br />
result of an increased marketing efforts and the impact of the 5.5% revenue tax.<br />
With the expectation that Nedjma, would be able to continue capitalising on its ‘windfall’ in terms of<br />
subscriber additions from Djezzy’s subscriber churn, we continue to favour the Algerian operations,<br />
as we believe there is upside potential to ARPU levels, in the oil-rich country given improving<br />
economic conditions, and the trickle down effect translates into higher purchasing power.<br />
Chart 4 : Wataniya-Nedjma subs and market share<br />
Chart 5 : Wataniya-Nedjma revenue and EBITDA margin<br />
12.0<br />
10.0<br />
8.0<br />
6.0<br />
4.0<br />
2.0<br />
0.0<br />
2008a 2009a 2010e 2011f 2012f<br />
`<br />
40%<br />
35%<br />
30%<br />
25%<br />
20%<br />
15%<br />
10%<br />
5%<br />
0%<br />
200<br />
150<br />
100<br />
50<br />
0<br />
2008a 2009a 2010e 2011f 2012f<br />
`<br />
34%<br />
33%<br />
32%<br />
31%<br />
30%<br />
29%<br />
28%<br />
27%<br />
26%<br />
Wataniya-Nedjma mobile subscribers (m)<br />
Wataniya-Nedjma revenue (KWD mn)<br />
Wataniya- Nedjma market share (%)<br />
Wataniya-Nedjma EBITDA margin<br />
Source: Company data, <strong>Rasmala</strong> forecasts<br />
Source: Company data, <strong>Rasmala</strong> forecasts<br />
Wataniya | <strong>Investment</strong> View | 12 May 2010 6<br />
60
At present, 3G licences have not been offered in Algeria, leaving open the opportunity to benefit<br />
from high speed data provision absent in the short to medium term. However, if the Algerian<br />
government is to offer a 3G licence, and Wataniya is to acquire it, it would present a good upside<br />
opportunity. The main risk we believe in operating in Algeria, is the privatisation of Algerie<br />
Telecom, which would introduce even higher competition to the Algerian market.<br />
Valuation<br />
Our estimated value for Algeria’s operations is KD0.34 per share, based on a DCF valuation,<br />
which constitutes around 15% of Wataniya’s total Enterprise value.<br />
Tunisiana –Tunisia forecasts (50%)<br />
Tunisiana (a 50-50% joint venture with Egypt’s Orascom Telecom Holding), began operations in<br />
2002 and has grown to become Tunisia’s number one mobile operator. Tunisiana ended 2009<br />
with an overall market share of 53.4% and 5.2m subscribers compared to 51% overall market<br />
share and 4.3m subscribers at the end of 2008. As of 2009, it had contributed over 21% of<br />
Wataniya’s total revenue.<br />
With the expected entry of France Telecom’s Orange to the Tunisian market sometime during<br />
2010, Tunisiana focused its strategy on various retention initiatives directed towards its high value<br />
post-paid and business segments aimed at increasing revenues and reinforcing loyalty.<br />
We expect the entry of Orange to the Tunisian market to spur competition in the Tunisian market,<br />
given that mobile penetration is already high reaching an approximate 90% for year-end 2009,<br />
and setting tariff rates for a sharp decline. Therefore, we expect EBITDA margins to come under<br />
pressure at least during 2010 and 2011 till competitive pressure should be somewhat relieved,<br />
and for margins to reach stability. Furthermore, Orange holds Tunisia’s only 3G licence and<br />
Wataniya has not revealed plans to obtain a 3G licence in Tunisia, as yet.<br />
Chart 6 : Tunisia total mobile subscribers and penetration rate<br />
14.0<br />
12.0<br />
10.0<br />
8.0<br />
6.0<br />
4.0<br />
2.0<br />
0.0<br />
2003a 2004a 2005a 2006a 2007a 2008a 2009a 2010e 2011f 2012f<br />
`<br />
140%<br />
120%<br />
100%<br />
80%<br />
60%<br />
40%<br />
20%<br />
0%<br />
Tunisia mobile subscribers (m)<br />
Penetration rate(%)<br />
Source: Company data, ITU, Operators, <strong>Rasmala</strong> forecasts<br />
We believe the incumbent, Tunisie Télécom, will likely suffer the greatest market share loss from<br />
the entry of France Telecom, given that the Orange will be present in the fixed line and broadband<br />
market as well.<br />
France Telecom and Tunisian partner Divona were awarded a 15-year fixed and mobile phone<br />
licence in Tunisia mid-2009, after submitting a €137.65m bid. At the time, the Tunisian<br />
Communications Minister, Haj Klai, had stated that the winning bid was 46% higher than<br />
anticipated by international advisors. France Telecom-Orange will own 49% of the joint venture,<br />
with the remaining stake to be held by Divona.<br />
Wataniya | <strong>Investment</strong> View | 12 May 2010 7<br />
61
Chart 7 : Wataniya- Tunisiana subs and market share<br />
Chart 8 : Wataniya Tunisiana revenue* and EBITDA<br />
margin<br />
8.0<br />
7.0<br />
6.0<br />
5.0<br />
4.0<br />
3.0<br />
2.0<br />
1.0<br />
0.0<br />
2008a 2009a 2010e 2011f 2012f<br />
`<br />
56%<br />
55%<br />
54%<br />
53%<br />
52%<br />
51%<br />
50%<br />
49%<br />
48%<br />
140.0<br />
120.0<br />
100.0<br />
80.0<br />
60.0<br />
40.0<br />
20.0<br />
0.0<br />
2008a 2009a 2010e 2011f 2012f<br />
`<br />
55%<br />
54%<br />
53%<br />
52%<br />
51%<br />
50%<br />
49%<br />
48%<br />
47%<br />
46%<br />
Wataniya-Tunsiana subscribers (m)<br />
Wataniya-Tunisiana market share (%)<br />
Wataniya-Tunisiana revenue (KWDm)<br />
Wataniya-Tunisiana EBITDA margin<br />
Source: Company data, <strong>Rasmala</strong> forecasts<br />
Source: Company data, <strong>Rasmala</strong> forecasts * Proportional revenue<br />
It is worth mentioning that according to the Tunisian GSM licence, Wataniya is also required to<br />
issue an IPO, which we believe would be beneficial, since it will allow for additional funding<br />
sources, and as witnessed recently in the standoff between Algeria and Orascom Telecom, would<br />
not immobilise the repatriation of funds process.<br />
Valuation<br />
Our estimated value for Tunisia’s operations is KD0.63 per share, based on a DCF valuation,<br />
which constitutes around 28% of Wataniya’s total enterprise value.<br />
Bravo – Saudi Arabia forecasts (56% stake)<br />
Bravo’s commercial launch took place in July 2005. Bravo is the only wireless network operator<br />
providing ‘Push to Talk’ services in Saudi Arabia, offering both PTT and cellular communications<br />
services to the private and government sectors. Bravo’s customer base reached 0.19m at the end<br />
of 4Q09, an increase of 24% from 4Q08. EBITDA margins have not turned positive yet, but we<br />
expect EBITDA margins to turn positive by 2010, while net income should turn positive beyond<br />
2012. Bravo’s contribution to Wataniya’s overall revenue remains quite limited, standing at less<br />
than 5% for year-end 2009. We expect Bravo to continue being a relatively small contributor to<br />
both consolidated revenues and EBITDA throughout our forecast period.<br />
Chart 9 : Bravo-Saudi Arabia revenue and EBITDA margin<br />
35<br />
30<br />
25<br />
20<br />
15<br />
10<br />
5<br />
0<br />
`<br />
2008a 2009a 2010e 2011f 2012f<br />
34%<br />
33%<br />
32%<br />
31%<br />
30%<br />
29%<br />
28%<br />
27%<br />
26%<br />
Bravo revenue (KWD mn)<br />
Bravo EBITDA margin<br />
Source: Company data, <strong>Rasmala</strong> forecasts<br />
Valuation<br />
Our estimated value for Bravo’s operations is KD0.07 per share, based on a DCF valuation, which<br />
constitutes around 3% of Wataniya’s total Enterprise value.<br />
Wataniya | <strong>Investment</strong> View | 12 May 2010 8<br />
62
Wataniya – Maldives forecasts (100% stake)<br />
Wataniya commenced operations in the Maldives in August 2005 with a 15-year licence term, and<br />
offers mobile and data services across all the country’s inhabited islands. It offers a range of<br />
mobile services for the Maldives’s many international visitors and residents, delivered across the<br />
country’s first-ever 3G and HSDPA-ready network. Wataniya’s plans for the Maldives focus on<br />
increasing network coverage and penetration in the country’s rapidly growing resort sector.<br />
Chart 10 : Maldives total mobile subscribers and penetration rate<br />
0.6<br />
30%<br />
0.5<br />
25%<br />
0.4<br />
20%<br />
0.3<br />
15%<br />
0.2<br />
`<br />
10%<br />
0.1<br />
5%<br />
0.0<br />
2003 2004 2005 2006 2007 2008 2009 2010F 2011F 2012F<br />
Maldives subscribers (m) Penetration rate (%)<br />
0%<br />
Source: Company data, ITU, Operators, <strong>Rasmala</strong> forecasts<br />
Total subscribers reached 0.1m for the year-end 2009, while EBITDA turned positive for the first<br />
time year-end 2009. We expect Wataniya Maldives to maintain its growth rate and continue to<br />
expand its EBITDA margin. With the exception of Wataniya Palestine, which is still a start-up,<br />
Wataniya Maldives is the smallest contributor to overall revenue, contributing approximately 2% of<br />
total consolidated revenue for year-end 2009. Nevertheless, we expect the operations in the<br />
Maldives to remain a relatively small operation for Wataniya,<br />
Chart 11 : Wataniya Maldives subs and market share<br />
Chart 12 : Wataniya Maldives revenue and EBITDA margin<br />
0.1<br />
23%<br />
12<br />
25%<br />
0.1<br />
23%<br />
10<br />
20%<br />
0.1<br />
23%<br />
8<br />
15%<br />
0.1<br />
23%<br />
6<br />
10%<br />
0.1<br />
`<br />
23%<br />
4<br />
`<br />
5%<br />
0.1<br />
23%<br />
2<br />
0%<br />
0.1<br />
2008a 2009a 2010e 2011f 2012f<br />
Wataniya-Maldives subscribers (m)<br />
Wataniya- Maldives market share (%)<br />
23%<br />
0<br />
2008a 2009a 2010e 2011f 2012f<br />
Wataniya-Maldives revenue (KWD mn)<br />
Wataniya-Maldives EBITDA margin<br />
-5%<br />
Source: Company data, <strong>Rasmala</strong> forecasts<br />
Source: Company data, <strong>Rasmala</strong> forecasts<br />
Valuation<br />
Our estimated value for the Maldives’s operations is KD0.005 per share, based on a DCF<br />
valuation, which constitutes around 0.3% of Wataniya’s total enterprise value.<br />
Wataniya | <strong>Investment</strong> View | 12 May 2010 9<br />
63
Wataniya – Palestine forecasts (57% stake)<br />
Wataniya is the second licensed mobile operator in Palestine, breaking the long-standing<br />
monopoly of Palestine Telecommunications - Paltel. Having obtained its licence in 2006, it<br />
undertook extensive planning and preparatory initiatives ahead of being granted its frequency in<br />
late 2008. Wataniya is now poised to become a significant player in the Palestinian mobile market,<br />
having launched commercial services in November 2009.<br />
Chart 13 : Palestine total mobile subscribers and penetration rate<br />
4.0<br />
3.5<br />
3.0<br />
2.5<br />
2.0<br />
1.5<br />
1.0<br />
0.5<br />
0.0<br />
2003a 2004a 2005a 2006a 2007a 2008a 2009a 2010e 2011f 2012f<br />
`<br />
90%<br />
80%<br />
70%<br />
60%<br />
50%<br />
40%<br />
30%<br />
20%<br />
10%<br />
0%<br />
Palestine mobile subscribers (m)<br />
Penetration rate(%)<br />
Source: Company data, ITU, Operators, <strong>Rasmala</strong> forecasts<br />
According to management the network is performing well with roaming offers launched in January<br />
2010. By the end of 2009, Wataniya claimed a market share of 10%. While Wataniya’s operations<br />
in Palestine are currently focused on the West <strong>Bank</strong>, management said plans are under way to<br />
start operations in the Gaza strip.<br />
When Wataniya entered the market in November 2009, the existing player Paltel (subsidiary of<br />
Kuwait’s Zain Group) immediately commenced a predatory pricing strategy. However, Wataniya<br />
countered this move with attractive pricing bundles. In January 2010, it also introduced an<br />
attractive cross border offer to Wataniya customers in partnership with Orange Jordan. According<br />
to the conditions set out by the Palestine licence, Wataniya is required to launch an IPO.<br />
Chart 14 : Wataniya Palestine subs and market share<br />
Chart 15 : Wataniya Palestine revenue and EBITDA<br />
margin<br />
1.4<br />
35%<br />
50<br />
100%<br />
1.2<br />
1.0<br />
0.8<br />
0.6<br />
0.4<br />
0.2<br />
0.0<br />
2008a 2009a 2010e 2011f 2012f<br />
Wataniya-Palestine mobile subscribers (m)<br />
Wataniya-Palestine market share (%)<br />
`<br />
30%<br />
25%<br />
20%<br />
15%<br />
10%<br />
5%<br />
0%<br />
40<br />
30<br />
20<br />
10<br />
0<br />
2008a 2009a 2010e 2011f 2012f<br />
Wataniya-Palestine revenue (KWD m)<br />
Wataniya-Palestine Ebitda margin (%)<br />
`<br />
0%<br />
-100%<br />
-200%<br />
-300%<br />
-400%<br />
-500%<br />
Source: Company data, <strong>Rasmala</strong> forecasts<br />
Source: Company data, <strong>Rasmala</strong> forecasts<br />
Valuation<br />
Our estimated value for the Palestine’s operations is KD0.03 per share, based on a DCF<br />
valuation, which constitutes around 1.3% of Wataniya’s total enterprise value.<br />
Wataniya | <strong>Investment</strong> View | 12 May 2010 10<br />
64
Chart 16 : Wataniya total revenue breakdown 2009<br />
Chart 17 : Wataniya total revenue breakdown 2012F<br />
Maldives, 2%<br />
Palestine, 7%<br />
Maldives, 2%<br />
Palestine, 7%<br />
Saudi Arabia, 5%<br />
Kuwait, 36%<br />
Saudi Arabia, 5%<br />
Kuwait, 36%<br />
Algeria, 30%<br />
Algeria, 30%<br />
Tunisia, 20%<br />
Tunisia, 20%<br />
Source: Company data, <strong>Rasmala</strong><br />
Source: Company data, <strong>Rasmala</strong> forecasts<br />
Chart 18 : Wataniya total EBITDA breakdown 2009<br />
Chart 19 : Wataniya total EBITDA breakdown 2012F<br />
Algeria, 24%<br />
Saudi Arabia, -<br />
1%<br />
Maldives, 0%<br />
Palestine, -1%<br />
Kuwait, 50%<br />
Maldives, 1%<br />
P alestine, 2%<br />
Saudi A rabia,<br />
3%<br />
Kuwait, 41%<br />
A lgeria, 25%<br />
Tunisia, 29%<br />
Tunisia, 28%<br />
Source: Company data, <strong>Rasmala</strong><br />
Source: Company data, <strong>Rasmala</strong> forecasts<br />
Wataniya | <strong>Investment</strong> View | 12 May 2010 11<br />
65
Wataniya: appendix<br />
Company overview<br />
Wataniya Telecom, also known as the National Mobile Telecommunications Company (NMTC), is<br />
a Kuwait-based provider of mobile telephony and wireless data services. Owned by the Kuwait<br />
<strong>Investment</strong> Projects Company (KIPCO), Wataniya commenced operations in 1999 as the first<br />
privately owned operator in the country. Qatar Telecom (Qtel) purchased a 51% stake in Wataniya<br />
from KIPCO in 2007 and currently owns 52.5% of the company. Wataniya currently operates in<br />
several markets in the MENA region and South Asia, namely, Kuwait, Saudi Arabia, Palestine,<br />
Tunisia, Algeria, and the Maldives. The company focuses on two business segments: Personal<br />
and Business. The Personal segment offers various mobile wireless services such as pay plans,<br />
video calling, as well as messaging, roaming and augmented value-added services. The Business<br />
segment offers mobility and corporate solutions, including business process optimisation.<br />
Wataniya Telecom was incorporated on 10 October 1997 but commenced commercial operations<br />
in December 1999 as the second-licenced GSM operator in Kuwait under the ownership of<br />
KIPCO. Wataniya was listed on the Kuwait Stock Exchange in July 1999 as Wataniya. Qtel<br />
acquired a 51% stake in Wataniya from KIPCO in March 2007 for US$3.72bn.<br />
Wataniya’s first push into new markets began with the acquisition of a 50% stake in the Tunisian<br />
operator, Tunisiana, in 2002. In December 2003, Wataniya successfully bid for a licence to<br />
operate in Algeria and launched its services in August 2004 under the Nedjma brand. Wataniya<br />
International was formed in 2004 in Dubai (UAE) as a holding company to oversee investments<br />
and operations abroad for Wataniya Telecom. After Qtel took over Wataniya in 2007, Wataniya<br />
International moved its headquarters to Doha, Qatar. 2005 saw Wataniya obtain a licence to<br />
operate a network in the Maldives and venture into Saudi Arabia with the launch of the Public<br />
Telecommunications Company (PTC). PTC was the first specialised mobile operator in the GCC<br />
to offer a ‘push-to-talk’ communications service, which was then introduced in Kuwait in May<br />
2006.<br />
In December 2006, Wataniya International and the Palestinian <strong>Investment</strong> Fund agreed to form<br />
Wataniya Palestine Telecom (Wataniya Mobile), commencing operations in the second half of<br />
2009.<br />
Chart 20 : Wataniya Group Overview<br />
Wataniya<br />
Wataniya<br />
International (Doha)<br />
100%<br />
Nedjma(Algeria)<br />
71%<br />
Tunisiana<br />
(Tunisia)<br />
50%<br />
Wataniya<br />
Maldives<br />
100%<br />
Wataniya<br />
Palestine<br />
57%<br />
Bravo Telecom<br />
(Saudi Arabia)<br />
56%<br />
WataniyaKuwait<br />
100%<br />
Source: Company data, <strong>Rasmala</strong><br />
Wataniya | <strong>Investment</strong> View | 12 May 2010 12<br />
66
Major events by year<br />
Chart 21 : Major events by year<br />
Launches the<br />
“International<br />
Top-u p<br />
Service”<br />
Commences<br />
operations in<br />
Algeria under<br />
the brand<br />
name, Nedjma<br />
Forms<br />
Wataniya<br />
International<br />
Ventures into<br />
Saudi Arabia<br />
under the<br />
brand name,<br />
Bravo<br />
Obtains<br />
licence to<br />
operate a<br />
network in the<br />
Maldives<br />
Obtains<br />
licence to<br />
operate in<br />
Palestine<br />
Launches<br />
High-Speed<br />
Downlink<br />
Packet Access<br />
(HSDPA) in<br />
February<br />
Launches<br />
W-Sahmak<br />
Service<br />
Launches<br />
Mobile TV<br />
Service<br />
Qatar<br />
Telecom<br />
buys 51% of<br />
NMTC in<br />
March<br />
Launches<br />
Mobile<br />
in-flight<br />
roaming<br />
service<br />
Partners with<br />
Gameloft to<br />
launch mobile<br />
games<br />
Wataniya<br />
Telecom<br />
launches<br />
BlackBerry<br />
prepaid<br />
services<br />
Wataniya<br />
Mobile<br />
(Palestine)<br />
commences<br />
commercial<br />
operations<br />
Wataniya<br />
mobile<br />
(Palestine)<br />
signs a<br />
strategic<br />
alliance with<br />
Orange Jordan<br />
2004 2005 2006 2007 2008 2009<br />
2010<br />
Source: Company filings, Reuters Knowledge<br />
! Region’s first national MMS interconnectivity agreement in 2003: Wataniya and MTC<br />
(known as Zain) sign an MMS interconnectivity agreement to boost expansion of photo<br />
messaging and other multimedia messaging services in Kuwait.<br />
! Algeria licence and operation: Wataniya mobile obtains Algeria’s third mobile licence in<br />
December 2003 for US$421m to operate a dual-band GSM network for a 15-year period.<br />
Operations began in August 2004.<br />
! HSDPA: Wataniya telecom upgrades network architecture with HSDPA, enabling the<br />
provision of more data services.<br />
! Wataniya launches W-Sahmak service: Launched in March 2007, this service is tailored to<br />
keep customers updated in real time on prices on the Kuwait Stock Exchange.<br />
! Wataniya launches mobile TV: Launched in May 2007, Wataniya TV (WTV) enables<br />
customers to watch TV channels on their mobiles while on the move.<br />
! Wataniya launches mobile in-flight roaming service: Launched on 1 June 2008, the<br />
services allows customers to use their GSM mobile phones during flights – after takeoff and<br />
before landing.<br />
! The ‘International Top-Up service’: Launched in 2009, for the first time in Kuwait,<br />
Wataniya’s ‘International Top-Up service’ allows customers to top up the mobile credits of their<br />
family and friends in other countries.<br />
! Partnership with Gameloft: Wataniya Telecom partners with Gameloft, a leading publisher<br />
and developer of mobile games, to launch its game portal on WAP (Wireless application<br />
protocol). Wataniya offers a movie and music news portal to its customers already.<br />
! Wataniya launches BlackBerry prepaid services: Despite the BlackBerry already being<br />
available in Kuwait, Wataniya Telecom is the first operator in Kuwait to launch BlackBerry<br />
prepaid services in 2009.<br />
! Wataniya offers WBACKUP service: Launched in July 2009, the WBACKUP is an intelligent<br />
solution that enables customers to protect and save all their data content on their phones such<br />
as contacts, calendar, SMS, pictures and music.<br />
! Alliance with Orange: Wataniya’s Palestinian division signs a strategic alliance with Orange<br />
Jordan, the sole integrated telecom provider in Jordan, to enable both partners to offer<br />
competitive international and roaming calls to their customers.<br />
! Sale to Qatar Telecom: Qtel acquired a 51% stake in Wataniya Telecom for KD1.075bn<br />
through its subsidiary Qatar International <strong>Investment</strong> L.L.C., from a consortium led by KIPCO,<br />
which owns c. 24%. On 15 July 2007, Qtel announced that part of the purchase price for its<br />
acquisition which was held back for warranties in escrow, had been released to KIPCO. Qtel’s<br />
Wataniya | <strong>Investment</strong> View | 12 May 2010 13<br />
67
agreement with the KIPCO consortium included warranties related to Wataniya’s potential<br />
liabilities, in particular with Wataniya’s venture in Iraq. With the liquidation of Wataniya’s Iraq<br />
operation, Qtel’s warranty claims were settled as per terms of the agreement with KIPCO. Qtel<br />
continues to withhold a further amount in escrow pending the outcome of an arbitration<br />
concerning Tunisiana. (Source: Reuters Knowledge)<br />
! Offer to acquire Al Bahar United Company: Wataniya Telecom acquired the retail<br />
company, Al Bahar United Company (Fono Brand) on 22 January 2009 for KD1.68bn. The<br />
acquisition was to provide Wataniya Telecom with direct access to its customers, increasing<br />
its points-of-sales through additional retail outlets. (Source: Reuters Knowledge, Company<br />
filing)<br />
! Liquidation: Iraqi operator Asia-Cell Cayman was liquidated and its assets were sold as<br />
ordered by a judiciary liquidator in November 2007. Wataniya will receive US$90m for the<br />
40% stake it holds in Asia-Cell Cayman and an additional US$17m on account of the debts<br />
that Asia-Cell owes it. (Source: Reuters Knowledge)<br />
! Increased stake in Public Telecommunication Company: Wataniya announced that it had<br />
acquired an additional 8.6% stake in PTC for US$18.5m in March 2007. Wataniya Telecom’s<br />
total stake in PTC is now at 55.6%.<br />
.<br />
Wataniya | <strong>Investment</strong> View | 12 May 2010 14<br />
68
Income statement<br />
KDm FY08A FY09A FY10F FY11F FY12F<br />
Revenue 481.8 480.3 524.9 558.1 591.2<br />
Cost of sales -174.8 -141.9 -184.9 -199.4 -208.8<br />
Operating costs -131.8 -110.7 -149.6 -159.0 -168.5<br />
EBITDA 175.3 227.7 190.3 199.6 213.9<br />
DDA & Impairment (ex gw) -78.2 -83.2 -94.4 -95.0 -94.2<br />
EBITA 97.1 144.5 96.0 104.6 119.7<br />
Goodwill (amort/impaired) 0.00 0.00 0.00 0.00 0.00<br />
EBIT 97.1 144.5 96.0 104.6 119.7<br />
Net interest -9.80 -10.1 -8.16 -3.31 1.61<br />
Associates (pre-tax) 0.00 0.00 0.00 0.00 0.00<br />
Other pre-tax items -3.41 -13.9 0.00 0.00 0.00<br />
Reported PTP 83.8 120.5 87.8 101.2 121.3<br />
Taxation -12.2 -23.3 -23.9 -24.8 -27.6<br />
Minority interests 10.8 11.0 21.2 6.41 -1.47<br />
Other post-tax items 0.00 0.00 0.00 0.00 0.00<br />
Reported net profit 82.4 108.3 85.1 82.9 92.3<br />
Tot normalised items 0.00 0.00 0.00 0.00 0.00<br />
Normalised EBITDA 175.3 227.7 190.3 199.6 213.9<br />
Normalised PTP 83.8 120.5 87.8 101.2 121.3<br />
Normalised net profit 82.4 108.3 85.1 82.9 92.3<br />
Source: Company data, <strong>Rasmala</strong> Research forecasts<br />
year to Dec<br />
Balance sheet<br />
KDm FY08A FY09A FY10F FY11F FY12F<br />
Cash & market secs (1) 113.4 135.3 198.7 242.7 296.9<br />
Other current assets 98.7 93.9 97.9 103.4 108.6<br />
Tangible fixed assets 380.8 413.1 445.5 468.5 483.5<br />
Intang assets (incl gw) 256.6 205.4 184.1 162.7 141.4<br />
Oth non-curr assets 51.7 40.7 40.7 40.7 40.7<br />
Total assets 901.1 888.4 966.8 1018 1071<br />
Short term debt (2) 1.12 0.00 0.00 0.00 0.00<br />
Trade & oth current liab 300.1 258.6 352.3 378.4 386.4<br />
Long term debt (3) 138.1 128.9 71.6 40.2 13.5<br />
Oth non-current liab 46.8 15.9 14.3 14.3 14.3<br />
Total liabilities 486.1 403.3 438.2 432.9 414.2<br />
Total equity (incl min) 415.0 485.1 528.6 585.2 656.8<br />
Total liab & sh equity 901.1 888.4 966.8 1018 1071<br />
Net debt 43.0 10.4 -94.1 -171.2 -256.7<br />
Source: Company data, <strong>Rasmala</strong> Research forecasts<br />
year ended Dec<br />
Cash flow statement<br />
KDm FY08A FY09A FY10F FY11F FY12F<br />
EBITDA 175.3 227.7 190.3 199.6 213.9<br />
Change in working capital 69.4 -59.8 73.5 22.2 7.56<br />
Net interest (pd) / rec -9.80 -10.1 -8.16 -3.31 1.61<br />
Taxes paid -7.94 -17.6 -23.9 -24.8 -27.6<br />
Other oper cash items 13.8 30.9 0.00 0.00 0.00<br />
Cash flow from ops (1) 240.7 171.1 231.8 193.7 195.5<br />
Capex (2) -112.5 -105.4 -105.3 -96.7 -87.8<br />
Disposals/(acquisitions) 0.00 0.00 0.00 0.00 0.00<br />
Other investing cash flow 0.00 18.9 0.00 0.00 0.00<br />
Cash flow from invest (3) -112.5 -86.5 -105.3 -96.7 -87.8<br />
Incr / (decr) in equity 0.00 0.00 0.00 0.00 0.00<br />
Incr / (decr) in debt 0.00 0.00 0.00 0.00 0.00<br />
Ordinary dividend paid -22.8 -24.4 -20.4 -19.9 -22.1<br />
Preferred dividends (4) 0.00 0.00 0.00 0.00 0.00<br />
Other financing cash flow -71.5 -34.7 -40.0 -34.3 -27.1<br />
Cash flow from fin (5) -94.2 -59.1 -60.4 -54.2 -49.2<br />
Forex & disc ops (6) 0.00 -3.59 -2.58 1.22 -4.34<br />
Inc/(decr) cash (1+3+5+6) 33.9 21.9 63.5 44.0 54.1<br />
Equity FCF (1+2+4) 128.1 65.7 126.5 96.9 107.7<br />
Source: Company data, <strong>Rasmala</strong> Research forecasts<br />
year to Dec<br />
Wataniya | Key Financial Data | 12 May 2010<br />
69
wa<br />
Equity | Qatar | Telecommunications<br />
12 May 2010<br />
Initiation of coverage<br />
Buy<br />
Target price<br />
QR216.72<br />
Price<br />
QR159.30<br />
Short term (0-60 days)<br />
n/a<br />
Market view<br />
No Weighting<br />
Price performance<br />
(1M) (3M) (12M)<br />
Price (QR) 153.4 155.1 116.1<br />
Absolute (%) 3.8 2.7 37.2<br />
Rel market (%) 8.1 -4.4 24.2<br />
Rel sector (%) 9.8 0.5 38.7<br />
May 07 May 08 May 09<br />
400<br />
350<br />
300<br />
250<br />
200<br />
150<br />
100<br />
50<br />
QTEL.QA<br />
Market capitalisation<br />
QR23.36bn (€67.02bn)<br />
Average (12M) daily turnover<br />
QR6.82m<br />
QE Index<br />
Sector: QE Industries Index<br />
RIC: QTEL.QA, QTEL QD<br />
Priced QR159.30 at close 6 May 2010.<br />
Source: Bloomberg<br />
Q-Tel<br />
The best of both worlds<br />
Q-Tel offers integrated telecommunications services and operates in 17<br />
countries. Its main operational subsidiaries include Nawras, Wataniya, Asiacell,<br />
Indosat, Liberty and Wi-Tribe, and it has strategic holdings in Asia Mobile and<br />
NavLink (associates).<br />
Key forecasts<br />
FY08A FY09A FY10F FY11F FY12F<br />
Revenue (QRm) 20,319 24,025 26,687 28,808 31,013<br />
EBITDA (QRm) 10,164 12,124 13,583 14,674 15,994<br />
Reported net profit (QRm) 2,306 2,780 2,860 2,958 3,559<br />
Normalised net profit (QRm) 2,306 2,780 2,860 2,958 3,559<br />
Normalised EPS (QR) 15.7 19 19.5 20.2 24.3<br />
Dividend per share (QR) 10 7 8.6 7.45 8.96<br />
Dividend yield (%) 6.28 4.39 5.4 4.68 5.63<br />
Normalised PE (x) 10.1 8.4 8.17 7.9 6.56<br />
EV/EBITDA (x) 4.28 3.92 3.36 2.75 2.04<br />
EV/invested capital (x) 0.92 0.89 0.83 0.76 0.66<br />
ROIC - WACC (%) 0 0 0 0 0<br />
Accounting standard: IFRS<br />
Source: Company data, <strong>Rasmala</strong> Research forecasts<br />
year to Dec, fully diluted<br />
Q-Tel sees substantial growth in the data segment<br />
Based on our investment theme, which stresses the importance of high-speed data services,<br />
we believe there is substantial potential for Qatar Telecom to capitalise on this segment.<br />
According to management, there are several markets that have extensive data business and<br />
substantial revenue potential, including Qatar, Kuwait and Indonesia, where subscribers rely<br />
heavily on HSPA and Blackberry.<br />
Reduction in royalty fees<br />
Qatar Telecom recently discontinued a royalty payment of 25% to the government of Qatar<br />
according to a decree issued by the government. It now has to pay an annual industry fee of<br />
12.5% of profits generated from its domestic operations. The company also has to pay a 1%<br />
fee on revenue from domestic operations from the effective date.<br />
Analyst<br />
Shrouk Diab<br />
+20 1 9991 6882<br />
shrouk.diab@rasmala.com<br />
Dubai International Financial Centre,<br />
The Gate Village, Building 10, Level 1,<br />
P.O. Box 31145, Dubai, United Arab<br />
Emirates<br />
www.rasmala.com<br />
Potential to increase stake in minority positions<br />
Qatar Telecom has the option to increase its share in profitable assets, particularly in Asia<br />
Cell (49%-owned) and Wataniya (52.5% owned). Another long-term growth driver, in our<br />
view, may be a potential stake increase stake in Asia Mobile Holding (AMH). AMH is a<br />
holding company in which Qatar Telecom has a 25% stake. AMH has operations in Laos,<br />
Cambodia, Singapore and the Philippines.<br />
We initiate coverage of Qatar Telecom (Q-Tel) with a Buy rating<br />
We initiate coverage of Q-Tel with a Buy rating and a 12-month target price of QR216.7 per<br />
share. We use a blended methodology combining a sum-of-the-parts-based DCF and peer<br />
comparables, weighted equally, to value Q-Tel.<br />
Important disclosures can be found in the Disclosures Appendix.<br />
Distributed outside MENA by The Royal <strong>Bank</strong> of Scotland N.V. and its affiliates under a strategic<br />
alliance with <strong>Rasmala</strong> <strong>Investment</strong> <strong>Bank</strong> Ltd.
<strong>Investment</strong> view<br />
We initiate coverage of Qatar Telecom with a Buy rating and a 12-month target price of<br />
QR216.7 per share. We use a blended methodology combining a sum-of-the-parts-based<br />
DCF and peer comparables to value Q-Tel.<br />
Competition is stabilising<br />
Minority buyouts<br />
Fixed-network launch in Oman<br />
Upcoming IPOs<br />
Considering the ongoing strong price competition in Qatar following the recent entry of Vodafone<br />
to the local market, if competition starts to stabilise, there should no longer be any pressure on<br />
ARPUs or EBITDA margins. This should provide a catalyst for Qatar Telecom, given that the<br />
domestic market is the second-largest revenue generator for Q-Tel, particularly since, according<br />
to Qatar Telecom’s management, recent market share loss in the domestic market was primarily a<br />
function of aggressive pricing.<br />
We believe minority buy-outs, namely in Asia Cell (49%-owned) and Wataniya (52.5%-owned),<br />
would be a catalyst for the stock. Another long-term growth driver may be, in our view, a potential<br />
stake increase in Asia Mobile Holding (AMH). AMH is a holding company in which Qatar Telecom<br />
has a 25% stake. AMH has operations in Laos, Cambodia, Singapore and the Philippines. On a<br />
similar note, we believe it would be beneficial for Wataniya (52.5% owned by Qatar Telecom) to<br />
acquire Orascom Telecom’s 50% share in Tunisiana in the event that Orascom Telecom decides<br />
to sell its stake at a reasonable price as that would eliminate any possible management struggles<br />
between Wataniya and the management of the new operator. In late April 2010, Reuters reported<br />
that Orascom Telecom is in talks with MTN (of South Africa) for the sale of some of its assets,<br />
including Tunisiana, but negotiations are ongoing, and no final agreement has been reached as<br />
yet.<br />
Qatar Telecom’s management expects to launch its fixed network in Oman in 2010. However, we<br />
have not factored this into our forecasts due to insufficient information.<br />
The upcoming IPOs of both Palestine and Tunisia (as reported by management during Q-Tel’s 4Q<br />
2009 conference call) should decrease any likelihood of problems in repatriating funds as was<br />
witnessed in a recent standoff between Orascom Telecom and the Algerian government.<br />
Valuation and target price<br />
We equally weight our peer group average PE-based valuation (13.1x for FY10F and 11.5x for<br />
FY11F giving a valuation of QR244.2) and our sum-of-the-parts-based DCF valuation (QR189.3)<br />
to arrive at our target price of QR216.7.<br />
Table 1 : PE comparables for telecom peers, 2010-11<br />
Peers (x) 2010 2011<br />
Telefonos de Mexico 8.8 8.5<br />
Reliance Industries 19.6 14.1<br />
Telekom Malaysia 23.1 21.3<br />
Globe Telecom Inc 9.8 9.4<br />
Advanced Info Service 12.8 12.3<br />
Indosat TBK 17.7 14.9<br />
MTN Group 10.48 8.8<br />
Excelcomindo Pratama 15.4 12.4<br />
Turkcell Iletisim Hizmet 10.5 9.7<br />
Vodacom Group 10.53 9.2<br />
Bharti Airtel 12.3 13.2<br />
America Movil SAB de C 13.0 11.7<br />
China Telecom Corp 17.7 14.6<br />
Celtel Zambia 10.6 9.7<br />
Magyar 9.2 9.4<br />
Turk Telekomunikasyon 9.3 8.5<br />
Mobile Telesystems 12.6 7.8<br />
Average 13.1 11.5<br />
Source: Bloomberg<br />
Q-Tel | <strong>Investment</strong> View | 12 May 2010 2<br />
71
Table 2 : DCF assumptions<br />
Operations WACC Long term growth rate<br />
Qatar 10.7% 2.5%<br />
Iraq 11.7% 4.5%<br />
Oman 10.7% 2.5%<br />
Indonesia 11.3% 3.5%<br />
Wataniya companies<br />
Kuwait 10.2% 2.5%<br />
Tunisia 10.2% 3.0%<br />
Algeria 10.7% 3.5%<br />
Saudi Arabia 10.2% 2.5%<br />
Maldives 10.0% 3.0%<br />
Palestine 10.0% 4.0%<br />
Source: <strong>Rasmala</strong> estimates<br />
Table 3 : SOTP valuation<br />
Operations (QRm) Enterprise value Stake Proportionate EV<br />
Qatar 25,320 100% 25,320<br />
Iraq 24,539 30% 7,362<br />
Oman 3966 56% 2204<br />
Indonesia 15,793 65% 10,265<br />
Wataniya total 15,795 53% 6,779<br />
Total enterprise value 85,413 51,930<br />
Minus: net debt 24,171<br />
Total equity value 27,759<br />
Total outstanding shares (m) 147<br />
Total SOTP (QR per share) 189.3<br />
Source: <strong>Rasmala</strong> estimates<br />
How we differ from consensus<br />
We are 1% higher than Bloomberg consensus for both revenue estimates for 2010 and 2011. We<br />
are also slightly higher on our EBITDA estimates for both 2010 and 2011, by 3% and 2%,<br />
respectively, mainly due to our higher revenue estimates.<br />
Risks to central scenario<br />
Our main concern stems from the risk of increased price competition in all of Q-Tel’s markets. For<br />
instance, Vodafone Qatar, which recently launched its operations in Qatar, implemented<br />
aggressive pricing promotions which reduced Qatar Telecom’s market share. The expected entry<br />
of France Telecom’s Divona in the Tunisian market by mid-2010 could also result in a price war,<br />
thereby diluting ARPU and pressuring EBITDA margins.<br />
FX volatility could also pose another risk to our forecasts since the larger portion of revenue and<br />
EBITDA of the group is generated through its international operations, which could result in FX<br />
losses hitting the income statement. The segment most susceptible to FX volatility is Indonesia,<br />
the second-largest contributor to consolidated EBITDA (about 28% as of year-end 2009).<br />
In light of Qatar Telecom’s ambitious strategy to be one of the top-20 telecommunications<br />
companies in the world by 2020, and given our view that this goal could be achieved mainly<br />
through inorganic growth, our main concern is the risk that the company might overpay for<br />
licenses, something that MENA telecom operators have done in the past.<br />
Q-Tel | <strong>Investment</strong> View | 12 May 2010 3<br />
72
Company dynamics<br />
Q-Tel’s diversified portfolio provides exposure to the best of both worlds: in MENA, Q-Tel<br />
has exposure to high ARPUs and a relatively limited number of competitors, while in Asia,<br />
it has exposure to a high population base and relatively low mobile penetration rates.<br />
Diversification of revenue<br />
More focus on providing valueadded<br />
services<br />
A more cautious approach to<br />
expansion<br />
Scope to increase stake in<br />
minority positions<br />
Trading liquidity remains tight<br />
Given the geographical spread of Qatar Telecom’s assets in the MENA region and South East<br />
Asia, Qatar Telecom provides exposure to the best of both worlds. In the MENA region, Qatar<br />
Telecom has exposure to high ARPUs and a relatively limited number of competitors. In Asia<br />
(Indonesia and to a lesser extent Qatar Telecom’s 25% stake in Asia Mobile Holdings) it has<br />
exposure to a high population base and relatively low mobile penetration rates.<br />
Despite voice revenue remaining the prime contributor of overall revenue, Q-Tel has started to<br />
capitalise on providing value-added services to mitigate ARPU decline and increase customer<br />
loyalty, particularly with price-based competition increasing in a number of markets.<br />
Q-Tel’s management believes the company would look to expand only after the existing<br />
operations start delivering operational performance; this cautious approach likely stems from<br />
seeing the pitfalls experienced by some peers while expanding rapidly. We believe Q-Tel’s focus<br />
will remain the MENA area and Southeast Asia.<br />
Q-Tel has the option to increase its share in profitable assets, particularly in Asia Cell (49%-<br />
owned) and Wataniya (52.5%-owned). Another long-term growth driver may be, in our view, the<br />
potential acquisition of an increased stake in Asia Mobile Holding (AMH). AMH is a holding<br />
company, in which Q-Tel has a 25% stake. It has operations in Laos, Cambodia, Singapore and<br />
the Philippines.<br />
One of Q-Tel’s chief shortcomings is illiquidity; according to management, the company's has less<br />
than 25% free float.<br />
Operational summary<br />
We believe one of Q-Tel’s key strengths is its attractive geographical market spread. Q-Tel offers<br />
integrated telecommunications services and operates in 17 countries. Its main operational<br />
subsidiaries include Nawras, Wataniya, Asiacell, Indosat, Liberty and Wi-Tribe. Q-Tel also has<br />
strategic holdings in Asia Mobile and NavLink (associates).<br />
Attractive business portfolio<br />
We believe one of the key strengths of Q-Tel is its attractive market exposure portfolio. Indonesia,<br />
Qatar and Iraq are the highest contributors of revenue and EBITDA. That is not to say that<br />
Wataniya’s portfolio of assets is not beneficial to the company (Q-Tel owns 52.5% of Wataniya<br />
Telecom). Wataniya managed to improve EBITDA margins in 2009 in all its markets except<br />
Kuwait.<br />
Given the geographical spread of Q-Tel’s assets in the MENA region and Southeast Asia, Q-Tel<br />
provides exposure to the best of both worlds: in the MENA region, it offers exposure to high<br />
ARPUs and a relatively limited number of market competitors, while in Asia (Indonesia and to a<br />
lesser extent Q-Tel’s 25% stake in Asia Mobile Holdings), Q-Tel provides exposure to a high<br />
population base and relatively low mobile penetration rates.<br />
More focus on value-added services<br />
Despite voice revenue remaining the prime contributor of overall revenue, Q-Tel has started to<br />
capitalise on providing value-added services to mitigate ARPU decline and increase customer<br />
loyalty, particularly with price-based competition increasing in a number of its markets.<br />
For instance, Q-Tel announced recently the launch of the innovative new My-Fi personal mobile<br />
hot spot, a device which enables people to create their own Internet access from anywhere in<br />
Qatar. The technology also allows up to five people to access the device at any time using any<br />
WIFI-enabled device, including smart phones. We believe My-Fi is likely to be a very popular<br />
product, particularly among the youth since the device is smaller than the average mobile phone<br />
and allows multi-user connectivity in addition to wireless mobility, and allows data transfer speeds<br />
of up to 7.2Mbps.<br />
Q-Tel | <strong>Investment</strong> View | 12 May 2010 4<br />
73
From a general perspective, Q-Tel recently announced its intention to facilitate mobile banking<br />
services to its customers, which we believe could become a very powerful tool to attract and<br />
consequently retain customers, since mobile banking is proving to be an essential application.<br />
This would be particularly useful to the country’s large expatriate worker population, for whom<br />
remittances back home are vital.<br />
Significant potential for data services<br />
According to management, there are several mature markets that have extensive data services<br />
requirements and thus promise substantial revenue potential. These include Qatar, Kuwait and<br />
Indonesia, which rely heavily on HSPA and Blackberry, and other markets such as Kuwait, where<br />
home-based modems are extensively used. This segment has been growing substantially with the<br />
increase in the need for data connectivity. On the other hand, there are also less sophisticated<br />
markets like Iraq and Algeria, where growth opportunities in the medium term for such services<br />
are limited due to the absence of 3G in those markets. It is worth noting that Oman has recently<br />
announced the launch of 3G business.<br />
Q-Tel consolidated figures<br />
Chart 1 : Q-Tel – consolidated revenue breakdown, 2009<br />
Chart 2 : Q-Tel –consolidated revenue breakdown, 2012F<br />
Total Indosat<br />
27%<br />
Associates<br />
1%<br />
Total Qatar<br />
24%<br />
Total Indosat<br />
26%<br />
Total Qatar<br />
22%<br />
Iraq<br />
17%<br />
Palestine<br />
0%<br />
Maldives<br />
0%<br />
Algeria<br />
7%<br />
Saudi Arabia -<br />
Bravo<br />
1%<br />
Tunisia<br />
5%<br />
Kuwait<br />
11%<br />
Oman<br />
(Nawras)<br />
7%<br />
Iraq<br />
21%<br />
Palestine<br />
2%<br />
Maldives<br />
0%<br />
Algeria<br />
7%<br />
Saudi Arabia -<br />
Bravo<br />
1%<br />
Tunisia<br />
5%<br />
Kuwait<br />
9%<br />
Oman<br />
(Nawras)<br />
7%<br />
Source: Company data<br />
Source: Company data, <strong>Rasmala</strong> forecasts<br />
Chart 3 : Q-Tel – consolidated EBITDA breakdown, 2009<br />
Chart 4 : Q-Tel – consolidated EBITDA breakdown, 2012F<br />
Indosat<br />
25%<br />
Associates<br />
5%<br />
Qatar<br />
27%<br />
Indosat<br />
25%<br />
Qatar<br />
24%<br />
Iraq<br />
17%<br />
Palestine<br />
1%<br />
Maldives<br />
0%<br />
Algeria Tunisia<br />
5% 5%<br />
Saudi Arabia -<br />
Bravo<br />
0%<br />
Kuwait<br />
9%<br />
Oman<br />
6%<br />
Iraq<br />
23%<br />
Palestine<br />
0%<br />
Maldives<br />
0%<br />
Algeria<br />
5%<br />
Tunisia<br />
5%<br />
Saudi Arabia -<br />
Bravo<br />
1%<br />
Kuwait<br />
8%<br />
Oman<br />
9%<br />
Source: Company data<br />
Source: Company data, <strong>Rasmala</strong> forecasts<br />
Leverage<br />
Most of Q-Tel’s debt lies at the holding company level. Most of the debt was incurred to acquire<br />
the initial 51% stake of Wataniya and the Iraqi licence. Q-Tel incurred US$3.4bn in debt to acquire<br />
the 51% stake in Wataniya in March 2007. It was in a net cash position before the acquisition.<br />
Q-Tel | <strong>Investment</strong> View | 12 May 2010 5<br />
74
The parent company refinanced a QR7,283m bank facility on 25 November 2009 through a<br />
forward-start facility maturing in November 2011. Indosat’s net borrowings increased by QR2.7m<br />
as it drew from many of its outstanding facilities to purchase telecommunication equipment.<br />
Also, Q-Tel, through Q-Tel International Finance Limited (QIFL), established a Global Medium-<br />
Term Note (GMTN) programme worth US$5bn in May 2009, which is listed on the London Stock<br />
Exchange. However, the company has only raised US$1.5bn (30% of the total facility) so far in<br />
two series. QIFL is a special purpose entity created for raising funds and has no business or<br />
assets of its own. These GMTNs are unconditionally and irrevocably guaranteed by Q-Tel. The<br />
loan proceeds were used within the group mainly to refinance its existing debt.<br />
Q-Tel’s total interest-bearing loans and borrowings (comprising both short- and long-term<br />
borrowings) increased to QR35,682m in 2009 from QR27,975m in 2008. As a result, its net<br />
debt/EBITDA stood at 1.99x for 2009.<br />
The following are the largest of the borrowings:<br />
! An unsecured US$3bn (QR10,924m) loan facility, fully drawn and set to mature in August<br />
2012. The facility was raised for general corporate purposes.<br />
! An unsecured QR7,280m facility (consisting of US$1.78bn and €146m), fully drawn and<br />
payable in November 2011.<br />
! A US$5bn global, medium-term note listed on the London Stock Exchange and irrevocably<br />
guaranteed by Q-Tel. The loan is provided under the condition that at least a minimum 50.1%<br />
ownership of the company is held by the State of Qatar. From this facility, two instalments<br />
worth US$900m (QR3,277m) maturing in June 2014 and US$600m (QR2,184m) maturing in<br />
June 2019 have been drawn.<br />
Table 4 : GMTN notes issued to date<br />
Issue date Maturity date Amount (US$bn) Interest %pa<br />
Series 1 10-Jun-09 10-Jun-14 (5 years) 0.9 6.5<br />
Series 2 10-Jun-09 10-Jun-19 (10 years) 0.6 7.875<br />
Source: Company filings financials report 2009, <strong>Rasmala</strong><br />
In late April 2010, Qtel announced that it had successfully secured a new US$2bn dual tranche<br />
revolving credit facility. According to Qtel, its original intention was to raise up to US$1.5bn by<br />
approaching its core relationship banks. But due to an extraordinary response Qtel received<br />
commitments to the tune of US$2.75bn, meaning it was 83% oversubscribed. Given this<br />
response, Qtel decided to increase the facility amount to US$2bn and to structure it as follows:<br />
! US$1,250m due in 2013; and<br />
! US$750m due in 2015.<br />
The facility will be used for general corporate purposes including the refinancing of an existing<br />
US$2.0bn forward start facility signed in 2009 which matures in November 2011. (We note that we<br />
have not included this new re-financing arrangement in our forecasts since no details as yet have<br />
been announced regarding the cost of this new refinancing arrangement.)<br />
Future pipeline<br />
Though it has obtained operating licences in Pakistan and the Philippines, Q-Tel has yet to<br />
commence operations. In Oman, it plans to launch WiMAX, telephony, fixed Internet access<br />
services and an international gateway through its subsidiary, Nawras. Management has<br />
expressed optimism on the growth potential for wireless Internet services in Pakistan where Q-Tel<br />
has obtained a WiMAX licence through Wi-Tribe.<br />
Royalty fees discontinued, but 12.5% industry annual fees apply<br />
Q-Tel recently announced that according to a decree issued by the government, its royalty/fee<br />
payable to the government has been reduced with retroactive effect from 7 October 2007. The<br />
earlier royalty of 25% of the company’s net profit has been reduced to 12.5% on profits from the<br />
Qatar operations. In addition, a 1% fee is payable on Q-Tel’s revenue from its domestic<br />
operations from the effective date. That said, we expect a one-time gain of QR554m in FY10 from<br />
the retroactive restatement of reduced royalty fees.<br />
Q-Tel | <strong>Investment</strong> View | 12 May 2010 6<br />
75
Dividends<br />
Q-Tel’s dividend policy is reviewed on an annual basis, however, despite having a 100% payout<br />
based on nominal face value of the share dividend, it was cut to 70% of the nominal face value for<br />
year-end 2009, in consideration of the company’s future growth plans.<br />
Q-Tel | <strong>Investment</strong> View | 12 May 2010 7<br />
76
Q-Tel by market<br />
In this chapter, we describe Qatar Telecom’s major markets of operation and discuss the<br />
key competitive environment and Qatar Telecom’s operational strategy for each market.<br />
Qatar (100% stake)<br />
Qatar is Q-Tel’s second-largest geographic segment in terms of revenue, contributing almost 24%<br />
of overall revenue. Domestic revenue was QR5,686m in 2009, growth of 4% yoy amid stiff<br />
competition from Vodafone Qatar. Q-Tel’s total domestic subscriber base increased to 2.56m in<br />
2009, increasing a healthy 23.2% from 18.0% in 2008. Total mobile subscribers at the end of<br />
2009 reached 2.1m, equivalent to a market share of about 86%.<br />
Chart 5 : Q-Tel – mobile subscribers and market share<br />
Chart 6 : Q-Tel – domestic revenue and EBITDA margin<br />
3.5<br />
120%<br />
8,000<br />
64%<br />
3.0<br />
100%<br />
7,000<br />
62%<br />
2.5<br />
2.0<br />
1.5<br />
1.0<br />
80%<br />
60%<br />
40%<br />
6,000<br />
5,000<br />
4,000<br />
3,000<br />
2,000<br />
60%<br />
58%<br />
56%<br />
54%<br />
52%<br />
0.5<br />
20%<br />
1,000<br />
50%<br />
0.0<br />
2008 2009 2010F 2011F 2012F<br />
0%<br />
0<br />
2008 2009 2010F 2011F 2012F<br />
48%<br />
Qtel mobile subscribers (m) Qtel market share (%)<br />
Qatar revenue (QAR mn)<br />
Qatar EBITDA margin<br />
Source: Company data, <strong>Rasmala</strong> forecasts<br />
Source: Company data, <strong>Rasmala</strong> forecasts<br />
One of our key concerns is Vodafone Qatar’s aggressive pricing, which led to intense price<br />
competition in the fourth quarter of 2009. This led to Q-Tel losing 14% market share to Vodafone<br />
Qatar from the commercial launch of Vodafone Qatar’s operations in March 2009 to the end of<br />
December 2009. However, according to Q-Tel management, most of Vodafone Qatar’s marketshare<br />
gain came from prepaid customers and Q-Tel was marginally able to retain market share in<br />
its post-paid segment. The market share loss in prepaid was mainly due to Vodafone’s cheaper<br />
international call packages. Q-Tel’s management has since been trying to remedy this by offering<br />
bundled services and rate cuts. It is worth mentioning that we have not factored in fixed-line<br />
competition from Vodafone Qatar as it has not given any definite roll-out schedule for its fixed-line<br />
plans.<br />
Valuation<br />
We estimate a value of QR172 per share for Q-Tel’s domestic operations based on a DCF<br />
valuation, which constitutes around 49% of Q-Tel’s total enterprise value.<br />
Oman (56% stake)<br />
Q-Tel secured Oman’s second mobile licence in 2004 and formed a 56%-owned subsidiary called<br />
Nawras Telecom. In 2009, Nawras generated QR1,625m in revenue (7% of group revenue),<br />
growth of 23% yoy supported by annual subscriber growth of 23%. Nawras is the Oman’s secondlargest<br />
player in terms of number of subscribers with a market share of 47% as of end-2009. Also,<br />
in 2009, Nawras was awarded a 25-year license to provide fixed-line, data and international<br />
telecommunication services in Oman with frequency spectrum rights granted for 15 years. Nawras<br />
now offers GSM, WCDMA and mobile broadband services in Oman, with relatively insignificant<br />
revenues from broadband.<br />
Q-Tel | <strong>Investment</strong> View | 12 May 2010 8<br />
77
Chart 7 : Oman – total mobile subscribers and penetration rate<br />
6.0<br />
5.0<br />
4.0<br />
3.0<br />
2.0<br />
1.0<br />
0.0<br />
2003 2004 2005 2006 2007 2008 2009 2010F 2011F 2012F<br />
180%<br />
160%<br />
140%<br />
120%<br />
100%<br />
80%<br />
60%<br />
40%<br />
20%<br />
0%<br />
Oman mobile subscribers (m)<br />
Penetration rate(%)<br />
Source: Company data, ITU, <strong>Rasmala</strong> forecasts<br />
Oman was one of the better markets in 4Q09, with market share remaining stable despite multiple<br />
MVNOs having been launched in 2009. Revenue increased 19% yoy in 2009, including a large<br />
one-off item. Excluding the one-off, 4Q revenue would have increased 8% qoq backed by an<br />
increase in customers and seasonality effects. The reported EBITDA margin for Oman of 64% in<br />
4Q 2009 was also affected by a one-time retrospective catch-up adjustment that reduced the<br />
previous quarter’s interconnect cost. If normalised, EBITDA would have been 53% in 4Q09, driven<br />
by a revenue increase and cost reductions. We expect Q-Tel to launch its fixed network in Oman<br />
sometime in 2010, but we have not factored that into our forecasts due to insufficient information.<br />
Chart 8 : Nawras – subscribers and market share<br />
Chart 9 : Nawras – revenue and EBITDA margin<br />
3.0<br />
46.938%<br />
2,500<br />
60%<br />
2.5<br />
46.937%<br />
46.936%<br />
2,000<br />
50%<br />
2.0<br />
46.935%<br />
46.934%<br />
1,500<br />
40%<br />
1.5<br />
46.933%<br />
30%<br />
1.0<br />
46.932%<br />
46.931%<br />
1,000<br />
20%<br />
0.5<br />
46.930%<br />
46.929%<br />
500<br />
10%<br />
0.0<br />
2008 2009 2010F 2011F 2012F<br />
46.928%<br />
0<br />
2008 2009 2010F 2011F 2012F<br />
0%<br />
Nawras mobile subscribers (m) Nawras market share (%)<br />
Nawras revenue (Qar m)<br />
Nawras EBITDA margin<br />
Source: Company data, <strong>Rasmala</strong> forecasts<br />
Source: Company data, <strong>Rasmala</strong> forecasts<br />
Valuation<br />
Our estimated value of Oman’s operations is QR15 per share based on a DCF valuation and<br />
constitutes around 4% of Q-Tel’s total enterprise value.<br />
Indonesia (65% stake)<br />
Q-Tel acquired a 40.8% stake in PT Indosat Tbk (Indosat), paying US$1.8bn to acquire AMH’s<br />
total interest in Indosat. Indosat is a leading integrated telecommunications and information<br />
services provider in Indonesia. It is also the second-largest mobile phone operator in the country,<br />
with 33mn subscribers as of December 2009 (an estimated market share of 22%). A subsequent<br />
mandatory share purchase offer resulted in a 65% effective stake in Indosat.<br />
The telecoms sector in Indonesia was deregulated in 2000, and with the world’s fourth-largest<br />
population of about 240m inhabitants, Indonesia has substantial potential for growth. However,<br />
the biggest challenge faced by Indonesia’s telecoms infrastructure developers is the country’s<br />
complex geographical structure, which is made up of over 16,000 islands.<br />
Q-Tel | <strong>Investment</strong> View | 12 May 2010 9<br />
78
Chart 10 : Indonesia – total mobile subscribers and penetration rate<br />
250.0<br />
100%<br />
90%<br />
200.0<br />
80%<br />
70%<br />
150.0<br />
60%<br />
50%<br />
100.0<br />
40%<br />
30%<br />
50.0<br />
20%<br />
0.0<br />
2003 2004 2005 2006 2007 2008 2009 2010F 2011F 2012F<br />
10%<br />
0%<br />
Indonesia mobile subscribers (m) Penetration rate (%)<br />
Source: Company data, ITU, <strong>Rasmala</strong> forecasts<br />
Indonesia is Q-Tel’s largest geographic segment in terms of revenue (QR6,579m, contributing<br />
27% to total revenue in 2009). However, Indosat reported a 9% yoy decline in its mobile<br />
subscriber base and a 22% yoy decline in its fixed-line subscriber base on the back of increased<br />
competitive pressure.<br />
Despite increasing competition, Indosat invested the equivalent of 61% of its sales in capex in<br />
2009 compared to 65% in 2008. Most of the capex was directed towards the mobile segment.<br />
In an effort to combat the rising competition in Indonesia, Q-Tel has brought in a new<br />
management team to pursue a value strategy approach for customers while maintaining market<br />
leadership.<br />
Chart 11 : Indosat – subscribers and market share<br />
Chart 12 : Indosat – revenue and EBITDA margin<br />
60<br />
35%<br />
9,000<br />
50.5%<br />
50<br />
40<br />
30<br />
20<br />
10<br />
30%<br />
25%<br />
20%<br />
15%<br />
10%<br />
5%<br />
8,000<br />
7,000<br />
6,000<br />
5,000<br />
4,000<br />
3,000<br />
2,000<br />
1,000<br />
50.0%<br />
49.5%<br />
49.0%<br />
48.5%<br />
48.0%<br />
47.5%<br />
47.0%<br />
46.5%<br />
46.0%<br />
0<br />
2008 2009 2010F 2011F 2012F<br />
0%<br />
0<br />
2008 2009 2010F 2011F 2012F<br />
45.5%<br />
Indosat mobile subscribers (m) Indosat market share (%)<br />
Indosat revenue (QAR m) Indosat Ebitda margin (%)<br />
Source: Company data, <strong>Rasmala</strong> forecasts<br />
Source: Company data, <strong>Rasmala</strong> forecasts<br />
Our main concern is increased competitive pressure, FX volatility and how efficiently the new<br />
management team can turn around the disappointing 2009 results. Indosat reported a decline of<br />
8.2% yoy in consolidated revenue.<br />
Valuation<br />
Our estimated value of Indonesia’s operations is QR70 per share based on a DCF valuation,<br />
which constitutes around 20% of Q-Tel’s total enterprise value.<br />
Q-Tel | <strong>Investment</strong> View | 12 May 2010 10<br />
79
Iraq (49% stake)<br />
In 2007, Q-Tel acquired 49% of Asiacell and won a bid for a 15-year GSM licence in Iraq.<br />
Chart 13 : Iraq total mobile subscribers and penetration rate<br />
30.0<br />
25.0<br />
20.0<br />
15.0<br />
10.0<br />
5.0<br />
0.0<br />
2003 2004 2005 2006 2007 2008 2009 2010F 2011F 2012F<br />
90%<br />
80%<br />
70%<br />
60%<br />
50%<br />
40%<br />
30%<br />
20%<br />
10%<br />
0%<br />
Iraq mobile subscribers (m)<br />
Penetration rate(%)<br />
Source: Company data, ITU, <strong>Rasmala</strong> forecasts<br />
Despite the political uncertainty and security situation in Iraq, we see the Iraqi mobile market as<br />
one of the most promising in the region in the medium-to-long term, with mobile penetration rates<br />
low compared to the region. Asiacell has said that its key focus in Iraq will continue to be network<br />
deployment and continued investment in network infrastructure remains the single most important<br />
element for growth.<br />
Chart 14 : Asiacell – subscribers and market share<br />
Chart 15 : Asiacell – revenue and EBITDA margin<br />
12<br />
40%<br />
7,000<br />
55%<br />
10<br />
39%<br />
6,000<br />
54%<br />
8<br />
6<br />
4<br />
38%<br />
37%<br />
36%<br />
35%<br />
34%<br />
5,000<br />
4,000<br />
3,000<br />
2,000<br />
`<br />
53%<br />
52%<br />
51%<br />
50%<br />
2<br />
33%<br />
1,000<br />
49%<br />
0<br />
2008 2009 2010F 2011F 2012F<br />
32%<br />
0<br />
2008 2009 2010F 2011F 2012F<br />
48%<br />
Asiacell subscribers (m) Asiacell market share (%)<br />
Asiacell revenue (QAR mn)<br />
Asiacell EBITDA margin<br />
Source: Company data, <strong>Rasmala</strong> forecasts<br />
Source: Company data, <strong>Rasmala</strong> forecasts<br />
Asiacell contributed 17% to group revenue in 2009. It also recorded a 20% yoy increase in<br />
subscriber base to 7.35m in 2009.<br />
Valuation<br />
Our estimated value of Iraq’s operations is QR50 per share based on a DCF valuation, which<br />
constitutes around 14% of Q-Tel’s total enterprise value.<br />
Q-Tel | <strong>Investment</strong> View | 12 May 2010 11<br />
80
Kuwait – Wataniya (52.5% stake)<br />
Q-Tel initially acquired a 51% stake in Kuwait-based National Mobile Telecommunications<br />
Company KSC (Wataniya) from Kuwait Projects Company for a total consideration of US$3.8bn.<br />
In March 2007, Q-Tel took control of Wataniya, whose business was spread across seven<br />
countries in the region, namely Tunisia, Algeria, Iraq, Saudi Arabia, the Maldives and Palestine.<br />
Later the company increased its stake to 52.5%.<br />
Valuation<br />
Our estimated value of Wataniya’s operations is QR46.1 per share based on a sum-of-the-partsbased<br />
DCF valuation. It constitutes around 13% of Q-Tel’s total enterprise value. (Refer to our<br />
Wataniya report for more details).<br />
Q-Tel | <strong>Investment</strong> View | 12 May 2010 12<br />
81
Appendix<br />
Figure 1 : Q-Tel’s group structure<br />
Company background<br />
Q-Tel holds a 49% stake in Asiacell, which is consolidated as a subsidiary on the basis of<br />
controlling rights according to the shareholders’ agreement. The ownership is held through<br />
Raywood Incorporation established in the Cayman Islands. Q-Tel has a 65% stake in Indosat of<br />
Indonesia, which was acquired in two stages, first ~40% and then ~25%. Q-Tel acquired a 52.5%<br />
stake in Wataniya (the Kuwait-based National Mobile Telecommunications Company) with an<br />
investment of US$3.8bn. This acquisition paved the way for Q-Tel to enter Kuwait, the Maldives,<br />
Algeria, Saudi Arabia, Tunisia and Palestine. In 2004, Q-Tel secured the second GSM licence<br />
awarded by the Sultanate of Oman and launched its own 56%-controlled subsidiary, Nawras. Q-<br />
Tel has majority control in all its subsidiaries except Asiacell, where it holds a 49% stake.<br />
Q-Tel’s primary business segments include wireless and wireline services; the segments can be<br />
further broken down as follows:<br />
! Mobile telecommunications<br />
! Mobile broadband<br />
! Fixed networks<br />
! Other fixed services (including data)<br />
Source: Company filings, 3Q09 investor presentation, <strong>Rasmala</strong><br />
Company history<br />
In 1998, the state-owned Qatar Public Telecommunications Corporation was renamed Q-Tel and<br />
was listed on the London Stock Exchange in 1999, on the Abu Dhabi Stock Exchange in 2001,<br />
and on the Bahrain Stock Exchange in 2002.<br />
In 2005, Q-Tel and Cisco Systems secured an agreement to build Qatar’s broadband<br />
infrastructure, directly supporting the service needs of the Doha Asian Games and the Doha<br />
International Airport expansion project. In 2006, Q-Tel launched 3G in Qatar with the assistance of<br />
Siemens and Alcatel. In addition, Q-Tel acquired a strategic stake in NavLink along with AT&T<br />
towards the end of 2006 to provide managed data services. In 2007, Q-Tel bid and won a 15-year<br />
Q-Tel | <strong>Investment</strong> View | 12 May 2010 13<br />
82
Figure 2 : Major events by year<br />
GSM licence in Iraq through the Asiacell Consortium and also acquired 51% of Wataniya for<br />
US$3.8bn. In 2007, Q-Tel also signed an MoU with Singapore ST Telemedia for about a 25%<br />
equity stake in Asia Mobile Holdings Pte. Ltd (AMH) for a non-controlling stake in StarHub,<br />
[Singapore's second-largest info-communications company with a customer base of 2 million. In<br />
March 2007, Q-Tel bought over 78% of Wi-Tribe to establish WiMAX networks in the Middle East,<br />
Asia and Africa. In 2008, Wi-Tribe secured a licence in Jordan to access the Jordan market’s<br />
wireless broadband service. It also signed up with Reliance Globalcom to position Qatar as a<br />
major hub for global Internet protocol services (IPS) and acquired a 40.8% controlling stake in PT<br />
Indosat Tbk (Indosat), the second-largest mobile phone operator in Indonesia. In 2009, Q-Tel<br />
signed up with Tata Communications to increase bandwidth by connecting Q-Tel to global hubs<br />
via Tata's global network from a new Gulf-wide undersea cable network. In 2010, Q-Tel<br />
commenced the first phase of its project “Fibre-to-the-Home”, which is to link households across<br />
Qatar with fibre-optical connections over the coming three years.<br />
Major events/milestones<br />
<strong>Investment</strong> in Wi-<br />
Tribe<br />
Launch of wireless<br />
local loop (WLL)<br />
Acquisition of<br />
Asiacell Consortium<br />
<strong>Investment</strong> in<br />
Burraq Telecom<br />
Cable agreement<br />
with Tata<br />
Communications<br />
Qtel and Cisco<br />
Systems -<br />
agreement<br />
Launch of 3G in<br />
Qatar<br />
Acquisition of 51%<br />
in Wataniya<br />
Qtel and Reliance<br />
Globalcom -<br />
agreement<br />
Acquisition of<br />
Liberty Telecom<br />
WiMAX in Jordon<br />
through (Wi-Tribe)<br />
Launch of WiFi<br />
(Qtel hotspot)<br />
service<br />
Equity state in<br />
NavLink<br />
MoU with<br />
Singapore' s ST<br />
Telemedia<br />
Qtel’s acquisition of<br />
a 40.8% stake in<br />
Indosat<br />
Mandatory share<br />
offer in Indosat<br />
Fibre-to-the-home<br />
2005 2006 2007 2008 2009 2010<br />
Source: Company filings, <strong>Rasmala</strong>, www.arabianbusiness.com<br />
2005<br />
! Launch of wireless local loop (WLL): In 2005, Q-Tel launched remote locations services or<br />
WLL, providing immediate access to customer markets without having to either lay cables or<br />
work through networks.<br />
! Agreement between Q-Tel and Cisco Systems: In 2005, the two institutions cemented a<br />
long-term partnership to build 'Broadband Country' at gigabit speed. In Qatar, Cisco is to<br />
implement state-of-the-art, converged IP infrastructure supporting Q-Tel’s strategy of<br />
implementing a country-wide broadband structure servicing the needs of Q-Tel’s major clients<br />
and partners. This includes the Qatar Foundation, the Doha Asian Games, and the Doha<br />
International Airport expansion project.<br />
! Launch of WiFi (Q-Tel hotspot) service: Q-Tel’s hotspot service was launched in 2005 and<br />
is based on wireless fidelity (WiFi) technology, ie, the current technology for mobile<br />
computing.<br />
2006<br />
! Launch of 3G in Qatar: In 2006, Q-Tel launched a 3G dedicated network in Qatar, enabling<br />
customers with 3G-enabled handsets to conduct video calls. The launch was assisted by<br />
Siemens and Alcatel.<br />
! Equity state in NavLink: In November 2006, Q-Tel signed an agreement with AT&T Inc. to<br />
acquire a strategic equity stake in NavLink, a provider of managed data services, managed<br />
hosting services and managed enterprise networking solutions, to medium and large<br />
enterprises in over 17 countries throughout Europe, the Middle East and Africa (EMEA). Q-Tel<br />
and AT&T Inc hold a 38.2% equity stake each in the business.<br />
Q-Tel | <strong>Investment</strong> View | 12 May 2010 14<br />
83
2007<br />
! Asiacell Consortium: Q-Tel was part of the Asiacell Consortium that secured a GSM licence<br />
in Iraq in 2007. The other partners were Asiacell Iraq, one of Iraq's leading<br />
telecommunications operators, and Merchant Bridge, a leading investment bank with<br />
extensive activities in the MENA region and Europe. The purchase consideration is<br />
US$1.25bn for a 15-year GSM licence. Iraqi nationals hold the majority stake (51%) in the<br />
consortium.<br />
! Acquisition of 51% of Wataniya: In 2007, Q-Tel bought a 51% stake in Kuwait-based<br />
National Mobile Telecommunications Company KSC (Wataniya) from Kuwait Projects<br />
Company for a total cash consideration of US$3.8bn. Later the company increased its stake to<br />
52.5%.<br />
! MoU with Singapore Technologies Telemedia Pte Ltd (ST Telemedia): In 2007, Q-Tel<br />
signed an agreement with ST Telemedia, an information-communications company with<br />
operations in the Asia-Pacific region. Through this agreement, Q-Tel invested US$635m in<br />
cash for about a 25% equity stake in Asia Mobile Holdings Pte. Ltd (AMH), with ST Telemedia<br />
being the controlling shareholder of the remaining 75%. AMH holds ST Telemedia's stakes in<br />
StarHub Ltd, Singapore's second-largest info-communications company (with 2 million<br />
customers), and PT Indosat Tbk, Indonesia's second-largest operator (with over 14 million<br />
mobile subscribers). AMH operates in Singapore, Laos and Cambodia through StarHub, LTC,<br />
and Shinawatra.<br />
! <strong>Investment</strong> in Wi-Tribe, 78%: In March 2007, Q-Tel entered into a joint venture with ATCO, a<br />
leading Middle Eastern conglomerate, and Clearwire International, one of the world's leading<br />
wireless broadband services providers. The venture aims to establish WiMAX networks in the<br />
Middle East, Asia and Africa. In Jordan, Wi-Tribe secured a licence in 2008 to access the<br />
Jordan market’s wireless broadband service.<br />
2008<br />
! Agreement between Q-Tel and Reliance Globalcom: Signed in 2008, the agreement aims<br />
to position Qatar as a major hub for global Internet protocol services (IPS), including global<br />
ethernet and customised support for international enterprises. The two companies will<br />
interconnect networks to provide a range of managed services for Qatar-based and<br />
international clients. Q-Tel and Reliance Globalcom will be able to offer a comprehensive<br />
range of value-added services, including global ethernet, full-circuit international private<br />
leased circuit (IPLC), managed services and Internet protocol for virtual private networks (IP<br />
VPN) to customers in Qatar and internationally. Reliance Globalcom owns the world’s largest<br />
private undersea cable system spanning 65,000km and connecting key business markets in<br />
India, the Middle East, Asia, Europe and the United States, including its FLAG Europe-Asia<br />
cable.<br />
! Q-Tel’s acquisition of a 40.8% controlling stake in PT Indosat Tbk (Indosat): Q-Tel paid<br />
US$1.8bn to acquire AMH’s total interest in Indosat in 2008. Indosat is a leading integrated<br />
telecommunications and information services provider in Indonesia and is the second-largest<br />
mobile phone operator in Indonesia.<br />
! <strong>Investment</strong> in Burraq Telecom: In 2008, Q-Tel acquired a 75% stake in Burraq Telecom in<br />
Pakistan through Wi-Tribe, which has licences for WiMAX.<br />
2009<br />
! Cable agreement with Tata Communications: Q-Tel signed an agreement with Tata<br />
Communications to increase bandwidth by connecting Q-Tel to global hubs via Tata's global<br />
network from a new Gulf-wide undersea cable network. The total length of the cable system<br />
within the Gulf region will stretch about 4,469km from Mumbai to Kuwait. The segment will<br />
connect to Tata's global cable and backhaul network, which is one of the largest in the world.<br />
When completed, the cable will enable at least 1.28Tbit/s of additional international<br />
connectivity in the region.<br />
! Mandatory share offer increases stake in Indosat: Q-Tel’s acquisition of a 40.8% stake in<br />
Indosat triggered the mandatory share purchase offer (completed in 2009) resulting in an<br />
effective stake of 65% in Indosat.<br />
! Liberty Telecom: Q-Tel acquired a 33% stake in Liberty Telecommunications Holdings in<br />
August 2009 for a consideration of USD29m. Its total shareholding at present is at 40%.<br />
Q-Tel | <strong>Investment</strong> View | 12 May 2010 15<br />
84
2010<br />
! Fibre-to-the-Home: In March 2010, after investing QR600m, Q-Tel announced the launch of<br />
the first phase of its Fibre-to-the-Home (FTTH) service. Q-Tel aims to link households across<br />
Qatar with fibre-optical connections over the coming three years.<br />
! WiMAX services in the region: In June 2008, Q-Tel started deploying WiMAX services in the<br />
region through the Wi-Tribe Group. Wi-Tribe launched wireless broadband Internet services in<br />
Jordan.<br />
M&A history<br />
! Nawras (56% stake): In 2004, Q-Tel led a consortium to secure the second mobile licence in<br />
Oman, and commenced services in March 2005.<br />
! NavLink (38% stake): In November 2006, Q-Tel signed an agreement with AT&T Inc. to<br />
acquire a 38% stake in NavLink, which provides managed data services to businesses in the<br />
Middle East.<br />
! Asiacell (49% stake): In 2007, Q-Tel acquired 49% of Asiacell and made a successful bid for<br />
a 15-year GSM licence in Iraq.<br />
! Wataniya (51% stake): Q-Tel acquired a 51% stake in Kuwait-based National Mobile<br />
Telecommunications Company KSC (Wataniya) from Kuwait Projects Company for a total<br />
consideration of US$3.8bn. From March 2007, Q-Tel took control of Wataniya, whose<br />
business is spread across seven countries in the region, namely Tunisia, Algeria, Iraq, Saudi<br />
Arabia, the Maldives and Palestine.<br />
! Asia Mobile (25% stake): In 2007, it acquired a 25% equity stake in Asia Mobile Holdings<br />
Pte. Ltd (AMH). AMH operates in Singapore, Laos, and Cambodia through StarHub, LTC, and<br />
Shinawatra.<br />
! Wi-Tribe (78% stake): In March 2007, Q-Tel entered into a regional broadband wireless joint<br />
venture with ATCO, a leading Middle Eastern conglomerate, and Clearwire International, one<br />
of the world's leading wireless broadband services providers to set up Wi-Tribe. The venture<br />
commenced operations in the beginning of 2008 to establish WiMAX networks in the Middle<br />
East, Asia, and Africa. Q-Tel has a 78% stake in this venture. In 2008, Wi-Tribe secured a<br />
licence to set up wireless broadband in Jordan.<br />
! Burraq Telecom (75% stake): In 2008, Wi-Tribe acquired a 75% stake in Burraq Telecom in<br />
Pakistan, which has licences for WiMAX. Broadband penetration levels are very low in<br />
Pakistan and thus offer substantial growth potential.<br />
! Indosat (65% stake): Q-Tel acquired a 40.8% stake in PT Indosat Tbk (Indosat) by paying<br />
US$1.8bn to acquire AMH’s total interest in Indosat. Indosat is a leading integrated<br />
telecommunications and information services provider in Indonesia. It is also the secondlargest<br />
mobile phone operator in Indonesia with 26.4m subscribers as of 31 March 2008 (a<br />
market share of about 28%). A subsequent mandatory share purchase offer resulted in a 65%<br />
effective stake in Indosat.<br />
! Liberty Telecom (40% stake): Q-Tel acquired a 33% stake in Liberty Telecommunications in<br />
August 2009 for a consideration of US$29m. Its total shareholding at present is 40%.<br />
Q-Tel | <strong>Investment</strong> View | 12 May 2010 16<br />
85
Income statement<br />
QRm FY08A FY09A FY10F FY11F FY12F<br />
Revenue 20319 24025 26687 28808 31013<br />
Cost of sales -5429 -5949 -6096 -6713 -7030<br />
Operating costs -4726 -5952 -7008 -7421 -7989<br />
EBITDA 10164 12124 13583 14674 15994<br />
DDA & Impairment (ex gw) -3982 -5490 -6575 -7277 -7794<br />
EBITA 6182 6634 7007 7396 8200<br />
Goodwill (amort/impaired) 0.00 0.00 0.00 0.00 0.00<br />
EBIT 6182 6634 7007 7396 8200<br />
Net interest -1596 -1945 -2031 -1698 -1376<br />
Associates (pre-tax) 0.00 0.00 0.00 0.00 0.00<br />
Other pre-tax items -443.5 563.3 0.00 0.00 0.00<br />
Reported PTP 4143 5252 4976 5698 6823<br />
Taxation -1026 -1010 -1041 -1208 -1387<br />
Minority interests -621.8 -1101 -1064 -1532 -1877<br />
Other post-tax items -188.1 -361.0 -11.0 0.00 0.00<br />
Reported net profit 2306 2780 2860 2958 3559<br />
Tot normalised items 0.00 0.00 0.00 0.00 0.00<br />
Normalised EBITDA 10164 12124 13583 14674 15994<br />
Normalised PTP 4143 5252 4976 5698 6823<br />
Normalised net profit 2306 2780 2860 2958 3559<br />
Source: Company data, <strong>Rasmala</strong> Research forecasts<br />
year to Dec<br />
Balance sheet<br />
QRm FY08A FY09A FY10F FY11F FY12F<br />
Cash & market secs (1) 7845 11512 13191 18435 17237<br />
Other current assets 4135 4454 4754 5154 5500<br />
Tangible fixed assets 23352 29598 33098 33671 32603<br />
Intang assets (incl gw) 32671 34104 32110 29893 27507<br />
Oth non-curr assets 5147 5271 5368 5470 5578<br />
Total assets 73150 84939 88520 92624 88425<br />
Short term debt (2) 0.00 0.00 0.00 0.00 0.00<br />
Trade & oth current liab 20774 16051 14703 24249 28422<br />
Long term debt (3) 20155 33798 35412 26472 13879<br />
Oth non-current liab 5282 5657 5757 5857 5957<br />
Total liabilities 46212 55506 55871 56578 48257<br />
Total equity (incl min) 26938 29432 32649 36046 40167<br />
Total liab & sh equity 73150 84939 88520 92624 88425<br />
Net debt 20130 24171 22221 16977 9235<br />
Source: Company data, <strong>Rasmala</strong> Research forecasts<br />
year ended Dec<br />
Cash flow statement<br />
QRm FY08A FY09A FY10F FY11F FY12F<br />
EBITDA 10164 12124 13583 14674 15994<br />
Change in working capital -1571 439.0 236.0 206.8 173.1<br />
Net interest (pd) / rec -1459 -1481 -2031 -1698 -1376<br />
Taxes paid -50.4 -836.0 -487.4 -1208 -1387<br />
Other oper cash items -1486 -277.5 -11.0 0.00 0.00<br />
Cash flow from ops (1) 5598 9968 11289 11974 13403<br />
Capex (2) -5663 -8393 -8081 -5634 -4340<br />
Disposals/(acquisitions) 0.00 0.00 0.00 0.00 0.00<br />
Other investing cash flow -3435 -3672 0.00 0.00 0.00<br />
Cash flow from invest (3) -9098 -12065 -8081 -5634 -4340<br />
Incr / (decr) in equity 0.00 0.00 0.00 0.00 0.00<br />
Incr / (decr) in debt 0.00 0.00 0.00 0.00 0.00<br />
Ordinary dividend paid -347.0 -865.7 -1261 -1092 -1314<br />
Preferred dividends (4) 0.00 0.00 0.00 0.00 0.00<br />
Other financing cash flow 8807 7344 -268.5 -2.36 -8947<br />
Cash flow from fin (5) 8460 6478 -1529 -1095 -10262<br />
Forex & disc ops (6) -364.5 -715.5 0.00 0.00 0.00<br />
Inc/(decr) cash (1+3+5+6) 4595 3666 1679 5245 -1199<br />
Equity FCF (1+2+4) -65.5 1575 3208 6339 9063<br />
Source: Company data, <strong>Rasmala</strong> Research forecasts<br />
year to Dec<br />
Q-Tel | Key Financial Data | 12 May 2010<br />
86
Equity | Qatar | Telecommunications<br />
12 May 2010<br />
Initiation of coverage<br />
Hold<br />
Target price<br />
QR9.54<br />
Price<br />
QR9.50<br />
Short term (0-60 days)<br />
n/a<br />
Market view<br />
No Weighting<br />
Price performance<br />
(1M) (3M) (12M)<br />
Price (QR) 8.25 7.80 n/a<br />
Absolute (%) 15.2 21.8 n/a<br />
Rel market (%) 19.9 13.3 n/a<br />
Rel sector (%) 21.7 19.2 n/a<br />
Jul 09 Oct 09 Feb 10<br />
14<br />
12<br />
10<br />
8<br />
6<br />
VFQS.QA<br />
Market capitalisation<br />
QR8.03bn (€23.04bn)<br />
Average (12M) daily turnover<br />
QR13.15m<br />
Sector: QE Industries Index<br />
RIC: VFQS.QA, VFQS QD<br />
Priced QR9.50 at close 6 May 2010.<br />
Source: Bloomberg<br />
QE Index<br />
Vodafone Qatar<br />
Monopoly break<br />
We initiate on Vodafone Qatar with a Hold rating and 12-month target price of<br />
QR9.54 per share. To arrive at our target price, we have used a three-stage DCF<br />
model because the company is still in its start-up phase of operations.<br />
Key forecasts<br />
FY09A FY10F FY11F FY12F<br />
Revenue (QRm) 0.03 404.1 1,147 1,455<br />
EBITDA (QRm) -124.7 -262.7 172.1 436.5<br />
Reported net profit (QRm) -132.9 -1,039 -603.6 -273.6<br />
Normalised net profit (QRm) -132.9 -1,039 -603.6 -273.6<br />
Normalised EPS (QR) 0.16 -1.23 0.71 0.32<br />
Dividend per share (QR) 0 0 0 0<br />
Dividend yield (%) 0 0 0 0<br />
Normalised PE (x) n/m n/m n/m n/m<br />
EV/EBITDA (x) n/m n/m 52.7 20.3<br />
EV/invested capital (x) 1 1.13 1.22 1.28<br />
ROIC - WACC (%) 0 0 0 0<br />
Accounting standard: IAS<br />
Source: Company data, <strong>Rasmala</strong> Research forecasts<br />
Capitalise on Vodafone Group relationship<br />
year to Mar, fully diluted<br />
In our view, Vodafone Qatar’s main edge is its close affiliation with Vodafone Group, as the<br />
company could capitalise on this relationship on a number of fronts, including international<br />
roaming agreements, network purchasing and its global brand to mention a few.<br />
Substantial growth in the data segment<br />
Based on our investment case, which stresses the importance of high-speed data services,<br />
we see substantial potential for Qatar Telecom to capitalise on this segment. According to<br />
management, it has several markets that have extensive data business and substantial<br />
revenue potential (including Qatar, Kuwait, and Indonesia) where subscribers rely heavily on<br />
HSPA and Blackberry.<br />
We initiate coverage of Vodafone Qatar with a Hold rating<br />
We initiate coverage of Vodafone Qatar with a Hold rating and 12-month target price of<br />
QR9.54 per share. To arrive at our target price, we have used a three-stage DCF model<br />
because the company is still in its start-up phase of operations.<br />
Analyst<br />
Shrouk Diab<br />
+20 1 9991 6882<br />
shrouk.diab@rasmala.com<br />
Dubai International Financial Centre,<br />
The Gate Village, Building 10, Level 1,<br />
P.O. Box 31145, Dubai, United Arab<br />
Emirates<br />
www.rasmala.com<br />
Important disclosures can be found in the Disclosures Appendix.<br />
Distributed outside MENA by The Royal <strong>Bank</strong> of Scotland N.V. and its affiliates under a strategic<br />
alliance with <strong>Rasmala</strong> <strong>Investment</strong> <strong>Bank</strong> Ltd.
<strong>Investment</strong> view<br />
We initiate coverage of Vodafone Qatar with a Hold rating and 12-month target price of<br />
QR9.54 per share. To arrive at our target price, we have used a three-stage DCF model<br />
because the company is still in its start-up phase of operations.<br />
Capitalise on Vodafone Group<br />
relationship<br />
Value-added services are key<br />
Competition will start to become<br />
more aggressive<br />
Target market share >30% by<br />
2012<br />
Vodafone Qatar will be able to capitalise on several levels from its strong affiliation with Vodafone<br />
Group, including international roaming agreements, network purchasing, billing platforms and<br />
handset purchasing, to mention a few.<br />
As we have witnessed in the GCC region in particular, with mobile penetration rates exceeding<br />
100%, high-speed data provision has been key for operators’ growth. That being noted, we<br />
believe that Vodafone Qatar’s future growth would depend on its ability to capture high-net-worth<br />
subscribers and provide them with high-speed data services, while maintaining operational cost<br />
efficiencies.<br />
We believe that Qatar Telecom, despite capturing a healthy 14% market share in its first nine<br />
months of operations, will begin to compete more aggressively in the Qatari market, seeing that<br />
Qatar represents the second-largest revenue portion of its overall revenues. That noted, we<br />
believe that anticipated competition in the market would bring both ARPUs and EBITDA margins<br />
under pressure.<br />
Vodafone Qatar expects to exceed 30% market share by March 2012 and exceed 40% by March<br />
2018. In our view, we believe that it may be feasible for Vodafone Qatar to achieve these targets;<br />
however, usage stimulation is key for the numbers to make an impact.<br />
Valuation summary<br />
We initiate coverage of Vodafone Qatar with a Hold rating and 12-month target price of QR9.54<br />
per share. To arrive at our target price, we have used a three-stage DCF model because the<br />
company is still in its start-up phase of operations.<br />
Discounted cash flow<br />
Our DCF valuation of Vodafone Qatar implies a 12-month fair value of QR9.54 per share, close to<br />
its current price of QR9.50 per share. The assumptions underlying our valuation are an 11.50%<br />
cost of equity, based on a risk-free rate of 5.50% and an equity-risk premium of 6.00%. We also<br />
use 2.5% terminal growth, a WACC of 11.5%, a 10.0% cost of debt and beta of 1x.<br />
Table 1 : Three-stage DCF valuation<br />
(QR m) Free cash flow PV of FCF<br />
2010 -784 -766<br />
2011 -140 -129<br />
2012 250 206<br />
2013 698 515<br />
2014 847 559<br />
2015 963 570<br />
2016-21 (WACC: 11.5%. Five-year growth: 4.5%) 2,742<br />
Terminal value 4,399<br />
Enterprise value 8,096<br />
Minus: net debt 35<br />
Equity value 8,061<br />
Number of shares (m) 845<br />
12-month fair value per share (QR) 9.54<br />
Source: Company data, <strong>Rasmala</strong> forecasts<br />
Vodafone Qatar | <strong>Investment</strong> View | 12 May 2010 2<br />
88
We have also supplied a sensitivity analysis, employing different rates for both the cost of equity<br />
and terminal growth rate, to illustrate how sensitive our DCF target price is to changes in these<br />
assumptions.<br />
Table 2 : DCF sensitivity analysis (value per share QR)<br />
Terminal growth rate<br />
Cost of equity<br />
9.5% 10.5% 11.5% 12.5% 13.5%<br />
0.5% 11.19 9.71 8.51 7.51 6.68<br />
1.5% 12.04 10.33 8.97 7.87 6.96<br />
2.5% 13.13 11.10 9.54 8.29 7.28<br />
3.5% 14.57 12.09 10.24 8.81 7.67<br />
4.5% 16.60 13.42 11.15 9.46 8.14<br />
Source: <strong>Rasmala</strong> estimates<br />
Risks to central scenario<br />
Our main concern stems from the risk of increased pricing competition in Qatar. Vodafone Qatar<br />
launched operations in the Qatari market by utilising aggressive pricing schemes, particularly for<br />
international calls. We do not believe Qatar Telecom will stand idle, particularly as the Qatari<br />
market is the second-largest revenue contributor among its subsidiary operations.<br />
Another concern is that the company still needs to make efforts to stimulate customer usage,<br />
despite Vodafone Qatar’s strong start in the Qatari market. In other words, if usage is not<br />
stimulated by VFQ’s subscriber base, its market share would not mean much.<br />
Finally is the risk of Vodafone Qatar not being able to capitalise on all of the potential synergies<br />
that exist between itself and Vodafone Group, as the main edge for VFQ, in our opinion, is its<br />
strong relationship with Vodafone Group.<br />
Vodafone Qatar | <strong>Investment</strong> View | 12 May 2010 3<br />
89
Company dynamics<br />
Vodafone Qatar’s entry marked the end of Qatar Telecom’s monopoly on mobile services<br />
in Qatar. Vodafone Qatar intends to build its subscriber base through churn from Qatar<br />
Telecom’s subscriber base and new market subscriber additions.<br />
Market strategy<br />
Vodafone Qatar’s strategy for entering the Qatari market was not based on new subscriber<br />
additions alone. Considering that Vodafone Qatar is the second entrant to a market in which lack<br />
of choice was the norm, it should be able to capitalise on churn.<br />
Furthermore, Vodafone Qatar initiated its launch in the Qatari market with a postpaid scheme,<br />
targeting potential high-net-worth subscribers, tackling what it interpreted as a lack of customer<br />
service for this important segment.<br />
In September 2009, Vodafone Qatar launched its prepay product services, which contributed to<br />
rapidly build up its subscriber base, enabling it to capture almost 45% of total net subscriber<br />
additions for the full 2009 calendar year.<br />
Chart 1 : Qatar total mobile subscribers and penetration rate<br />
5.0<br />
4.0<br />
3.0<br />
2.0<br />
1.0<br />
0.0<br />
2003a 2004a 2005a 2006a 2007a 2008a 2009a 2010e 2011f 2012f<br />
`<br />
200%<br />
150%<br />
100%<br />
50%<br />
0%<br />
Qatar mobile subscribers (m) Penetration rate (%)<br />
Source: Company data, ictQatar, ITU, <strong>Rasmala</strong><br />
Chart 2 : Vodafone Qatar total mobile subscribers and markets share<br />
1.4<br />
1.2<br />
1.0<br />
0.8<br />
0.6<br />
0.4<br />
0.2<br />
0.0<br />
2008A 2009A 2010F 2011F 2012F<br />
`<br />
35%<br />
30%<br />
25%<br />
20%<br />
15%<br />
10%<br />
5%<br />
0%<br />
VFQ mobile subscribers (m) VFQ market share (%)<br />
Source: Company data, <strong>Rasmala</strong> forecasts<br />
During the third fiscal quarter of 2010, Vodafone Qatar’s international calling promotions made a<br />
significant impact because at the time, Qatar Telecom’s international rates were almost double<br />
what Vodafone Qatar was offering. Customers made heavy use of international calling<br />
promotions, making over 70m minutes of international calls during November. Additionally,<br />
Vodafone Qatar's ongoing promotion of up to 300 MB of free mobile Internet per month prompted<br />
over 40% of Vodafone's customers to make active use of this service, one of the highest<br />
concentrations in the Vodafone Group globally, according to management.<br />
Vodafone Qatar | <strong>Investment</strong> View | 12 May 2010 4<br />
90
For high-speed data services, Vodafone Qatar intends to provide data communications such as<br />
SMS and MMS, as well as 3G services such as mobile e-mail, broadband Internet access, mobile<br />
television, music downloads and video calling. Data schemes are intended to target businesses<br />
as well as consumers. Vodafone Qatar expects prices to come down in the market, which should<br />
stimulate usage.<br />
Competition<br />
Currently, Vodafone Qatar’s only competitor is the incumbent, Qatar Telecom. Considering that<br />
Qatar, as a market, represents the second-largest revenue contribution to Qatar Telecom’s total<br />
revenues (about 24% of overall revenues as of year-end 2009), we expect Qatar Telecom to<br />
defend its market share more aggressively in the coming period, particularly since Vodafone<br />
Qatar has captured 14% market share from it in less than one year of operations.<br />
Qatar Telecom has the lead advantage over Vodafone Qatar in the sense that it has an<br />
established network infrastructure and is already a fully fledged integrated telecommunications<br />
service provider that can benefit from the provision of triple- and quad-play services to its<br />
customer base.<br />
Chart 3 : Vodafone Qatar revenue and growth<br />
Chart 4 : Vodafone Qatar EBITDA and EBITDA margin<br />
1,600<br />
1,400<br />
1,200<br />
1,000<br />
800<br />
600<br />
400<br />
200<br />
0<br />
2008A 2009A 2010F 2011F 2012F<br />
`<br />
200%<br />
150%<br />
100%<br />
50%<br />
0%<br />
500<br />
400<br />
300<br />
200<br />
100<br />
0<br />
-100<br />
-200<br />
-300<br />
`<br />
2008A 2009A 2010F 2011F 2012F<br />
VFQ EBITDA (QAR m)<br />
VFQ EBITDA margin<br />
40%<br />
20%<br />
0%<br />
-20%<br />
-40%<br />
-60%<br />
-80%<br />
VFQ revenue (QAR m) Revenue growth (%)<br />
Source: Company data, <strong>Rasmala</strong> forecasts<br />
Source: Company data, <strong>Rasmala</strong> forecasts<br />
That noted, we expect Qatar Telecom to start redirecting its focus to the domestic market and to<br />
counter Vodafone Qatar in terms of both pricing and possibly increased value-added service<br />
offerings. That being said, we expect margins may come under pressure for both operators in the<br />
short to medium term, as respective market shares’ start stabilising.<br />
Vodafone Qatar | <strong>Investment</strong> View | 12 May 2010 5<br />
91
Second fixed-line licence<br />
In September 2008, a consortium including Vodafone Group and Qatar Foundation was<br />
announced as the winning applicant of the second fixed line licence. Due to the terms of the fixed<br />
licence relating to the ownership structure of the company that will be awarded the fixed licence,<br />
the second fixed licence will be held by a company legally separate from Vodafone Qatar.<br />
Chart 5 : Qatar total fixed-line subscribers and penetration rate<br />
0.4<br />
0.3<br />
0.3<br />
0.2<br />
0.2<br />
0.1<br />
0.1<br />
0.0<br />
2003a 2004a 2005a 2006a 2007a 2008a 2009a 2010e 2011f 2012f<br />
`<br />
30%<br />
25%<br />
20%<br />
15%<br />
10%<br />
5%<br />
0%<br />
Qatar fixed subscribers (m) Penetration rate (%)<br />
Source: Company data, ictQatar, ITU, <strong>Rasmala</strong><br />
That being the case, increased debt to fund the network deployment of the second fixed line<br />
licence shall not be raised by Vodafone Qatar, ie it will be raised by the separate legal entity.<br />
Therefore, for its business model – which assumes no regional or fixed line expansion – through<br />
direct ownership, Vodafone Qatar is assuming minimal requirement to use debt.<br />
However, Vodafone Group and Qatar Foundation intend to maximise the cost synergies and<br />
customer benefits between Vodafone Qatar and the company that will hold the second fixed<br />
licence, through delivering converged communications services in Qatar. This will include, among<br />
other synergies, the following:<br />
! the use of the Vodafone brand;<br />
! shared cost centres, such as shared management, marketing, finance, human resources,<br />
legal and sale teams;<br />
! shared distribution networks;<br />
! a shared customer care centre; and<br />
! shared network infrastructure.<br />
Dividends<br />
Based on Vodafone Qatar’s business plan and given that Vodafone Qatar is still in its growth<br />
stage, we are not assuming the distribution of dividends throughout our forecast period.<br />
Vodafone Qatar | <strong>Investment</strong> View | 12 May 2010 6<br />
92
Appendix<br />
Company overview<br />
Vodafone Qatar was fully incorporated as a Qatari shareholding company on 22 June 2008.<br />
Shortly after, on 28 June 2008, Vodafone Qatar was awarded with its public mobile networks and<br />
services licence in the State of Qatar.<br />
The Vodafone network became operational in March 2009, and in that same month, it reached<br />
1,000 subscribers, offering services to a limited range of customers (beta testers).<br />
In May 2009, Vodafone Qatar raised 40% of its share capital (Vodafone Group and The Qatar<br />
Foundation consortium hold 45%, while other Qatari institutional investors hold the remaining<br />
15%) by means of an IPO. The IPO was only available to Qatari investors (individual and<br />
institutional) and at that time, it was the largest IPO in history, raising US$950m.<br />
Services to the general public were launched in July 2009, with the introduction of the Vodafone<br />
Qatar online store, the opening of its first retail stores and the start of the “freedom” plans.<br />
Vodafone’s prepaid plans were launched in September 2009.<br />
Since then, Vodafone has successfully implemented its 2G and 3G networks (2G geographic<br />
coverage already at 100%); as of 31 December 2009, it held a growing subscriber base of c<br />
350,000 (150,000 in the previous quarter), resulting in a market share of 14% (7% in the previous<br />
quarter).<br />
In March 2010, Vodafone Qatar was awarded with the country’s second public fixed networks and<br />
services licence.<br />
Vodafone Qatar | <strong>Investment</strong> View | 12 May 2010 7<br />
93
Income statement<br />
QRm FY09A FY10F FY11F FY12F<br />
Revenue 0.03 404.1 1147 1455<br />
Cost of sales -0.03 -242.4 -459.0 -509.2<br />
Operating costs -124.7 -424.3 -516.4 -509.2<br />
EBITDA -124.7 -262.7 172.1 436.5<br />
DDA & Impairment (ex gw) 0.00 -749.5 -730.0 -676.8<br />
EBITA -124.7 -1012 -557.9 -240.3<br />
Goodwill (amort/impaired) 0.00 0.00 0.00 0.00<br />
EBIT -124.7 -1012 -557.9 -240.3<br />
Net interest -8.23 -26.8 -45.7 -33.3<br />
Associates (pre-tax) 0.00 0.00 0.00 0.00<br />
Other pre-tax items 0.00 0.00 0.00 0.00<br />
Reported PTP -132.9 -1039 -603.6 -273.6<br />
Taxation 0.00 0.00 0.00 0.00<br />
Minority interests 0.00 0.00 0.00 0.00<br />
Other post-tax items 0.00 0.00 0.00 0.00<br />
Reported net profit -132.9 -1039 -603.6 -273.6<br />
Tot normalised items 0.00 0.00 0.00 0.00<br />
Normalised EBITDA -124.7 -262.7 172.1 436.5<br />
Normalised PTP -132.9 -1039 -603.6 -273.6<br />
Normalised net profit -132.9 -1039 -603.6 -273.6<br />
Source: Company data, <strong>Rasmala</strong> Research forecasts<br />
year to Mar<br />
Balance sheet<br />
QRm FY09A FY10F FY11F FY12F<br />
Cash & market secs (1) 0.55 0.85 1.10 1.15<br />
Other current assets 35.8 140.6 343.9 469.4<br />
Tangible fixed assets 388.5 671.4 671.4 671.4<br />
Intang assets (incl gw) 7716 7330 6944 6559<br />
Oth non-curr assets 0.00 0.00 0.00 0.00<br />
Total assets 8141 8143 7961 7701<br />
Short term debt (2) 35.0 441.7 763.0 681.5<br />
Trade & oth current liab 79.4 444.4 679.4 909.4<br />
Long term debt (3) 0.00 270.0 135.0 0.00<br />
Oth non-current liab 0.64 0.00 0.00 0.00<br />
Total liabilities 115.0 1156 1577 1591<br />
Total equity (incl min) 8026 6987 6383 6110<br />
Total liab & sh equity 8141 8143 7961 7701<br />
Net debt 34.4 845.8 1032 815.3<br />
Source: Company data, <strong>Rasmala</strong> Research forecasts<br />
year ended Mar<br />
Cash flow statement<br />
QRm FY09A FY10F FY11F FY12F<br />
EBITDA -124.7 -262.7 172.1 436.5<br />
Change in working capital 43.6 125.2 31.7 104.5<br />
Net interest (pd) / rec -8.23 -26.8 -45.7 -33.3<br />
Taxes paid 0.00 0.00 0.00 0.00<br />
Other oper cash items 0.00 0.00 0.00 0.00<br />
Cash flow from ops (1) -89.4 -164.2 158.1 507.6<br />
Capex (2) -388.5 -646.5 -344.2 -291.0<br />
Disposals/(acquisitions) 0.00 0.00 0.00 0.00<br />
Other investing cash flow 0.00 0.00 0.00 0.00<br />
Cash flow from invest (3) -388.5 -646.5 -344.2 -291.0<br />
Incr / (decr) in equity -8159 0.00 0.00 0.00<br />
Incr / (decr) in debt 0.00 0.00 0.00 0.00<br />
Ordinary dividend paid 0.00 0.00 0.00 0.00<br />
Preferred dividends (4) 0.00 0.00 0.00 0.00<br />
Other financing cash flow 35.6 811.0 186.3 -216.6<br />
Cash flow from fin (5) -8123 811.0 186.3 -216.6<br />
Forex & disc ops (6) 0.00 0.00 0.00 0.00<br />
Inc/(decr) cash (1+3+5+6) -8601 0.30 0.25 0.05<br />
Equity FCF (1+2+4) -477.9 -810.7 -186.1 216.6<br />
Source: Company data, <strong>Rasmala</strong> Research forecasts<br />
year to Mar<br />
Vodafone Qatar | Key Financial Data | 12 May 2010<br />
94
Equity | Saudi Arabia | Mobile Telcos<br />
12 May 2010<br />
Initiation of coverage<br />
Buy<br />
Target price<br />
SR75.36<br />
Price<br />
SR50.30<br />
Short term (0-60 days)<br />
n/a<br />
Market view<br />
No Weighting<br />
Price performance<br />
(1M) (3M) (12M)<br />
Price (SR) 51.25 45.00 37.70<br />
Absolute (%) -1.9 11.8 33.4<br />
Rel market (%) -0.3 2.9 18.9<br />
Rel sector (%) 6.1 8.9 33.4<br />
May 07 May 08 May 09<br />
70<br />
60<br />
50<br />
40<br />
30<br />
20<br />
7020.SE<br />
Market capitalisation<br />
SR35.21bn (€7.40bn)<br />
Tadawul Index<br />
Average (12M) daily turnover<br />
SR47.68m (US$13.53m)<br />
Sector: Tadawul Telecoms Index<br />
RIC: 7020.SE, EEC AB<br />
Priced SR50.30 at close 6 May 2010.<br />
Source: Bloomberg<br />
Mobily<br />
Riding the broadband wave<br />
We like Mobily for its data-centric strategy and the continued strengthening of its<br />
brand name as the leading mobile broadband player in the Saudi market. We<br />
initiate with a Buy rating and a SR75.36 target price.<br />
Key forecasts<br />
FY08A FY09A FY10F FY11F FY12F<br />
Revenue (SRm) 10,795 13,058 14,957 16,192 17,462<br />
EBITDA (SRm) 3,794 4,837 5,684 6,315 6,898<br />
Reported net profit (SRm) 2,092 3,014 3,637 4,346 4,882<br />
Normalised net profit (SRm) 2,092 3,014 3,637 4,346 4,882<br />
Normalised EPS (SR) 2.99 4.31 5.2 6.21 6.97<br />
Dividend per share (SR) 0.75 1.25 1.52 1.6 2<br />
Dividend yield (%) 1.49 2.49 3.02 3.18 3.98<br />
Normalised PE (x) 16.8 11.7 9.68 8.1 7.21<br />
EV/EBITDA (x) 11.5 8.86 7.37 6.27 5.25<br />
EV/invested capital (x) 2.39 2.15 1.95 1.77 1.61<br />
Accounting standard: GAAP<br />
Source: Company data, <strong>Rasmala</strong> Research forecasts<br />
year to Dec, fully diluted<br />
We initiate coverage of Mobily with a Buy rating<br />
Etihad Etisalat Company (Mobily) is the second-largest mobile service provider in the<br />
Kingdom of Saudi Arabia. Following the purchase of a 3G licence, Mobily was awarded a 25-<br />
year telecommunication mobile licence, becoming the first Saudi company with authorisation<br />
for 3G services and beyond. We initiate coverage of Mobily with a Buy rating and a 12-month<br />
target price of SR75.36 per share.<br />
Mobily is our top pick and fits squarely into our investment thesis<br />
Within our coverage universe, Mobily is the company that best fits our investment theme. We<br />
believe it is ahead of the curve in its broadband ambitions and operates in a country that is<br />
on the cusp of a mobile broadband boom.<br />
Fixed-to-mobile broadband substitution trend<br />
According to ITU, for year-end 2008, mobile broadband penetration was 9.4%, while fixedbroadband<br />
penetration was 4.2% for the same period, giving further support to our argument<br />
that mobile broadband should overcome fixed broadband.<br />
Brand position mirrors Saudi demographics<br />
Early on, Mobily targeted the youthful Saudi population with a marketing campaign that<br />
stressed innovation compared with the incumbent STC. Roughly 50% of the Saudi<br />
population is below the age of 25.<br />
Analyst<br />
Shrouk Diab<br />
+20 1 9991 6882<br />
shrouk.diab@rasmala.com<br />
Dubai International Financial Centre,<br />
The Gate Village, Building 10, Level 1,<br />
P.O. Box 31145, Dubai, United Arab<br />
Emirates<br />
www.rasmala.com<br />
Important disclosures can be found in the Disclosures Appendix.<br />
Distributed outside MENA by The Royal <strong>Bank</strong> of Scotland N.V. and its affiliates under a strategic<br />
alliance with <strong>Rasmala</strong> <strong>Investment</strong> <strong>Bank</strong> Ltd.
<strong>Investment</strong> view<br />
We like Mobily for its data-centric strategy and the continued strengthening of its brand<br />
name as the leading mobile broadband player in the Saudi market.<br />
Underlying growth drivers<br />
Improving value drivers<br />
Margin improvement<br />
Etisalat bid<br />
We expect the company to continue taking market share from STC and to further entrench users<br />
with the introduction of new services. We also expect high-ARPU mobile broadband subscribers<br />
to counter declining voice ARPU and to stabilise overall blended ARPU.<br />
Over time, we expect to see margin improvement resulting from lower subscriber acquisition costs<br />
(SAC). In 2009, SAC rose to around SR100, which we believe is money well spent. We expect<br />
this strategy to capture the higher-spending early adopters in the near term and to further support<br />
our investment case for the company.<br />
Etisalat has openly discussed its intention to increase its stake in Mobily from its current 27.5%y.<br />
Although the size of the increase was not announced, Etisalat did say it intended to make its<br />
purchases on the open market and to have completed it by the end of 2010.<br />
Valuation and target price<br />
We initiate coverage of Etihad Etisalat (Mobily) with a Buy rating and a 12-month target price of<br />
SR75.36 per share. To arrive at our target price, we use an equal weighting of peer PE multiples<br />
and a DCF valuation.<br />
Discounted cash flow<br />
Our DCF valuation of Mobily yields a 12-month fair value of SR80.85 per share, 61% higher than<br />
the current price of SR50.30 per share. We use the following assumptions in deriving our DCF<br />
valuation: a 10.5% cost of equity, based on a risk-free rate of 4.5% and a premium of 6.0%; a<br />
2.5% terminal growth rate; a WACC of 10%, a cost of debt of 9.5% and a beta of 1x.<br />
Our sensitivity analysis employs different rates for the cost of equity and the terminal growth rate<br />
to illustrate how sensitive our DCF valuation is to changes in these assumptions.<br />
Table 1 : DCF valuation<br />
(SRm) Free cash flow PV of FCF<br />
2010F 3,388 3,205<br />
2011F 4,105 3,517<br />
2012F 5,383 4,173<br />
2013 5,889 4,123<br />
2014 5,496 3,481<br />
2015 5,779 3,313<br />
Terminal value 74,049 42,447<br />
Enterprise value 64,259<br />
Less: net debt 7,662<br />
Equity value 56,597<br />
Number of shares (000) 700<br />
12-month fair value per share 80.85<br />
Source: <strong>Rasmala</strong> estimates<br />
Table 2 : DCF sensitivity analysis<br />
(SR per share)<br />
Cost of equity<br />
Terminal growth rate 8.5% 9.5% 10.5% 11.5% 12.5%<br />
0.5% 87.80 76.67 67.78 60.51 54.47<br />
1.5% 97.95 84.24 73.59 65.08 58.12<br />
2.5% 111.49 93.98 80.85 70.65 62.50<br />
3.5% 130.44 106.96 90.19 77.62 67.85<br />
4.5% 158.87 125.13 102.64 86.59 74.54<br />
Source: <strong>Rasmala</strong> estimates<br />
Mobily | <strong>Investment</strong> View | 12 May 2010 2<br />
96
Peer valuation<br />
Using our peer group and calculating an average of estimated PE multiples for FY10F of 13.1x<br />
and FY11F of 11.5x, we arrive at a fair value of SR69.86 per share, 39% higher than the current<br />
share price of SR50.3 per share.<br />
Table 3 : Estimated PE of telecom peers<br />
(x) 2010F 2011F<br />
Telefonos de Mexico 8.8 8.5<br />
Reliance Industries 19.6 14.1<br />
Telekom Malaysia 23.1 21.3<br />
Globe Telecom Inc 9.8 9.4<br />
Advanced Info Service 12.8 12.3<br />
Indosat TBK 17.7 14.9<br />
MTN Group 10.48 8.8<br />
Excelcomindo Pratama 15.4 12.4<br />
Turkcell Iletisim Hizmet 10.5 9.7<br />
Vodacom Group 10.53 9.2<br />
Bharti Airtel 12.3 13.2<br />
America Movil SAB de C 13.0 11.7<br />
China Telecom Corp 17.7 14.6<br />
Celtel Zambia 10.6 9.7<br />
Magyar 9.2 9.4<br />
Turk Telekomunikasyon 9.3 8.5<br />
Mobile Telesystems 12.6 7.8<br />
Average 13.1 11.5<br />
Source: Bloomberg<br />
How we differ from consensus<br />
We are significantly above Bloomberg consensus estimates for 2010 and 2011 on revenues,<br />
EBITDA and EPS. We estimate EPS of SR5.20 and SR6.21 for 2010 and 2011, while consensus<br />
shows SR4.77 and SR5.08. Our base case assumes more subscribers, higher ARPU and a better<br />
Hajj season this year compared with last year, when the swine flu epidemic resulted in a lowerthan-average<br />
pilgrimage flow.<br />
Risks to our central scenario<br />
If broadband uptake is slower than we project, there could be a risk to our numbers. While we<br />
have factored in and are confident about higher SAC in the near term, any shortfall of higherspending<br />
subscribers could put our margin assumption at risk.<br />
Irrational pricing by Zain and/or STC could put downward pressure on ARPU. While churn is not<br />
high in Saudi Arabia, aggressive promotions could trigger an acceleration.<br />
Regulatory changes to the types of services permitted throughout the Kingdom could slow the<br />
adoption of next-gen, value-added services. This could delay subscriber growth in the mobile<br />
broadband segment.<br />
The outbreak of another epidemic like swine flu in 2008 could significantly affect our forecasts<br />
because Mobily’s peak season is usually during Ramadan and Hajj.<br />
Mobily | <strong>Investment</strong> View | 12 May 2010 3<br />
97
Company dynamics<br />
We believe Mobily’s commitment to offering value-added services will lead to a reduction<br />
in its annual churn, which in turn should lead to margin improvement.<br />
Attractive demographics<br />
We believe the combination of a youthful population, a large number of expats, declining<br />
PC/laptop prices, limited entertainment venues and a high GDP/capita constitutes a favourable<br />
environment for telecommunications operators.<br />
On the cusp of a broadband boom<br />
Despite the fact that headline mobile penetration rates reached 175% at the end of 2009, we still<br />
see room for growth in the Saudi telecommunications industry, particularly in terms of high-speed<br />
data provision. We believe the telecom industry in Saudi Arabia is on the cusp of a broadband<br />
boom, although it is still undergoing sector liberalisation.<br />
Chart 1 : Saudi Arabia – mobile subscribers and penetration<br />
60<br />
250%<br />
50<br />
200%<br />
40<br />
150%<br />
30<br />
20<br />
100%<br />
10<br />
50%<br />
0<br />
2001A 2002A 2003A 2004A 2005A 2006A 2007A 2008A 2009A 2010E 2011F 2012F<br />
0%<br />
Total mobile subscribers (mn) Penetration (%)<br />
Source: Company data, CITC, ITU, <strong>Rasmala</strong> forecasts<br />
According to the Communications and Information Technology Commission (CITC), the number of<br />
broadband subscribers increased from 64,000 in 2005 to exceed 2.75m at the end of 2009,<br />
equivalent to a broadband population penetration rate of 10.7%.<br />
Chart 2 : CITC – broadband penetration<br />
3.0<br />
Subscribers (m)<br />
12%<br />
2.5<br />
10%<br />
2.0<br />
8%<br />
1.5<br />
6%<br />
1.0<br />
4%<br />
0.5<br />
2%<br />
-<br />
2005 2006 2007 2008 2009<br />
Wireless (WiMAX and HSPA) DSL and other subscriptions Penetration<br />
0%<br />
Source: CITC<br />
Mobily | <strong>Investment</strong> View | 12 May 2010 4<br />
98
Strong ability to capture market share<br />
Since its operational launch in 2005, Mobily has been able to acquire most of the net subscriber<br />
additions in the Saudi market, outstripping Saudi Telecom’s dominant market share by an average<br />
of 13% per year. Despite Zain Saudi’s entry and its aggressive campaign (including its ‘one month<br />
paid, one month free’ promotion), Mobily has managed to maintain its 40% market share.<br />
Chart 3 : Market share of operators<br />
80%<br />
70%<br />
60%<br />
50%<br />
40%<br />
30%<br />
20%<br />
10%<br />
0%<br />
2006 2007 2008 2009<br />
Mobily STC Zain Saudi<br />
Source: Operators, <strong>Rasmala</strong><br />
Branding is key for subscriber acquisition and retention<br />
We believe that part of Mobily’s strong subscriber acquisition ability in the Saudi market can be<br />
explained by its focus on brand recognition and market segmentation. Mobily was able to<br />
effectively segment its subscriber base and develop a strategy to target the specific needs of each<br />
segment. For example, the company was the first telecom operator in Saudi Arabia to launch a<br />
business brand targeting the corporate sector, namely Mobily Business – which is distinct from the<br />
company’s mass-market consumer offerings. It also introduced the BlackBerry service, with more<br />
than 20 banks and corporate institutions signing up to this by the end of 2006.<br />
Mobily has also been focusing on attracting and retaining the high-ARPU post-paid segment,<br />
thereby somewhat offsetting the deterioration in its overall ARPU. One of the company’s initiatives<br />
was the introduction of its brand ‘Raqi’, tailored to the VIP segment of its subscriber base, which<br />
now has 1.8m subscribers, or 10% of its total subscriber base. These customers are early<br />
adopters of new products and services, and will serve as a good target audience for the<br />
company’s broadband ambitions, in our view.<br />
Capitalising on underserved data demand<br />
Part of Mobily’s ongoing strategy and focus since its operational launch has been the provision of<br />
high-speed data services, positioning itself as the pioneer in terms of mobile broadband services<br />
compared to STC’s position as the lead provider of fixed broadband (ADSL) services. Mobily<br />
strengthened its position in the broadband market with the acquisition of Saudi WiMAX operator<br />
Bayanat al-Oula in September 2007 for a total consideration of US$400m. In order to complement<br />
its broadband services, Mobily purchased local ISP Zajil International in 2008 for a consideration<br />
of US$21.3m. As a result of Mobily’s aggressive HSPA deployment strategy, total HSPA<br />
subscriptions exceeded 1m users by the end of 2009, a 400% increase compared with 2008’s<br />
subscriber base, equivalent to a 90% market share of total mobile broadband subscribers in Saudi<br />
Arabia.<br />
According to management, daily data traffic uploaded and downloaded by customers has grown<br />
to exceed 50 terabytes (TB), compared with 19 TB in 2008. Data’s contribution to overall revenue<br />
reached 14% at the end of 2009 compared with 9% in 2008. Additionally, management expects<br />
data revenue contribution to exceed 17% by the end of 2010 and 20% by the end of 2011.<br />
According to management, this contribution remains below the average for North American and<br />
Western European operators, with data revenue contribution in the UK averaging 20% and, in the<br />
US, 30% of overall telecom revenue.<br />
Mobily | <strong>Investment</strong> View | 12 May 2010 5<br />
99
Wireless broadband to overcome fixed-line broadband<br />
Given our view that high-speed data demand will be the next growth driver for telecom revenues,<br />
we believe mobile broadband in particular will yield the highest growth potential. Our premise is<br />
based on a number of assumptions highlighting the limitations of fixed versus wireless broadband.<br />
! Physical limitation of ADSL: Due to the large land mass of Saudi Arabia, 100% coverage<br />
through landlines may not be economically feasible.<br />
! Technical installation of ADSL: This requires several visits from a technician and the<br />
scheduling of an appointment, which may take several days or weeks.<br />
! One house can have several HSPA subscriptions: Since HSPA is sold to individuals, the<br />
bandwidth is not shared by the entire household.<br />
! The ability to monetise usage: Operators can charge for usage, which can help them to<br />
monetise heavy users.<br />
Revenue and subscribers<br />
We expect Mobily to maintain a stable market share of around 40% throughout our forecast<br />
period. We believe most of the market share gained by Zain Saudi Arabia will be largely at the<br />
expense of STC. We expect Mobily’s customer base to grow by about 12% and 7% in 2010 and<br />
2011, reaching 20.4m and 22.0m subscribers, respectively.<br />
While operators do not provide ARPU data, let alone figures for ARPU generated from data<br />
revenues, we have factored into our assumptions an ongoing annual decline in our ARPU<br />
forecasts to account for the growth in value-added services provided by the operator.<br />
Chart 4 : Mobily – subscribers and market share<br />
Chart 5 : Mobily – revenue and revenue growth<br />
25<br />
44%<br />
20,000<br />
30%<br />
18,000<br />
20<br />
43%<br />
16,000<br />
14,000<br />
25%<br />
20%<br />
15<br />
12,000<br />
42%<br />
10,000<br />
15%<br />
10<br />
8,000<br />
5<br />
41%<br />
6,000<br />
4,000<br />
10%<br />
5%<br />
2,000<br />
0<br />
40%<br />
0<br />
0%<br />
2008A 2009A 2010E 2011F 2012F<br />
2008A 2009A 2010E 2011F 2012F<br />
Mobily mobile subscribers (m) Mobily market share (%)<br />
Mobily revenue (SRm) Revenue growth (%)<br />
Source: Operators, <strong>Rasmala</strong> forecasts<br />
Source: Company filings, <strong>Rasmala</strong> forecasts<br />
The Saudi market’s telecommunications revenues are seasonal, based on the timing of the Holy<br />
Month of Ramadan and Hajj. Throughout our forecast period the Holy Month of Ramadan and Hajj<br />
should fall during the second half of the year. During this time, operators capitalise on net<br />
subscriber additions, roaming revenues, interconnect fees and, with the adoption of sophisticated<br />
devices, should benefit from video calls and higher-value-added services.<br />
Profitability<br />
We believe Mobily’s commitment to offering value-added services will lead to an increase in its<br />
customers’ loyalty and, accordingly, to a reduction in annual churn. Its EBITDA margin has<br />
already been improving on an annual basis, reaching 37% at year-end 2009. We forecast the<br />
margin will improve to 38% in 2010, despite higher subscriber acquisitions costs, which should be<br />
more than offset by higher-spending users.<br />
Mobily | <strong>Investment</strong> View | 12 May 2010 6<br />
100
Chart 6 : Mobily – EBITDA and EBITDA margin<br />
Chart 7 : Mobily – net profit and net profit margin<br />
8,000<br />
40%<br />
6,000<br />
30%<br />
7,000<br />
6,000<br />
39%<br />
5,000<br />
28%<br />
5,000<br />
4,000<br />
`<br />
38%<br />
4,000<br />
3,000<br />
`<br />
26%<br />
24%<br />
3,000<br />
37%<br />
2,000<br />
22%<br />
2,000<br />
1,000<br />
36%<br />
1,000<br />
20%<br />
0<br />
2008A 2009A 2010E 2011F 2012F<br />
35%<br />
0<br />
2008A 2009A 2010E 2011F 2012F<br />
18%<br />
Mobily EBITDA (SR m)<br />
Mobily EBITDA margin<br />
Net profit (SRm)<br />
Net profit margin<br />
Source: Company data, <strong>Rasmala</strong> forecasts<br />
Source: Company data, <strong>Rasmala</strong> forecasts<br />
Capex<br />
Going forward, we expect Mobily to continue investing in infrastructure. More specifically, the<br />
company will likely focus its capital expenditure on supporting its data network, wireless<br />
broadband, HSPA and WiMax deployment. VOIP is currently prohibited in the Kingdom, but<br />
Mobily says it will continue to invest in FTTP. We expect capex as a percentage of revenue to<br />
decline over time, while remaining a sizeable amount each year. We forecast capex will reach<br />
around SR3bn in 2010, equivalent to about 19% of total revenue.<br />
Chart 8 : Mobily – revenue and capex/sales<br />
20,000<br />
18,000<br />
16,000<br />
14,000<br />
12,000<br />
10,000<br />
8,000<br />
6,000<br />
4,000<br />
2,000<br />
0<br />
2008A 2009A 2010E 2011F 2012F<br />
35%<br />
30%<br />
25%<br />
20%<br />
15%<br />
10%<br />
5%<br />
0%<br />
Mobily revenue (SRm) Capex/revenue (%)<br />
Source: Company data, <strong>Rasmala</strong> forecasts<br />
Leverage<br />
In 2009, Mobily was able to refinance the SR1.5bn Islamic finance loan that it used to acquire<br />
Bayanat Al Oula The facility was transformed into a loan with a four-year repayment period.<br />
Mobily has improved its capital structure since 2008, reaching net debt/EBITDA of 1.6x at the end<br />
of 2009, compared with 2.3x at the end of 2008. Given positive free cash flow generation, we do<br />
not expect Mobily to face any financing difficulties in the forthcoming period. We expect it to<br />
maintain net debt/EBITDA below 1.6x at year-end 2010.<br />
Dividends<br />
In 2009, Mobily paid a SR1.25ps dividend, up from SR0.75 in 2008. Given the company’s free<br />
cash flow generation, we expect a SR1.50 dividend to be paid in 2010 and further increases going<br />
forward.<br />
Mobily | <strong>Investment</strong> View | 12 May 2010 7<br />
101
Appendix<br />
Company overview<br />
Awarded with the second mobile licence in Saudi Arabia, Mobily was able to capture 40% market<br />
share in less than five years of operation. Mobily is now capitalising on the considerable pent-up<br />
demand for data services by developing its broadband infrastructure.<br />
Background<br />
Etihad Etisalat Company (Mobily) is the second-largest mobile service provider in the Kingdom of<br />
Saudi Arabia. Following its purchase of a 3G licence, Mobily was awarded a 25-year<br />
telecommunication mobile licence, becoming the first Saudi company with authorisation for 3G<br />
services. Mobily was established in July 2004 to bid for telecommunications licences in Saudi<br />
Arabia; it began operations in May 2005, covering 32 cities under the Mobily brand name. By the<br />
end of 2006, it had extended coverage to 90% of the population and had launched the Kingdom’s<br />
first 3.5G service. By 2007, Mobily’s subscriber base had grown to more than 11m from a mere<br />
1m in 2005, and it ended 2009 with 18.2m subscribers.<br />
Mobily’s coverage at launch was almost 80% of the population, and this increased by 10% the<br />
following year. By the end of 2006, Mobily had more than 6m subscribers, translating into 30%<br />
market share, and covering more than 3,600 points of sale. It also engaged in a strategic<br />
partnership with Integrated Telecom Company and Bayanat Al-Oula to develop Saudi Arabia’s<br />
new fibre-optic network, which comprised 12,600km, and later replaced leased lines from Saudi<br />
Telecom. In 2007, Mobily announced investments of SR1bn to enhance its 3.5G network, and<br />
SR1.5bn to acquire Bayanat Al-Oula and its share in the fibre-optic network, increasing Mobily’s<br />
stake in that network to 66.6%. With the Bayanat acquisition, Mobily signed an agreement to roll<br />
out the largest WiMAX network in the region, allowing it to move closer to its goal of maximising<br />
converged offerings to customers.<br />
In 2008, Mobily made a strategic investment of SR80m in Zajil International Telecom, a leading<br />
Saudi Internet Service Provider (ISP) with a firm foothold in the corporate market. Through this<br />
acquisition, Mobily gained a wide array of customers with diverse needs that complemented its<br />
service offerings.<br />
In 2009, Mobily kept developing its WiMAX network, with 1,300 base stations installed (compared<br />
with 394 for the previous year) to extend coverage to more than 20 cities, from just four one year<br />
before. Saudi Arabia’s low broadband penetration of less than 10% presents a good opportunity<br />
for Mobily.<br />
Chart 9 : Market share according to subscriber base year-end 2009<br />
Zain KSA<br />
13%<br />
STC<br />
47%<br />
Mobily<br />
40%<br />
Source: Company data<br />
Mobily | <strong>Investment</strong> View | 12 May 2010 8<br />
102
M&A history of the company<br />
Acquisition of Bayanat Al-Oula<br />
In 2008, Mobily closed the acquisition of Bayanat Al-Oula for SR1.5bn to gain exposure to the<br />
growing WiMAX data services market. This acquisition increased Mobily’s ownership of the<br />
national fibre-optic network to 66% from 33%. It also augments Mobily’s vision of transforming<br />
itself from a mobile operator into a fully integrated telecom service provider.<br />
Acquisition of Zajil<br />
In 4Q08, Mobily paid SR80m to acquire 96% of shares in Zajil International Telecom, a leading<br />
Saudi Internet service provider.<br />
Mobily InfoTech (India)<br />
In 2007, the company made an investment of SR9.2m in Mobily InfoTech (MIT), a company in<br />
Bangalore, India, to support its information technology division. Management expects Mobily<br />
InfoTech to provide solutions and consultancy services to third parties by 2010.<br />
Mobily | <strong>Investment</strong> View | 12 May 2010 9<br />
103
Income statement<br />
SRm FY08A FY09A FY10F FY11F FY12F<br />
Revenue 10795 13058 14957 16192 17462<br />
Cost of sales -4773 -5512 -6058 -6396 -6898<br />
Operating costs -2227 -2710 -3216 -3481 -3667<br />
EBITDA 3794 4837 5684 6315 6898<br />
DDA & Impairment (ex gw) -1298 -1629 -1721 -1820 -1921<br />
EBITA 2496 3208 3963 4495 4976<br />
Goodwill (amort/impaired) 0.00 0.00 0.00 0.00 0.00<br />
EBIT 2496 3208 3963 4495 4976<br />
Net interest -438.2 -204.3 -315.7 -131.4 -72.5<br />
Associates (pre-tax) 0.00 0.00 0.00 0.00 0.00<br />
Other pre-tax items 41.2 41.0 44.9 48.6 52.4<br />
Reported PTP 2099 3045 3692 4413 4956<br />
Taxation -7.19 -30.8 -55.4 -66.2 -74.3<br />
Minority interests 0.00 0.00 0.00 0.00 0.00<br />
Other post-tax items 0.00 0.00 0.00 0.00 0.00<br />
Reported net profit 2092 3014 3637 4346 4882<br />
Tot normalised items 0.00 0.00 0.00 0.00 0.00<br />
Normalised EBITDA 3794 4837 5684 6315 6898<br />
Normalised PTP 2099 3045 3692 4413 4956<br />
Normalised net profit 2092 3014 3637 4346 4882<br />
Source: Company data, <strong>Rasmala</strong> Research forecasts<br />
year to Dec<br />
Balance sheet<br />
SRm FY08A FY09A FY10F FY11F FY12F<br />
Cash & market secs (1) 1264 933.4 804.8 685.2 2505<br />
Other current assets 5357 7644 9094 11398 13485<br />
Tangible fixed assets 8117 10370 12090 13223 13572<br />
Intang assets (incl gw) 12453 11980 12504 12504 12504<br />
Oth non-curr assets 0.00 0.00 0.00 0.00 0.00<br />
Total assets 27192 30926 34492 37810 42067<br />
Short term debt (2) 1862 370.5 1274 8.21 0.00<br />
Trade & oth current liab 8887 11818 13306 16222 18563<br />
Long term debt (3) 6642 6448 5050 3492 1933<br />
Oth non-current liab 46.3 46.5 46.5 46.5 46.5<br />
Total liabilities 17437 18683 19677 19768 20543<br />
Total equity (incl min) 9754 12243 14815 18042 21523<br />
Total liab & sh equity 27192 30926 34492 37810 42067<br />
Net debt 8526 7662 6702 4373 986.4<br />
Source: Company data, <strong>Rasmala</strong> Research forecasts<br />
year ended Dec<br />
Cash flow statement<br />
SRm FY08A FY09A FY10F FY11F FY12F<br />
EBITDA 3794 4837 5684 6315 6898<br />
Change in working capital -365.0 154.2 631.7 236.4 254.1<br />
Net interest (pd) / rec -438.2 -204.3 -315.7 -131.4 -72.5<br />
Taxes paid -7.19 -30.8 -55.4 -66.2 -74.3<br />
Other oper cash items 34.1 10.3 -11.2 -17.6 -21.9<br />
Cash flow from ops (1) 3018 4766 5933 6336 6983<br />
Capex (2) -3418 -3357 -2917 -2429 -1746<br />
Disposals/(acquisitions) 0.00 0.00 0.00 0.00 0.00<br />
Other investing cash flow -1618 -2.43 -1450 -524.3 -524.3<br />
Cash flow from invest (3) -5036 -3359 -4366 -2953 -2270<br />
Incr / (decr) in equity 0.00 0.00 0.00 0.00 0.00<br />
Incr / (decr) in debt 0.00 0.00 0.00 0.00 0.00<br />
Ordinary dividend paid -525.0 -875.0 -1065 -1120 -1400<br />
Preferred dividends (4) 0.00 0.00 0.00 0.00 0.00<br />
Other financing cash flow 3104 -862.7 -631.3 -2383 -1492<br />
Cash flow from fin (5) 2579 -1738 -1696 -3503 -2892<br />
Forex & disc ops (6) 0.00 0.00 0.00 0.00 0.00<br />
Inc/(decr) cash (1+3+5+6) 560.8 -330.6 -129.3 -119.6 1820<br />
Equity FCF (1+2+4) -400.2 1410 3016 3907 5237<br />
Source: Company data, <strong>Rasmala</strong> Research forecasts<br />
year to Dec<br />
Mobily | Key Financial Data | 12 May 2010<br />
104
car<br />
Equity | Saudi Arabia | Mobile Telcos<br />
12 May 2010<br />
Initiation of coverage<br />
Sell<br />
Target price<br />
SR7.72<br />
Price<br />
SR9.00<br />
Short term (0-60 days)<br />
n/a<br />
Market view<br />
No Weighting<br />
Price performance<br />
(1M) (3M) (12M)<br />
Price (SR) 9.65 9.70 11.05<br />
Absolute (%) -6.7 -7.2 -18.6<br />
Rel market (%) -5.2 -14.6 -27.4<br />
Rel sector (%) 0.8 -9.6 -18.6<br />
Mar 08 Dec 08 Aug 09<br />
28<br />
24<br />
20<br />
16<br />
12<br />
8<br />
7030.SE<br />
Market capitalisation<br />
SR12.60bn (€2.65bn)<br />
Tadawul Index<br />
Average (12M) daily turnover<br />
SR77.37m (US$6.90m)<br />
Sector: Tadawul Telecoms Index<br />
RIC: 7030.SE, ZAINKSA AB<br />
Priced SR9.00 at close 6 May 2010.<br />
Source: Bloomberg<br />
Zain Saudi<br />
Late to the party<br />
Zain Saudi began commercial operations in August 2008 and by 31 December<br />
2009 had a market share of 13% and a subscriber base of 6m. Given its large debt<br />
burden and our cash-flow concerns, we initiate coverage with a Sell rating and a<br />
12-month target price of SR7.72 per share.<br />
Key forecasts<br />
FY08A FY09A FY10F FY11F FY12F<br />
Revenue (SRm) 505.2 3,004 3,802 4,263 4,602<br />
EBITDA (SRm) -1,265 -1,073 -380.2 426.3 920.5<br />
Reported net profit (SRm) -2,278 -3,099 -2,563 -1,802 -923<br />
Normalised net profit (SRm) -1,860 -3,099 -2,563 -1,802 -923<br />
Normalised EPS (SR) -1.33 -2.21 -1.83 -1.29 -0.66<br />
Dividend per share (SR) 0 0 0 0 0<br />
Dividend yield (%) 0 0 0 0 0<br />
Normalised PE (x) n/m n/m n/m n/m n/m<br />
EV/EBITDA (x) n/m n/m n/m 80.6 30.1<br />
EV/invested capital (x) 1.04 1.19 1.29 1.32 1.5<br />
Accounting standard: GAAP<br />
Source: Company data, <strong>Rasmala</strong> Research forecasts<br />
year to Dec, fully diluted<br />
Intense competition<br />
Zain entered the Saudi market, dominated by Mobily and Saudi Telecom Company (STC), at<br />
a time when mobile penetration was already over 100%. The company now faces the<br />
challenge of building out a network and competing against these two entrenched operators.<br />
To date, its capital expenditure has been directed towards improving voice, whereas Mobily<br />
and STC are positioning for the emerging broadband cycle.<br />
Breakeven a distant prospect?<br />
We believe it will take longer for Zain to break even than it did for the two dominant<br />
operators, given that it is the third player in the market, has had relatively high entry costs<br />
and faces stiff competition from the incumbents. The prospect of a price war with these two<br />
would only undermine its position, in our view.<br />
Debt is a major concern to us<br />
As is typical for a start-up, Zain Saudi has a large debt burden on its books. Given the<br />
potential effect on its long-term free cash flows, this concerns us, particularly as the company<br />
has already breached some of its syndicated loan covenants by failing to achieve certain<br />
operational targets in 2009.<br />
Analyst<br />
Shrouk Diab<br />
+20 1 9991 6882<br />
shrouk.diab@rasmala.com<br />
Dubai International Financial Centre,<br />
The Gate Village, Building 10, Level 1,<br />
P.O. Box 31145, Dubai, United Arab<br />
Emirates<br />
www.rasmala.com<br />
Important disclosures can be found in the Disclosures Appendix.<br />
Distributed outside MENA by The Royal <strong>Bank</strong> of Scotland N.V. and its affiliates under a strategic<br />
alliance with <strong>Rasmala</strong> <strong>Investment</strong> <strong>Bank</strong> Ltd.
<strong>Investment</strong> view<br />
We believe Zain Saudi faces many challenges given the US$6.1bn it paid to acquire the<br />
third mobile licence in Saudi Arabia. We initiate coverage of the stock with a Sell rating and<br />
a 12-month target price of SR7.72 per share.<br />
Catalysts for share price performance<br />
Usage rather than users<br />
Capital constraints<br />
Pricing strategy<br />
Zain has been able to capture subscribers in its early days, but we believe the company now<br />
needs to start showing usage. Headline subscriber numbers are solid as Zain’s operations get<br />
under way, but we think investors will now be looking for ARPU and usage.<br />
Given its late entry into the Saudi market, Zain needs to invest heavily to catch up with STC and<br />
Mobily. In our view, it must accelerate capex in order to improve its coverage and quality of<br />
service if it hopes to remain competitive. According to the coverage stipulations of the third mobile<br />
licence, Zain Saudi must cover a minimum of 93% of the Saudi population within the first five<br />
years of the launch of its operations.<br />
Zain Saudi has instigated aggressive pricing with its operational launch, coming onto the market<br />
with the ‘One month on us, one month on you’ campaign offering the first 500,000 subscribers the<br />
equivalent of a 50% lifetime discount combined with the benefits of the ‘One Network’ concept.<br />
However, we believe the company will find it difficult to encourage subscribers to trade up. Its<br />
focus at this stage is on showing net subscriber additions regardless of the cost. This strategy is<br />
likely to result in short-term subscriber additions, but in the long run, we think the industry will<br />
suffer. Aggressive promotions could be the trigger to accelerating subscriber churn.<br />
Valuation and target price<br />
We initiate coverage of Zain Saudi (Zain KSA) with a Sell rating and a 12-month target price of<br />
SR7.72 per share. To arrive at our target price, we have used a three-stage DCF model because<br />
the company is still in the start-up phase.<br />
Our DCF valuation of Zain Saudi implies a 12-month fair value of SR7.72 per share, 14% lower<br />
than the current trading price of SR9.0 per share. The assumptions underlying our valuation are a<br />
10.50% cost of equity, based on a risk-free rate of 4.50% and an equity-risk premium of 6.00%.<br />
We also use a 2.5% terminal growth, a WACC of 6.3%, a 5.0% cost of debt and a beta of 1x.<br />
Table 1 : Three-stage DCF valuation<br />
(SRm) Free cash flow PV of FCF<br />
2010 -3,619 -3,778<br />
2011 -3,993 -4,444<br />
2012 -2,555 -3,155<br />
2013 433 349<br />
2014 1,072 815<br />
2015 1,447 1,030<br />
2016-21 (WACC: 6.3%. Five-year growth: 5.0%) 10,334 5,925<br />
Terminal value 52,574 25,966<br />
Enterprise value 22,709<br />
Minus: net debt 11,902<br />
Equity value 10,807<br />
Number of shares 1,400<br />
12-month fair value per share (SR) 7.72<br />
Source: Company data, <strong>Rasmala</strong> estimates<br />
We have also undertaken a sensitivity analysis, using different rates for the cost of equity and<br />
terminal growth rate, to illustrate how sensitive our DCF-based target price is to changes in these<br />
assumptions.<br />
Zain Saudi | <strong>Investment</strong> View | 12 May 2010 2<br />
106
Table 2 : DCF sensitivity analysis<br />
(SR per share)<br />
Cost of equity<br />
Terminal growth rate 8.5% 9.5% 10.5% 11.5% 12.5%<br />
0.5% 3.25 2.11 1.06 0.10 -0.79<br />
1.5% 6.63 5.08 3.70 2.44 1.30<br />
2.5% 12.07 9.74 7.72 5.94 4.36<br />
3.5% 22.29 18.09 14.64 11.75 9.29<br />
4.5% 48.45 37.33 29.32 23.27 18.54<br />
Source: <strong>Rasmala</strong> estimates<br />
How we differ from consensus<br />
We are significantly lower than Bloomberg consensus estimates for 2010 and 2011 on revenues<br />
and EBITDA. In formulating our assumptions, we remain quite concerned about competition in the<br />
mobile broadband business, particularly from Mobily.<br />
Key risks to our target price<br />
Upside risks to Sell rating<br />
Since Zain Saudi is still in its start-up phase, most of its focus and monies have been directed<br />
towards building its own network infrastructure. If the company can capture meaningful share in<br />
the mobile broadband segment or find an alternative solution for cutting costs, such as more<br />
outsourcing or network-sharing agreements, our estimates will likely prove to be too conservative.<br />
If Zain Saudi is more successful than we expect at transitioning its subscribers towards higher<br />
ARPU services, this should translate into significant upside to our numbers, and the company<br />
might exceed our estimates.<br />
Downside risks<br />
Irrational pricing by Mobily and/or STC could exert downward pressure on Zain’s ARPU. While<br />
churn is not high in Saudi Arabia, aggressive promotions could trigger an acceleration in churn.<br />
Regulatory changes to the types of services permitted throughout the Kingdom could slow the<br />
adoption of next-generation, value-added services. This could delay subscriber growth in the<br />
mobile broadband segment.<br />
The outbreak of another epidemic such as swine flu in 2008 could significantly affect our forecasts<br />
because Zain’s peak season is usually during Ramadan and Hajj.<br />
An inability to refinance debt could be a major concern for the company’s ongoing operations.<br />
Zain Saudi | <strong>Investment</strong> View | 12 May 2010 3<br />
107
Company dynamics<br />
Since its inception, Zain Saudi has been rapidly introducing new technology to the Saudi<br />
telecoms market, which is under-addressed in the broadband segment. It began its 4G LTE<br />
coverage programme to improve network capability in February.<br />
Subscriber build-up and strategy<br />
Within four months of launching operations, Zain Saudi reported a subscriber base of 2m<br />
customers and a 6% market share that was mainly captured from STC. By 31 December 2009, 16<br />
months after it came to market, the company reported 6m customers and an estimated market<br />
share of 13%.<br />
In its first full year of operations ending 31 December 2009, Zain Saudi reported revenue of<br />
SR3.0bn. Although the company is yet to make a profit, its net operating losses narrowed in 4Q09<br />
to SR657.0m compared to SR930.0m in 4Q08.<br />
Chart 1 : Market share of operators<br />
80.0%<br />
70.0%<br />
60.0%<br />
50.0%<br />
40.0%<br />
30.0%<br />
20.0%<br />
10.0%<br />
0.0%<br />
2006 2007 2008 2009<br />
Mobily STC Zain Saudi<br />
Source: Operators, <strong>Rasmala</strong><br />
After starting 3G services with its rollout, Zain Saudi introduced I-HSPA in mid-2009, along with<br />
several other promotional packages (pay-per-day and a free modem with every connection). It<br />
was also the first operator in Saudi Arabia to introduce, in January 2010, a portable Wi-Fi device<br />
capable of connecting five devices simultaneously. Zain Saudi commenced its 4G LTE coverage<br />
programme in February 2010 in collaboration with Huawei, Motorola and Ericsson.<br />
Given the fierce competition and third-entrant effect, Zain Saudi’s churn-out level is slightly above<br />
the market average at 17% as at 2009, according to management.<br />
Management has indicated that Zain will compete in the following areas over time:<br />
! Best customer experience along all customer touch points;<br />
! Product and tariff innovation;<br />
! Offer customisation; and<br />
! A segmented approach to the market; until mid-2009, Zain followed a more mass-market<br />
approach.<br />
Its products include 10/10, for high-end users, a package for sports fans, and several expat<br />
packages focusing on ethnic communities.<br />
According to Zain Saudi’s management, although Mobily is also segmenting its offers, Zain will<br />
adopt a more thorough, lifetime approach, whereby each segment will be targeted using tariffs,<br />
products and services to drive acquisition, foster retention and stimulate share of wallet.<br />
For the business segment specifically, Zain will leverage a stronger direct sales approach in<br />
combination with the best possible back office/customer service.<br />
Zain Saudi | <strong>Investment</strong> View | 12 May 2010 4<br />
108
A tangible opportunity in broadband<br />
Given that mobile penetration rates are at the high end of the spectrum (175% at year-end 2009),<br />
it seems the more tangible opportunity lies in the broadband market. We believe the telecom<br />
industry in Saudi Arabia is on the brink of a broadband boom, although it is still undergoing sector<br />
liberalisation.<br />
Chart 2 : Saudi mobile subscribers and penetration<br />
60<br />
250%<br />
50<br />
200%<br />
40<br />
150%<br />
30<br />
20<br />
100%<br />
10<br />
50%<br />
0<br />
2001A 2002A 2003A 2004A 2005A 2006A 2007A 2008A 2009A 2010E 2011F 2012F<br />
0%<br />
Total mobile subscribers (mn) Penetration (%)<br />
Source: Company data, CITC, ITU, <strong>Rasmala</strong> forecasts<br />
According to the Saudi Communications and Information Technology Commission (CITC), the<br />
number of broadband subscribers increased from 64,000 in 2005 to over 2.75m at the end of<br />
2009, equivalent to a broadband population penetration rate of 10.7% at the end of 2009, and a<br />
household broadband penetration rate of around 32%.<br />
Chart 3 : Saudi broadband penetration<br />
3.0<br />
Subscribers (m)<br />
12%<br />
2.5<br />
10%<br />
2.0<br />
8%<br />
1.5<br />
6%<br />
1.0<br />
4%<br />
0.5<br />
2%<br />
-<br />
2005 2006 2007 2008 2009<br />
Wireless (WiMAX and HSPA) DSL and other subscriptions Penetration<br />
0%<br />
Source: CITC<br />
Zain Saudi’s management expects significant growth in mobile broadband subscriptions over the<br />
next two to three years, in line with the current trend of accelerated growth. Additionally,<br />
management said it expects growth in the range of 20% for mobile broadband. Zain Saudi intends<br />
to target users seeking an alternative to fixed solutions, but will also target mobile customers. At<br />
present, the contribution of data revenue to overall revenue is between 5-10%, as per<br />
management guidance.<br />
Zain Saudi | <strong>Investment</strong> View | 12 May 2010 5<br />
109
Market positioning could prove challenging<br />
Given our earlier argument for broadband potential, we believe the next step for Zain is to decide<br />
whether to provide mobile or fixed broadband. Since the company has no fixed-line licence and<br />
has not acquired a data provider as Mobily did with Bayanat El Oula, it cannot yet provide fixed<br />
broadband or even triple-play services. We think the only remaining economic avenue where Zain<br />
Saudi can compete is in mobile broadband, particularly given that the rollout of either FTTH or<br />
copper networks would be too expensive at this stage of the company’s life cycle.<br />
That said, since Zain Saudi is in the start-up phase, most of its focus and monies have been<br />
directed towards building its own network infrastructure, with increased emphasis on network<br />
coverage. As is typical of most new licence awardees, national roaming is part of the licence grant<br />
but, for a limited time, is confined to voice and excludes broadband services. We believe this puts<br />
Zain Saudi at a disadvantage compared to Mobily or STC, because it means it is unable to<br />
compete with the same quality of service as its competitors.<br />
As a result, we believe that even if Zain Saudi were to ramp up its infrastructure rollout, market<br />
branding would be difficult because Mobily has firmly positioned itself as the leading mobile<br />
broadband brand, while STC has positioned itself as the leading fixed broadband brand.<br />
How resilient are ARPUs?<br />
Despite Zain Saudi being able to capture most of the net subscriber additions in the Saudi market,<br />
our main focus is on usage stimulation as opposed to headline subscriber numbers alone.<br />
Additionally, since the company has launched on the Saudi market with aggressive promotional<br />
activities (for instance, the lifetime offers in which the first 500,000 subscribers are given a month<br />
of free talk time equivalent to the amount of money spent in the prior month), we believe ARPUs<br />
will face increasing pressure. Since neither Mobily nor Zain Saudi reports monthly or even annual<br />
ARPUs, we use our own calculation, which indicates an annual decline of about 50% in Zain<br />
Saudi’s overall ARPU versus an 11% slide for Mobily for year-end 2009.<br />
Chart 4 : Zain Saudi – mobile subscribers and market<br />
share<br />
Chart 5 : Zain Saudi – revenue and revenue growth<br />
12.0<br />
20%<br />
5,000<br />
600%<br />
10.0<br />
18%<br />
16%<br />
4,500<br />
4,000<br />
500%<br />
8.0<br />
14%<br />
12%<br />
3,500<br />
3,000<br />
400%<br />
6.0<br />
10%<br />
2,500<br />
300%<br />
4.0<br />
8%<br />
6%<br />
2,000<br />
1,500<br />
200%<br />
2.0<br />
4%<br />
2%<br />
1,000<br />
500<br />
100%<br />
0.0<br />
2008A 2009A 2010E 2011F 2012F<br />
0%<br />
0<br />
2008A 2009A 2010E 2011F 2012F<br />
0%<br />
Zain KSA mobile subscribers (m) Zain KSA market share (%)<br />
Zain KSA revenue (SR m) Revenue growth (%)<br />
Source: Operators, CITC, <strong>Rasmala</strong> forecasts<br />
Source: Company data, <strong>Rasmala</strong> forecasts<br />
Expensive entry ticket<br />
Zain Saudi purchased its mobile licence for US$6.1bn (SR22.9bn), whereas Mobily (the second<br />
mobile player in Saudi Arabia) purchased its operating licence for US$3.45bn (SR13bn). This was<br />
almost half of what Zain Saudi paid, and at a time when mobile penetration was less than 100% –<br />
in other words, when prospects for growth were more promising.<br />
Zain Saudi | <strong>Investment</strong> View | 12 May 2010 6<br />
110
Profitability appears to be long-term<br />
Given our belief that Zain Saudi will face less than docile competition from STC and Mobily, we<br />
think that, as the third player, with a high entry cost, it will take longer to break even, particularly<br />
should either STC or Mobily resort to a price war. We forecast that Zain Saudi will yield a positive<br />
net profit by 2015 and positive free cash flow by 2013.<br />
Chart 6 : Zain Saudi – EBITDA and EBITDA margin<br />
Chart 7 : Zain Saudi – net profit and net profit margin<br />
1,500<br />
50%<br />
0<br />
0%<br />
1,000<br />
0%<br />
(500)<br />
-50%<br />
-100%<br />
500<br />
0<br />
(500)<br />
-50%<br />
-100%<br />
-150%<br />
-200%<br />
(1,000)<br />
(1,500)<br />
(2,000)<br />
(2,500)<br />
-150%<br />
-200%<br />
-250%<br />
-300%<br />
-350%<br />
(1,000)<br />
-250%<br />
(3,000)<br />
-400%<br />
-450%<br />
(1,500)<br />
2008A 2009A 2010E 2011F 2012F<br />
-300%<br />
(3,500)<br />
2008A 2009A 2010E 2011F 2012F<br />
-500%<br />
Zain KSA EBITDA (SR m)<br />
Zain KSA EBITDA margin<br />
Net profit (SR m)<br />
Net Profit margin<br />
Source: Company data, <strong>Rasmala</strong> forecasts<br />
Source: Company data, <strong>Rasmala</strong> forecasts<br />
Dividends unlikely<br />
Given our estimates that net income will turn positive beyond 2015, we do not foresee Zain Saudi<br />
making any dividend payments in the short to medium term.<br />
Debt overhang<br />
Zain Saudi had a large debt burden on its books as of December 2009, although this may be<br />
typical for a start-up company. However, given our concern regarding long-term positive cash<br />
flows, we are sceptical about how the company will repay this debt, particularly since Zain has<br />
already been non-compliant on certain covenants of its SR9.2bn syndicated loan (by failing to<br />
achieve certain operational targets in 2009). However, the lenders provided a waiver from this<br />
non-compliance subject to Zain Saudi providing revised financial milestones for the quarter ending<br />
31 December 2010. Zain Saudi was successful in its negotiations and gained approval for the new<br />
milestones late in 2009. The new repayment schedule lasts two years and Zain has the option to<br />
extend this twice by six months. Funds from the new facility will be used to refund the existing<br />
Murabaha, facilitating network expansion and the company’s growth.<br />
More funding may be needed in the longer term<br />
Given Zain Saudi’s aggressive plans to tackle the broadband market, we believe capex<br />
requirements may increase even more, particularly given that Mobily, with its more established<br />
network, is spending more aggressively on building its broadband network infrastructure. As<br />
management has indicated, Zain Saudi commenced its 4G LTE coverage programme in February<br />
2010 in collaboration with Huawei, Motorola and Ericsson to improve its network quality and<br />
capability, which may give rise to higher capex spending.<br />
Zain Saudi | <strong>Investment</strong> View | 12 May 2010 7<br />
111
Chart 8 : Zain Saudi – revenue and capex/revenue<br />
5,000<br />
4,500<br />
4,000<br />
3,500<br />
3,000<br />
2,500<br />
2,000<br />
1,500<br />
1,000<br />
500<br />
0<br />
2008A 2009A 2010E 2011F 2012F<br />
600%<br />
500%<br />
400%<br />
300%<br />
200%<br />
100%<br />
0%<br />
Zain KSA Revenue (SR m) CAPEX/revenue (%)<br />
Source: Company data, <strong>Rasmala</strong> forecasts<br />
That noted, we believe Zain Saudi may require more financing in the medium to long term, which<br />
could be obtained in the form of another refinancing facility, or through increased funding in the<br />
form of subordinated debt from the founding shareholders.<br />
The founding shareholders, which include Mobile Telecommunications Company K.S.C (part of<br />
the Zain Group), contributed up to SR2.2bn to Zain Saudi by year-end 2008, and extended this by<br />
SR2.9bn by year-end 2009, mainly through an increased contribution from the Zain Group,<br />
waiving all financing expenses related to the subordinated loan.<br />
Additionally, to date, repayment of the long-term portion of the loan, including the accrued<br />
financial charges, has not been scheduled beyond August 2011.<br />
Zain Saudi | <strong>Investment</strong> View | 12 May 2010 8<br />
112
Appendix<br />
Company overview<br />
Zain Saudi was the third mobile operator to enter the Saudi Arabian market after STC and Mobily.<br />
It launched commercial operations in August 2008 and offers voice, SMS and MMS services, as<br />
well as SIM applications, 3G and 3.5G services, and mobile broadband.<br />
Rapid early growth in the face of intense competition<br />
By end-2009, the company had achieved 13% market share and added 6m subscribers for the 16<br />
months it had been in operation. It also reported network coverage of 83% of the populated areas<br />
of the Kingdom. Zain Saudi operates only in its home market and has no subsidiaries or<br />
associates. It is part of the Zain Group, which holds 25% of the company. Zain Group (formerly<br />
MTC) is a mobile telecoms operator in the Middle East and North Africa.<br />
Given that mobile penetration in the Kingdom was 175% at end-2009 and Zain Saudi is a<br />
relatively new entrant to the market, it faces intense competition. Management therefore launched<br />
several campaigns even before the company started operations in an effort to capture market<br />
share. These pre-launch campaigns included a ‘Special Numbers Club‘ and a monthly draw.<br />
Under the Special Numbers programme, subscribers were able to reserve a phone number of<br />
their choice and received some free talk time and free SMS monthly. The monthly draw offered a<br />
host of valuable prizes to randomly selected customers who had subscribed to any of Zain Saudi’s<br />
offers.<br />
In its first four months of operation, the company captured more than 2m subscribers. In its 16<br />
months of operations so far, it has introduced many innovative packages to its customers and the<br />
latest technology to the Saudi market. It launched several packages targeting new mobile and<br />
broadband customers, such as the Visitor package, and the pay-per-day broadband package.<br />
Several packages were also introduced targeting the business sector. Zain Saudi introduced<br />
BlackBerry Internet services, among others, as well as the One Network system – a Zain Group<br />
initiative that allows Zain customers to take calls to any of the 16 countries within the Zain network<br />
at local rates. Zain Saudi continues to introduce the latest technology to the Saudi market, most<br />
recently trialling a 4G network rollout and introducing an HSPA Wi-Fi portable device.<br />
Chart 9 : Market share according to subscriber base, year-end 2009<br />
Zain KSA<br />
13%<br />
STC<br />
47%<br />
Mobily<br />
40%<br />
Source: Company data<br />
Zain Saudi | <strong>Investment</strong> View | 12 May 2010 9<br />
113
Income statement<br />
SRm FY08A FY09A FY10F FY11F FY12F<br />
Revenue 505.2 3004 3802 4263 4602<br />
Cost of sales -488.7 -2127 -2148 -1705 -1491<br />
Operating costs -1281 -1950 -2034 -2131 -2191<br />
EBITDA -1265 -1073 -380.2 426.3 920.5<br />
DDA & Impairment (ex gw) -434.7 -1394 -1515 -1561 -1581<br />
EBITA -1700 -2467 -1895 -1135 -660.8<br />
Goodwill (amort/impaired) 0.00 0.00 0.00 0.00 0.00<br />
EBIT -1700 -2467 -1895 -1135 -660.8<br />
Net interest -160.2 -632.4 -667.5 -667.5 -262.3<br />
Associates (pre-tax) 0.00 0.00 0.00 0.00 0.00<br />
Other pre-tax items -418.3 0.00 0.00 0.00 0.00<br />
Reported PTP -2278 -3099 -2563 -1802 -923.0<br />
Taxation 0.00 0.00 0.00 0.00 0.00<br />
Minority interests 0.00 0.00 0.00 0.00 0.00<br />
Other post-tax items 0.00 0.00 0.00 0.00 0.00<br />
Reported net profit -2278 -3099 -2563 -1802 -923.0<br />
Tot normalised items -418.3 0.00 0.00 0.00 0.00<br />
Normalised EBITDA -1265 -1073 -380.2 426.3 920.5<br />
Normalised PTP -1860 -3099 -2563 -1802 -923.0<br />
Normalised net profit -1860 -3099 -2563 -1802 -923.0<br />
Source: Company data, <strong>Rasmala</strong> Research forecasts<br />
year to Dec<br />
Balance sheet<br />
SRm FY08A FY09A FY10F FY11F FY12F<br />
Cash & market secs (1) 583.5 505.8 555.8 403.9 395.8<br />
Other current assets 598.1 1344 1612 1761 1868<br />
Tangible fixed assets 2409 3847 6308 8683 10834<br />
Intang assets (incl gw) 23075 22133 21648 21145 20175<br />
Oth non-curr assets 0.00 0.00 0.00 0.00 0.00<br />
Total assets 26665 27830 30124 31993 33272<br />
Short term debt (2) 0.00 0.00 4785 9744 12553<br />
Trade & oth current liab 13090 6789 6860 5573 14460<br />
Long term debt (3) 1849 12408 12408 12408 2914<br />
Oth non-current liab 4.40 10.4 10.4 10.4 10.4<br />
Total liabilities 14944 19208 24064 27735 29938<br />
Total equity (incl min) 11722 8622 6060 4257 3334<br />
Total liab & sh equity 26665 27830 30124 31993 33272<br />
Net debt 10745 11902 16638 21748 15071<br />
Source: Company data, <strong>Rasmala</strong> Research forecasts<br />
year ended Dec<br />
Cash flow statement<br />
SRm FY08A FY09A FY10F FY11F FY12F<br />
EBITDA -1265 -1073 -380.2 426.3 920.5<br />
Change in working capital 217.6 2066 -196.6 -1436 -714.4<br />
Net interest (pd) / rec -290.9 -632.4 -667.5 -667.5 -262.3<br />
Taxes paid 0.00 0.00 0.00 0.00 0.00<br />
Other oper cash items 0.00 0.00 0.00 0.00 0.00<br />
Cash flow from ops (1) -1338 361.4 -1244 -1677 -56.2<br />
Capex (2) -2498 -1892 -3042 -2984 -2761<br />
Disposals/(acquisitions) -23421 0.00 0.00 0.00 0.00<br />
Other investing cash flow 65.9 3.00 -449.2 -449.2 0.00<br />
Cash flow from invest (3) -25853 -1889 -3491 -3433 -2761<br />
Incr / (decr) in equity 14000 0.00 0.00 0.00 0.00<br />
Incr / (decr) in debt 0.00 0.00 0.00 0.00 0.00<br />
Ordinary dividend paid 0.00 0.00 0.00 0.00 0.00<br />
Preferred dividends (4) 0.00 0.00 0.00 0.00 0.00<br />
Other financing cash flow 13775 1450 4785 4958 2810<br />
Cash flow from fin (5) 27775 1450 4785 4958 2810<br />
Forex & disc ops (6) 0.00 0.00 0.00 0.00 0.00<br />
Inc/(decr) cash (1+3+5+6) 583.4 -77.7 50.0 -151.9 -8.09<br />
Equity FCF (1+2+4) -3836 -1531 -4286 -4661 -2818<br />
Source: Company data, <strong>Rasmala</strong> Research forecasts<br />
year to Dec<br />
Zain Saudi | Key Financial Data | 12 May 2010<br />
114
Equity | United Arab Emirates | Telecommunications<br />
12 May 2010<br />
Initiation of coverage<br />
Hold<br />
Target price<br />
Dh2.35<br />
Price<br />
Dh2.60<br />
Short term (0-60 days)<br />
n/a<br />
Market view<br />
No Weighting<br />
Price performance<br />
(1M) (3M) (12M)<br />
Price (Dh) 2.89 3.03 2.78<br />
Absolute (%) -10.0 -14.2 -6.5<br />
Rel market (%) -8.8 -19.1 -11.7<br />
Rel sector (%) 0.6 0.3 2.7<br />
May 07 Apr 08 Apr 09<br />
8<br />
6<br />
4<br />
2<br />
0<br />
DU.DU<br />
Market capitalisation<br />
Dh10.40bn (€2.23bn)<br />
DFM General Index<br />
Average (12M) daily turnover<br />
Dh5.00m (US$1.37m)<br />
Sector: DFM Telecoms<br />
RIC: DU.DU, DU UH<br />
Priced Dh2.60 at close 6 May 2010.<br />
Source: Bloomberg<br />
Du<br />
Solid operator, suitably priced<br />
We initiate coverage of Emirates Integrated Telecommunications Company (Du)<br />
with a Hold rating and a 12-month target price of Dh2.35 per share. To derive our<br />
target price, we use equally weighted peer multiple and DCF valuations.<br />
Key forecasts<br />
FY08A FY09A FY10F FY11F FY12F<br />
Revenue (Dhm) 3,951 5,339 6,290 7,188 8,101<br />
EBITDA (Dhm) 399.7 1,108 1,540 2,294 2,921<br />
Reported net profit (Dhm) 4.12 264.1 468.8 824.7 1,125<br />
Normalised net profit (Dhm) 4.12 264.1 468.8 824.7 1,125<br />
Normalised EPS (Dh) 0 0.07 0.12 0.21 0.28<br />
Dividend per share (Dh) 0 0 0 0 0<br />
Dividend yield (%) 0 0 0 0 0<br />
Normalised PE (x) 2,522 39.4 22.2 12.6 9.25<br />
EV/EBITDA (x) 29.8 11.3 8.39 5.66 4.13<br />
EV/invested capital (x) 2.97 2.55 2.24 1.95 1.76<br />
ROIC - WACC (%) -12.7 -4.73 -2.2 2.67 5.28<br />
Accounting standard: Local GAAP<br />
Source: Company data, <strong>Rasmala</strong> Research forecasts<br />
year to Dec, fully diluted<br />
A solid telecommunications operator with a focus on the UAE<br />
In two short years, Du has managed to grab 30% market share in the UAE and compete<br />
effectively with Etisalat. The company has gained traction with customers through pricing and<br />
product differentiation. Etisalat had been the only operator in the UAE from 1976 until 2007,<br />
when Du entered the market.<br />
Suitably priced, in our view<br />
Du should benefit from broadband uptake as it operates in a country with low penetration<br />
(14.7%), but we believe this has already been priced into the stock. It trades at 22x and 8.8x<br />
our 2010 EPS and EBITDA estimates. The market is paying nearly US$950 per subscriber,<br />
which looks high compared with Du’s MENA peers.<br />
Churn set to increase while ARPU decreases<br />
We believe the company will see increasing churn and declining ARPU. It ended 2009 with<br />
3.9m subscribers in its mobile and fixed-line businesses combined, with a blended ARPU of<br />
about US$30. The UAE has a population of 4.8m, and the total of mobile and fixed<br />
subscribers in the market has reached about 12.8m. We expect subscriber additions to be<br />
limited.<br />
Analyst<br />
Shrouk Diab<br />
+20 1 9991 6882<br />
shrouk.diab@rasmala.com<br />
Dubai International Financial Centre,<br />
The Gate Village, Building 10, Level 1,<br />
P.O. Box 31145, Dubai, United Arab<br />
Emirates<br />
www.rasmala.com<br />
Liquidity constraints look likely in 2011<br />
Du’s cash flows and balance sheet look solid in 2010, assuming the company is successful<br />
with its planned Dh1bn rights issue. We expect 2011 to be more challenging as the<br />
company’s Dh3bn secured bank loan is to be fully repaid in June. Du will probably be able to<br />
roll over at least a portion of this, but we doubt it will be priced better than the current Eibor +<br />
1.25% level.<br />
Important disclosures can be found in the Disclosures Appendix.<br />
Distributed outside MENA by The Royal <strong>Bank</strong> of Scotland N.V. and its affiliates under a strategic<br />
alliance with <strong>Rasmala</strong> <strong>Investment</strong> <strong>Bank</strong> Ltd.
<strong>Investment</strong> view<br />
We initiate coverage of Emirates Integrated Telecommunications Company (Du) with a Hold<br />
rating and a 12-month target price of Dh2.35 per share. To arrive at our target price, we use<br />
equally weighted peer multiple and DCF valuations.<br />
Limited growth opportunities in<br />
the UAE<br />
Need for additional capital<br />
Earnings momentum<br />
The UAE has the highest mobile penetration rate in our coverage universe, at nearly 215%. This<br />
has been driven by multiple SIM card holders and the UAE’s status as a MENA business hub. The<br />
UAE’s two main airports - Dubai and Abu Dhabi – handled a combined 50 million passengers last<br />
year, and we expect this level to be sustained. While we have modelled modest subscriber growth<br />
in 2010, we expect to see a slowdown in subscriber additions.<br />
Since becoming operational in 2007, Du has been playing capex catch-up with Etisalat. Last year,<br />
Etisalat’s capex was Dh5.5bn, more than Du’s total revenues for the year. With Dh3bn in loans<br />
due in June 2011 and an aggressive spending plan, we expect Du will need to raise more capital.<br />
Du turned EBITDA positive in 2008, with margins at 10.1%. In 2009, the company improved<br />
margins by more than 10 percentage points to 20.8%. We have modelled for another year of<br />
margin expansion in 2010, reaching 24.5%. This compares with Etisalat’s EBITDA margin in the<br />
UAE (before federal royalties) of about 65%. We do not believe Du will be able to attain Etisalat’s<br />
margins.<br />
Valuation and target price<br />
Du’s DCF valuation yields a 12-month fair value of Dh2.76 per share, which is 6% higher than the<br />
current trading price of Dh2.6 per share. Our assumptions included a cost of equity of 10.5%,<br />
based on a risk-free rate of 4.5% and a premium of 6.0%, cost of debt of 5%, a terminal growth<br />
rate of 2.5% and a beta of 1x.<br />
Table 1 : DCF approach<br />
(Dh m) Free cash flow PV of FCF<br />
2010 -524 -551<br />
2011 -223 -257<br />
2012 781 619<br />
2013 979 692<br />
2014 957 606<br />
2015 1,522 872<br />
Terminal value 19,497 11,173<br />
Enterprise value 13,149<br />
Minus: net debt 2,131<br />
Equity value 11,018<br />
Number of shares (000) 4,000<br />
12-month fair value per share 2.76<br />
Source: <strong>Rasmala</strong> estimates<br />
We have also employed a sensitivity analysis, with different rates for both the cost of equity and<br />
terminal growth rate, to illustrate how sensitive our DCF valuation is to changes in these<br />
assumptions.<br />
Table 2 : DCF sensitivity analysis (value per share, Dh)<br />
Terminal growth rate<br />
Cost of equity<br />
Dh/share 8.5% 9.5% 10.5% 11.5% 12.5%<br />
0.5% 3.05 2.55 2.15 1.83 1.56<br />
1.5% 3.52 2.90 2.42 2.04 1.73<br />
2.5% 4.14 3.35 2.76 2.30 1.93<br />
3.5% 5.01 3.95 3.18 2.62 2.18<br />
4.5% 6.32 4.78 3.76 3.03 2.49<br />
Source: <strong>Rasmala</strong><br />
Du | <strong>Investment</strong> View | 12 May 2010 2<br />
116
Peer valuation<br />
The average FY10 and FY11 PEs of our peer group are 13.1x and 11.5x, based on Bloomberg<br />
consensus. We use these to arrive at our target price of Dh1.96 per share, which is 25% lower<br />
than the current trading share price of Dh2.6 per share.<br />
Table 3 : Estimated 2010 and 2011 PEs for telecom peers<br />
Peers 2010 2011<br />
Telefonos de Mexico 8.8 8.5<br />
Reliance Industries 19.6 14.1<br />
Telekom Malaysia 23.1 21.3<br />
Globe Telecom Inc 9.8 9.4<br />
Advanced Info Service 12.8 12.3<br />
Indosat TBK 17.7 14.9<br />
MTN Group 10.48 8.8<br />
Excelcomindo Pratama 15.4 12.4<br />
Turkcell Iletisim Hizmet 10.5 9.7<br />
Vodacom Group 10.53 9.2<br />
Bharti Airtel 12.3 13.2<br />
America Movil SAB de C 13.0 11.7<br />
China Telecom Corp 17.7 14.6<br />
Celtel Zambia 10.6 9.7<br />
Magyar 9.2 9.4<br />
Turk Telekomunikasyon 9.3 8.5<br />
Mobile Telesystems 12.6 7.8<br />
Average 13.1 11.5<br />
Source: Bloomberg<br />
How we differ from consensus<br />
Our revenue forecasts are below Bloomberg consensus by 2% for 2010 and are in line with 2011<br />
revenue consensus forecasts. Our EBITDA estimates are below Bloomberg consensus by Dh27m<br />
for 2010 and Dh303m for 2011. We assume this is due to a combination of lower ARPU and<br />
subscriber numbers built into our forecasts.<br />
Risks to central scenario<br />
If number portability has a meaningful impact on market share, Du could beat our subscriber<br />
estimates, as its leading innovative services should draw subscribers away from other networks.<br />
However, we have seen no significant share shifts as a result of number portability in the past,<br />
and would therefore be surprised if this were to happen now. Additionally, we would expect Du to<br />
use appropriately timed and attractive promotions to offset any ARPU declines with subscriber<br />
gains.<br />
Du is positioned to capitalise on broadband growth in the UAE. If the company executes its<br />
broadband and mobile broadband strategy well, it could beat our estimates. As we mentioned<br />
earlier, we believe that, at current multiples, the market has already priced in this growth potential.<br />
Our main concern is a potential price war in the UAE. Etisalat appears better capitalised and could<br />
sustain a long pricing battle with Du, although this could significantly deplete EBITDA for both<br />
companies, with the UAE market representing 95% of Etisalat’s EBITDA and 100% of Du’s.<br />
A significant increase in the number of expats leaving Dubai is also a risk to our bullish view on<br />
the company. With mobile penetration already exceeding 200%, we find it difficult to imagine that<br />
penetration will grow as aggressively as it has done in the past. It is critical that the company<br />
retains subscribers, in our view.<br />
Federal royalty may decrease<br />
Du is currently paying an annual federal royalty amounting to 50% of its net profit. There are<br />
ongoing negotiations with the UAE Government to reduce this to 40%, although there is no clarity<br />
as yet on the progress made on these negotiations. That noted, we have not factored any<br />
reduction in federal royalty payments into our forecasts, since no time horizon can be determined<br />
as yet, and a decrease would increase our valuation of Du, all else being equal.<br />
Du | <strong>Investment</strong> View | 12 May 2010 3<br />
117
Company dynamics<br />
The key value driver for Du in the long term, in our view, would be increasing ARPU levels<br />
through the provision of more value-added services, a decrease in churn rates and the<br />
close monitoring of costs.<br />
Growth potential in the UAE is<br />
limited<br />
Due to the ongoing economic crisis, much of the expat population has left the UAE, resulting in a<br />
decline in headline population count. Since Du is a local play, unlike its local rival, Etisalat, we<br />
believe net subscriber additions will be challenging. The key value drivers for Du in the long term,<br />
in our view, will be increasing ARPU levels through the provision of more value-added services<br />
and maintaining its current customer base.<br />
We believe that if the economic climate in the UAE improves, this may result in a return of the<br />
expat population, and consequently increase headline population count – an upside surprise on<br />
which Du could capitalise.<br />
Strong ability to capture market<br />
share<br />
Chart 1 : UAE mobile subscriber and penetration<br />
16.0<br />
14.0<br />
12.0<br />
250%<br />
200%<br />
10.0<br />
8.0<br />
150%<br />
6.0<br />
4.0<br />
2.0<br />
0.0<br />
2007A 2008A 2009A 2010E 2011F 2012F<br />
Total mobile subscribers (m) Penetration (%)<br />
`<br />
100%<br />
50%<br />
0%<br />
Source: Company data, TRA, ITU, EIU, <strong>Rasmala</strong> forecasts<br />
Strong capitalisation on highspeed<br />
data opportunity<br />
Since its operational launch in February 2007, Du has accounted for most net subscriber additions<br />
in the UAE, acquiring almost 70% of total net mobile additions in 2009, thanks its ability to roll out<br />
innovative services. By year-end 2009, Du had a 31% market share. With the introduction of<br />
mobile number portability, we believe Du may see additional subscribers. We expect this trend to<br />
continue, with Du maintaining the upper hand in net subscriber addition, given its focus in the<br />
medium to long term on building its post-paid subscriber segment and retaining its existing<br />
subscriber base.<br />
Chart 2 : Du – mobile subscribers (m) and market share<br />
Chart 3 : Du – revenue and revenue growth<br />
6.0<br />
45%<br />
9,000<br />
180%<br />
5.0<br />
40%<br />
35%<br />
8,000<br />
7,000<br />
160%<br />
140%<br />
4.0<br />
30%<br />
6,000<br />
120%<br />
3.0<br />
2.0<br />
`<br />
25%<br />
20%<br />
15%<br />
5,000<br />
4,000<br />
3,000<br />
`<br />
100%<br />
80%<br />
60%<br />
1.0<br />
10%<br />
5%<br />
2,000<br />
1,000<br />
40%<br />
20%<br />
0.0<br />
2008A 2009A 2010E 2011F 2012F<br />
0%<br />
0<br />
2008A 2009A 2010E 2011F 2012F<br />
0%<br />
Du mobile subscribers<br />
Du market share<br />
Du revenue (AED m) Revenue growth (%)<br />
Source: Company data, <strong>Rasmala</strong> forecasts<br />
Source: Company data, <strong>Rasmala</strong> forecasts<br />
Du | <strong>Investment</strong> View | 12 May 2010 4<br />
118
Given our expectation of the strong uptake in broadband services, we believe there is substantial<br />
potential for Du to capitalise on this segment. Current broadband penetration in the UAE is 14.7%,<br />
which puts the UAE farther along the growth curve than other countries in MENA. Du, of course,<br />
would benefit from this trend. In an effort to capitalise on the growing demand for high-speed data<br />
and multimedia services, Du intends to invest significantly in expanding its traffic capacity, as<br />
most of its coverage capex is now complete. The company has announced its interest in digital<br />
content, with the expectation of three to four joint ventures of this nature being announced soon,<br />
according to management.<br />
Chart 4 : Du – revenue breakdown, 2009<br />
Chart 5 : Du – revenue breakdown, 2012F<br />
Fixed<br />
18%<br />
Others<br />
12%<br />
Fixed<br />
17%<br />
Others<br />
13%<br />
Mobile<br />
70%<br />
Mobile<br />
70%<br />
Source: Company data, <strong>Rasmala</strong><br />
Network and Infrastructure<br />
Source: Company data, <strong>Rasmala</strong><br />
Infrastructure spending and network upgrades have been the main focus for Du since its launch,<br />
enabling it to reach a level at which it was able to comfortably target high-net-worth subscribers.<br />
During 2009, the company added 717 2G sites, extending coverage to 99% of the UAE’s<br />
population, along with an extra 786 3G sites to achieve population coverage of more than 80%.<br />
We believe broadband penetration in the UAE is right at the tipping point where penetration will be<br />
exponential rather than linear.<br />
Chart 6 : Du – fixed subscribers and market share<br />
Chart 7 : Du – revenue and capex/revenue<br />
0.3<br />
14%<br />
9,000<br />
70%<br />
0.2<br />
0.2<br />
12%<br />
10%<br />
8%<br />
8,000<br />
7,000<br />
6,000<br />
5,000<br />
60%<br />
50%<br />
40%<br />
0.1<br />
6%<br />
4,000<br />
30%<br />
0.1<br />
4%<br />
2%<br />
3,000<br />
2,000<br />
1,000<br />
20%<br />
10%<br />
0.0<br />
2008A 2009A 2010E 2011F 2012F<br />
0%<br />
0<br />
2008A 2009A 2010E 2011F 2012F<br />
0%<br />
Du fixed subscribers (m) Du market share (%)<br />
Du Revenue (AED m) Capex/revenue (%)<br />
Source: Company data, <strong>Rasmala</strong> estimates and forecasts<br />
Source: Company data, <strong>Rasmala</strong> estimates and forecasts<br />
Management plans to spend between Dh2.2bn and Dh2.4bn on infrastructure development in<br />
2010. Dh1.3bn of this will be directed towards the mobile segment, Dh0.8bn towards fixed line<br />
and broadcast, and the remaining Dh100m-300m for IT development. The infrastructure-sharing<br />
agreement between Du and Etisalat, which is in its final stages, would enable Du to expand its<br />
fixed-line arm of operations to other emirates beyond its primary market in Dubai.<br />
In terms of cost control, management is undertaking an outsourcing initiative for its overheads to<br />
continue to rationalise costs. Areas of outsourcing include call centres, certain areas of IT<br />
development and retail.<br />
Du | <strong>Investment</strong> View | 12 May 2010 5<br />
119
We believe that Du’s commitment towards offering value-added services will lead to an increase<br />
in customer loyalty and, accordingly, may mitigate annual churn, which should aid the company’s<br />
profitability. Margins have already been improving on an annual basis, reaching 21% at year-end<br />
2009 compared with 10% at year-end 2008. We forecast that margins will improve to 24% at yearend<br />
2010, supported by both operational cost efficiency and improved customer usage of valueadded<br />
services.<br />
Chart 8 : Du – EBITDA and EBITDA margin<br />
Chart 9 : Du – net profit and net profit margin<br />
3,500<br />
40%<br />
1,200<br />
16%<br />
3,000<br />
35%<br />
1,000<br />
14%<br />
2,500<br />
2,000<br />
1,500<br />
1,000<br />
500<br />
`<br />
30%<br />
25%<br />
20%<br />
15%<br />
10%<br />
5%<br />
800<br />
600<br />
400<br />
200<br />
`<br />
12%<br />
10%<br />
8%<br />
6%<br />
4%<br />
2%<br />
0<br />
2008A 2009A 2010E 2011F 2012F<br />
0%<br />
0<br />
2008A 2009A 2010E 2011F 2012F<br />
0%<br />
Du EBITDA (AED m)<br />
Du EBITDA margin<br />
Net profit (AED m)<br />
Net profit margin<br />
Source: Company data, <strong>Rasmala</strong> estimates and forecasts<br />
Source: Company data, <strong>Rasmala</strong> estimates and forecasts<br />
Decrease in federal royalty could<br />
increase our valuation<br />
A potential reduction in the annual federal royalty Du pays, currently amounting to 50% of its net<br />
profit, could increase our valuation (see our comments under ‘Risks to central scenario’ on page<br />
3).<br />
Liquidity constraints and debt refinancing<br />
Du is already in the process of raising additional capital through a recently announced rights issue<br />
(see details below). It intends to raise Dh1bn to help with its capex plans for this year. It also has<br />
Dh3bn in loans due in June 2011 (of which 84% is denominated in UAE dirhams and the<br />
remaining portion is in US dollars) . We believe it will be difficult for the company to roll this debt<br />
over at terms as favourable as 1.25% over Eibor, the current rate.<br />
Given the company’s aggressive expansion strategy, on both the mobile and fixed fronts, it is<br />
seeking different methods of refinancing to fund its growth plans by rebalancing its capital<br />
structure such that it is capable of achieving an investment-grade rating in the future.<br />
The company has already secured a €200m vendor financing agreement and has proposed a<br />
Dh1bn rights issue to obtain a better leverage structure, with management indicating that it will<br />
further explore bank funding as additional financing means. All in all, Du is targeting a 50-50<br />
debt/equity capital structure, with expected net debt/EBITDA dropping from 2.0x (pre-rights issue)<br />
to 1.1x (post rights issue).<br />
Rights issue details<br />
Du announced on 19 April 2010 that it intends to raise Dh1bn through a rights issue. According to<br />
management, the capital raised will be directed towards infrastructure to fund the company’s<br />
growth strategy. An extraordinary general meeting is due to be held on 11 May to approve the<br />
increase in the company’s share capital and the issue of new shares to shareholders on a pro rata<br />
basis. If approved, the rights issue subscription period is expected to start on 27 May and end on<br />
8 June. The final subscription price has not yet been determined, the range will be from Dh1.00 to<br />
Dh1.91 per new share, with Dh1.00 being the minimum price allowed by law and Dh1.91 being<br />
the maximum price recommended by Du’s board of directors for shareholder approval.<br />
The founding shareholders (EIA, Mubadala and ECT), which together hold about 80% of the<br />
company’s shares, have irrevocably committed to subscribe to their share. They have also<br />
committed to subscribe to any unsubscribed shares – pro rata to their respective holdings – after<br />
all other shareholders have subscribed to new shares and had the opportunity to subscribe to any<br />
surplus new shares.<br />
Du | <strong>Investment</strong> View | 12 May 2010 6<br />
120
Financial review<br />
In 2008, Du reported its first profitable year, with total revenue reaching Dh3.9bn and EBITDA of<br />
Dh494m. In 2009, the company reported revenue of Dh5.4bn. The increase was driven by an<br />
increase in subscribers in the mobile segment of 41% to 3.5m.<br />
In 2009, the cost of sales increased 27.2% from 2008 levels, while operating expenses climbed<br />
26.3%. EBIT margins (calculated as operating income plus royalty fees over revenue) improved to<br />
8.7%, from a negative 2.6% in the previous year.<br />
Interest expenses climbed 40.9% yoy in 2009 as Du increased borrowings throughout 2008 and<br />
2009, chiefly to support its expansion programmes.<br />
With regard to other income, note that in 2007, Du signed an agreement to vacate one of its<br />
operational sites and accounted for income of Dh49m in 2009 related to this agreement. In<br />
addition, it charged around Dh7m to the income statement in respect of accelerated depreciation<br />
on the assets relating to this site.<br />
Royalty payments increased significantly during 2009 to Dh264m. The company has provided for<br />
a potential royalty charge in the current and prior year, estimated at 50.0% of the annual net profit.<br />
This estimate of 50% is based on the current practise followed by other UAE telecoms operators.<br />
It should be noted that the TRA is supervising negotiations between Etisalat and Du to reduce<br />
service fees. This could lead to a reduction in charges.<br />
In 2009, average return on equity increased to 10.0%, from 0.2% in 2008, due to increased net<br />
earnings.<br />
Net operating cash flow of Dh973m in 2009 represented an EBITDA conversion of 91.6%. Free<br />
cash flow was negative Dh745.2m in 2009 compared with negative Dh1.7bn in 2008. It is worth<br />
noting that capex decreased 21% in 2009 compared with 2008.<br />
As a percentage of revenues, capex declined to 32% in 2009 from 55% in 2008. The company<br />
expects capex to be in a range of Dh2.2bn-2.4bn in 2010.<br />
Property, plant and equipment increased by 42.6% yoy in 2009 due to the addition of 717 2G<br />
sites, extending coverage to 99.0% of the UAE’s population, along with an additional 786 3G sites<br />
that resulted in coverage of over 80.0% of the population.<br />
Du | <strong>Investment</strong> View | 12 May 2010 7<br />
121
Appendix<br />
Company overview<br />
Du operates through two segments: 1) Commercial; and 2) International and Wholesale. The<br />
Commercial segment offers both mobile and fixed-line services to residential and business<br />
customers, in addition to IPTV and broadband services. The International and Wholesale segment<br />
offers effective routing for the group's international traffic.<br />
Table 4 : Commercial segment<br />
Mobile<br />
Payment plans such as Elite plan, pay as you go and<br />
visitor mobile plan<br />
Handsets - iPhone and Blackberry<br />
Broadband<br />
Roaming facilities in 130 countries<br />
Fixed line<br />
Land line<br />
Broadband<br />
Pay TV services includes HD TV, video on demand and<br />
TV service upgrade<br />
Home plus package - a starter package giving benefit of<br />
all three home services: landline, broadband and TV<br />
Source: Company data<br />
In 2009, Du reported a 42% yoy increase in mobile revenue, with 3.5m total mobile subscribers. It<br />
currently has a 30% market share in a country where mobile penetration is already over 200%.<br />
Management expects to capture greater market share with the introduction of mobile number<br />
portability. It also expects to formalise its infrastructure sharing agreement with Etisalat, which<br />
could help reduce costs for the company going forward.<br />
Etisalat is Du’s only competitor at present and has a 70% market share in the country. In early<br />
March 2010, Yahsat became the third player in this market (for more detail see the UAE telecom<br />
market overview at the end of the thematic section of this report).<br />
Commercial segment<br />
The Commercial segment accounted for around 83.7% of Du’s total revenues as of end-2009.<br />
This segment offers both mobile and fixed-line services to residential and business customers. It<br />
also offers IPTV and broadband services. Mobile services include wireless telephony, mobile TV,<br />
video calls, video mail, and mobile broadband.<br />
Subscriber growth in this segment has been strong. However, we expect a material slowdown<br />
going forward, driven by churn. While we understand how the UAE has been able to achieve such<br />
high penetration rates in mobile services, we believe that the current macro environment will have<br />
a negative impact on the number of total subscribers going forward.<br />
Chart 10 : Subscriber growth in the mobile and fixed-line sectors<br />
4,500<br />
000<br />
4,000<br />
3,500<br />
3,000<br />
2,500<br />
2,000<br />
1,500<br />
1,000<br />
500<br />
46<br />
1223<br />
184<br />
1,404<br />
218<br />
1,849<br />
248<br />
2,077<br />
280<br />
2,466<br />
311<br />
329<br />
2,750 2,906<br />
358<br />
3,139<br />
406<br />
3,477<br />
0<br />
4Q07 1Q08 2Q08 3Q08 4Q08 1Q09 2Q09 3Q09 4Q09<br />
Mobile*<br />
Fixed**<br />
*Mobile – Includes both post and pre-paid customers.<br />
**Fixed – Includes fixed line telephony, TV and broadband.<br />
Source: Company data, <strong>Rasmala</strong><br />
Du | <strong>Investment</strong> View | 12 May 2010 8<br />
122
In 2009, the Commercial segment’s revenue grew 33.8% to Dh4.5bn. Within this, mobile revenue<br />
grew 44.8% yoy to Dh3.3bn with the number of mobile subscribers up 41%. A number of new<br />
initiatives in this segment helped add value for customers and, consequently, increased revenue.<br />
These included the launch of the Apple iPhone 3G and iPhone 3GS in the UAE during October<br />
2009. The company also launched Blackberry enterprise solutions targeting small- to mid-size<br />
businesses.<br />
Fixed line, including fixed telephony, TV, and broadband, accounted for Dh970m in revenue<br />
(405,900 lines for the full year) in 2009.<br />
International and Wholesale business segment<br />
The International and Wholesale segment provides voice and data connectivity to international<br />
telecommunications operators and manages international roaming, data, IP and voice<br />
interconnections. In 2009, the segment’s revenue grew 42.3% to Dh870.8m, with broadcasting<br />
achieving Dh145.4m in revenue, up 21.0% from 2008 levels.<br />
The segment offers roaming services through over 350 leading telecoms operators in 120<br />
countries. In 2008, Du invested in the Europe India Gateway cable, the first direct, highbandwidth,<br />
optical-fibre submarine cable system from the UK to India. The system should<br />
significantly enhance the capacity and diversity between the countries in these regions and bring<br />
considerable bandwidth into the Middle East, while providing global access to operators in the<br />
region.<br />
Moreover, in the same year, Du began testing its in-flight connectivity services with ‘OnAir’, a<br />
pioneering provider of mobile phone services to airlines.<br />
Company history<br />
Du was incorporated at end-2005 with investments by the UAE federal government (50%),<br />
Mubadala Development Company (25.0%) and Emirates Communications and Technology<br />
Company (25.0%). Subsequently, Du acquired Sama Communications Company (Samacom),<br />
DIC Telecom International Operations Limited and the technology division of Tecom <strong>Investment</strong>s<br />
FZ LLC on 31 December 2005.<br />
In February 2006, the UAE’s Telecommunications Regulatory Authority and Du signed a 20-year<br />
licence to provide wireline, wireless, international and data telecommunications services across<br />
the entire country. In the same month, the company successfully launched the ‘du’ brand.<br />
In April 2006, Du was listed on the Dubai Financial Market through the sale of 20.0% of the issued<br />
and paid-up share capital.<br />
In 2007, Du launched its commercial mobile and call select services in the UAE. In 2008, after<br />
three years of operations, Du reported its first profitable full year and reached a mobile subscriber<br />
base of 2.5m.<br />
Du | <strong>Investment</strong> View | 12 May 2010 9<br />
123
Figure 1 : Company timeline of events<br />
Du signs a Partner<br />
Market Agreement<br />
with Vodafone<br />
Adopts HSPA+ from<br />
Huawei technology<br />
to increase mobile<br />
bandwidth by 200%<br />
31st December<br />
2005 – EITC<br />
acquires business<br />
and assets of Sama<br />
Communications<br />
Company, DIC<br />
Telecom<br />
(International<br />
Operations) and its<br />
Technology division<br />
EITC signed an<br />
interconnection<br />
agreement with<br />
Etisalat<br />
EITC underwent an<br />
IPO on the Dubai<br />
Financial Market<br />
(DFM)<br />
Launch of its Brand<br />
“du”<br />
UAE’s second<br />
telecom license was<br />
awarded to Du for a<br />
fixed and mobile<br />
telephony network<br />
Du reaches 1.5<br />
million mobile<br />
subscribers<br />
The company<br />
announced its 3.5G<br />
mobile broadband<br />
service<br />
Introduction of<br />
HomeCam service<br />
Du launches Call<br />
Select and mobile<br />
services<br />
Du reports its first<br />
profitable full year<br />
Du reaches 2.5<br />
million mobile<br />
subscribers<br />
Du entered into a<br />
construction and<br />
maintenance<br />
agreement to build<br />
optical-fiber<br />
submarine cable<br />
system<br />
The company signs<br />
an interconnection<br />
agreement with<br />
PCCW Global<br />
Introduced a<br />
Blackberry solution<br />
and entered in to an<br />
agreement with<br />
Apple to introduce<br />
the iPhone to UAE<br />
Entered into a<br />
partnership with<br />
Cisco<br />
Du opens a Point of<br />
Presence (PoP) at<br />
the Epsilon Global<br />
Hub in London and<br />
announces plans for<br />
establishing multiservice<br />
nodes in<br />
Hong Kong,<br />
Mumbai and Los<br />
Angeles<br />
Du to offer more<br />
services in 2010 and<br />
move outside UAE<br />
Llaunches<br />
international toll-free<br />
service in UAE<br />
Gulf Bridge<br />
International has<br />
signs an agreement<br />
with EITC<br />
Lnks deal with<br />
Dubai Municipality<br />
as the exclusive<br />
mobile and<br />
BlackBerry smart<br />
phone provider for<br />
Dubai Municipality<br />
2005 2006 2007 2008 2009 2010<br />
Source: Company data, Reuters Knowledge, <strong>Rasmala</strong><br />
Launch of the brand: In February 2006, Du unveiled its new brand ‘du’, under which it would<br />
provide integrated communications solutions, including voice, data and video content over fixed<br />
and mobile networks to individuals and businesses.<br />
IPO: Du launched an IPO when the founding shareholders agreed to offer 20.0% of the<br />
company’s shareholding to the public. Following the IPO, Du’s shareholding structure changed to<br />
a 40.0% holding by the federal government, 20.0% by Mubadala Development Company and<br />
20.0% by Emirates Communications and Technology Company.<br />
Interconnection agreement with Etisalat: The agreement that Du signed with Etisalat at end-<br />
2006 allows the two operators' networks to exchange calls and obtain other services from each<br />
other.<br />
Agreement with PCCW Global: PCCW Global, a subsidiary of Hong Kong's telecommunications<br />
provider PCCW Limited, entered into a network service agreement to interconnect with Du in<br />
2008. Both companies will cooperate in establishing an MPLS node in Dubai to extend PCCW<br />
Global's infrastructure into the UAE, and in allowing Du to access PCCW Global's worldwide<br />
network.<br />
Cable construction and maintenance: In May 2008, Du entered into a construction and<br />
maintenance agreement to build the first direct, high-bandwidth, optical-fibre submarine cable<br />
system from the UK to India, called the Europe India Gateway (EIG) cable system.<br />
PoPs and multi-service nodes: The multi-service nodes should allow global carriers to<br />
interconnect to the Du network for international long-haul ethernet and IP VPN data services and<br />
for efficient aggregation and termination of international voice services. The service node<br />
expansion allows Du’s customers to effectively extend their reach to the GCC region and the<br />
broader Middle East. The Point of Pressure (PoP) in London should allow for a swift, efficient, and<br />
cost-effective connection to the Du IP network for carriers to provide services to their clients<br />
based in the GCC and Middle East regions.<br />
Agreement with Vodafone: In January 2010, Vodafone added Du to its Partner Market<br />
Programme. In exchange, Vodafone is to provide Du with improved voice and data roaming<br />
access across 67 countries. Following this agreement, Vodafone customers visiting the UAE are<br />
given extended network coverage and access to Du’s advanced 3G network.<br />
Du adopts HSPA+ technology: Adopted from Huawei in November 2009, this high-speed<br />
technology should usher in a new era for mobile broadband, making a vast range of applications<br />
Du | <strong>Investment</strong> View | 12 May 2010 10<br />
124
and services available to on-the-go consumers. Starting in 2010, Du’s customers enjoy an<br />
approximate 200.0% increase in mobile bandwidth, making downloading, uploading, and other<br />
online activities much faster. HSPA+ can deliver peak download rates of 21Mbps and is an<br />
effective bridge to long-term evolution (LTE) technology – a standard that a number of leading<br />
operators in North America, Asia and Europe have committed to deploy as the next generation of<br />
mobile broadband.<br />
Launch of iPhone in UAE: In October 2009, Du and Apple reached an agreement to bring<br />
iPhone 3G and iPhone 3GS to the UAE by the end of the same month.<br />
Du inks deal with Dubai Municipality: In February 2010, Du was selected as the exclusive<br />
mobile and BlackBerry smartphone provider for Dubai Municipality. Under the deal, Du will<br />
provide 4,000 Dubai Municipality employees with its Premier Plan, a business mobile monthly<br />
plan that offers features such as the Pay-by-the-Second billing system, free calls among all<br />
employees who subscribe to the offer, one discounted rate to all major international destinations,<br />
and one rate on all incoming calls while roaming in major international destinations with Du's 'One<br />
World One Rate' offer.<br />
Gulf Bridge International (GBI) signs agreement with Du: Under the agreement, Du will land<br />
GBI's new submarine cable in its newly built Fujairah Cable Landing Station. The cable system,<br />
which will utilise the latest subsea fibre cable technology, will interconnect all the countries of the<br />
Gulf region and provide onward connectivity to Europe and Asia.<br />
Du launches international toll-free service in the UAE: The new service, available through<br />
payphones, landlines and mobile phones, allows international companies to extend toll-free<br />
features to the UAE, ensuring that their customers worldwide would not have to pay to reach their<br />
headquarters.<br />
Du to offer more services in 2010: The firm plans to add video conferencing and mobile-based<br />
solutions to its managed-services portfolio this year, while at the same time extending its services<br />
beyond its Dubai base.<br />
Shareholders<br />
Chart 11 : Du – shareholder structure<br />
Public<br />
21%<br />
Government of United<br />
Arab Emirates<br />
39%<br />
Emirates<br />
Communications &<br />
Technology Company<br />
LLC<br />
20%<br />
Mubadala Development<br />
Company<br />
20%<br />
Source: Bloomberg<br />
Du | <strong>Investment</strong> View | 12 May 2010 11<br />
125
Income statement<br />
Dhm FY08A FY09A FY10F FY11F FY12F<br />
Revenue 3951 5339 6290 7188 8101<br />
Cost of sales -1440 -1831 -2158 -2372 -2592<br />
Operating costs -2112 -2399 -2593 -2522 -2588<br />
EBITDA 399.7 1108 1540 2294 2921<br />
DDA & Impairment (ex gw) -504.0 -645.4 -722.7 -771.3 -814.9<br />
EBITA -104.3 462.9 817.1 1523 2106<br />
Goodwill (amort/impaired) 0.00 0.00 0.00 0.00 0.00<br />
EBIT -104.3 462.9 817.1 1523 2106<br />
Net interest 3.34 -6.72 -8.80 4.13 -8.30<br />
Associates (pre-tax) 0.00 0.00 0.00 0.00 0.00<br />
Other pre-tax items 109.2 72.1 129.4 122.5 152.3<br />
Reported PTP 8.25 528.2 937.7 1649 2250<br />
Taxation -4.12 -264.1 -468.8 -824.7 -1125<br />
Minority interests 0.00 0.00 0.00 0.00 0.00<br />
Other post-tax items 0.00 0.00 0.00 0.00 0.00<br />
Reported net profit 4.12 264.1 468.8 824.7 1125<br />
Tot normalised items 0.00 0.00 0.00 0.00 0.00<br />
Normalised EBITDA 399.7 1108 1540 2294 2921<br />
Normalised PTP 8.25 528.2 937.7 1649 2250<br />
Normalised net profit 4.12 264.1 468.8 824.7 1125<br />
Source: Company data, <strong>Rasmala</strong> Research forecasts<br />
year to Dec<br />
Balance sheet<br />
Dhm FY08A FY09A FY10F FY11F FY12F<br />
Cash & market secs (1) 1276 869.3 480.7 412.6 0.00<br />
Other current assets 1027 1356 1707 1956 2271<br />
Tangible fixed assets 4314 6107 7688 8572 9205<br />
Intang assets (incl gw) 1160 1200 1055 904.2 750.3<br />
Oth non-curr assets 0.00 0.00 0.00 0.00 0.00<br />
Total assets 7776 9532 10931 11845 12225<br />
Short term debt (2) 4.90 0.00 0.00 0.00 1661<br />
Trade & oth current liab 2436 3677 4608 7696 5291<br />
Long term debt (3) 2775 3000 3000 0.00 0.00<br />
Oth non-current liab 50.0 63.5 63.5 63.5 63.5<br />
Total liabilities 5266 6740 7671 7760 7015<br />
Total equity (incl min) 2510 2792 3260 4085 5210<br />
Total liab & sh equity 7776 9532 10931 11845 12225<br />
Net debt 1504 2131 2519 2587 1661<br />
Source: Company data, <strong>Rasmala</strong> Research forecasts<br />
year ended Dec<br />
Cash flow statement<br />
Dhm FY08A FY09A FY10F FY11F FY12F<br />
EBITDA 399.7 1108 1540 2294 2921<br />
Change in working capital 108.3 -135.5 578.9 -159.5 279.7<br />
Net interest (pd) / rec -7.97 -6.72 -8.80 4.13 -8.30<br />
Taxes paid 0.00 0.00 -468.8 -824.7 -1125<br />
Other oper cash items 24.9 -4.90 65.2 51.0 65.0<br />
Cash flow from ops (1) 525.0 961.2 1706 1365 2132<br />
Capex (2) -2033 -1624 -2097 -1438 -1215<br />
Disposals/(acquisitions) 0.00 0.00 0.00 0.00 0.00<br />
Other investing cash flow -60.8 -111.6 0.00 0.00 0.00<br />
Cash flow from invest (3) -2094 -1735 -2097 -1438 -1215<br />
Incr / (decr) in equity 0.00 0.00 0.00 0.00 0.00<br />
Incr / (decr) in debt 0.00 0.00 0.00 0.00 0.00<br />
Ordinary dividend paid 0.00 0.00 0.00 0.00 0.00<br />
Preferred dividends (4) 0.00 0.00 0.00 0.00 0.00<br />
Other financing cash flow 2755 367.9 0.00 0.00 -1339<br />
Cash flow from fin (5) 2755 367.9 0.00 0.00 -1339<br />
Forex & disc ops (6) 0.00 0.00 0.00 0.00 0.00<br />
Inc/(decr) cash (1+3+5+6) 1186 -406.3 -390.4 -72.6 -422.0<br />
Equity FCF (1+2+4) -1508 -662.6 -390.4 -72.6 917.0<br />
Source: Company data, <strong>Rasmala</strong> Research forecasts<br />
year to Dec<br />
Du | Key Financial Data | 12 May 2010<br />
126
Equity | United Arab Emirates | Telecommunications<br />
12 May 2010<br />
Initiation of coverage<br />
Buy<br />
Target price<br />
Dh13.60<br />
Price<br />
Dh10.75<br />
Short term (0-60 days)<br />
n/a<br />
Market view<br />
No Weighting<br />
Price performance<br />
(1M) (3M) (12M)<br />
Price (Dh) 10.60 10.09 9.14<br />
Absolute (%) 1.4 6.5 17.6<br />
Rel market (%) 2.8 0.4 11.1<br />
Rel sector (%) 13.3 24.5 29.1<br />
May 07 Apr 08 Apr 09<br />
20<br />
16<br />
12<br />
8<br />
4<br />
0<br />
ETEL.DU<br />
Market capitalisation<br />
Dh84.99bn (€18.23bn)<br />
DFM General Index<br />
Average (12M) daily turnover<br />
Dh10.83m (US$2.91m)<br />
Sector: DFM Telecoms<br />
RIC: ETEL.DU, ETISALAT UH<br />
Priced Dh10.75 at close 6 May 2010.<br />
Source: Bloomberg<br />
Etisalat<br />
On a buying spree<br />
We initiate coverage of Emirates Telecommunications Corporation (Etisalat) with<br />
a Buy rating and a 12-month target price of Dh13.60. To arrive at our target price,<br />
we use an equal weighting of valuations based on multiples, sum of the parts and<br />
DCF.<br />
Key forecasts<br />
FY08A FY09A FY10F FY11F FY12F<br />
Revenue (Dhm) 29,360 30,831 32,017 33,399 35,050<br />
EBITDA (Dhm) 9,036 11,349 11,660 12,206 12,695<br />
Reported net profit (Dhm) 8,511 8,836 8,361 9,055 9,875<br />
Normalised net profit (Dhm) 8,511 8,836 8,361 9,055 9,875<br />
Normalised EPS (Dh) 1.08 1.12 1.06 1.15 1.25<br />
Dividend per share (Dh) 0.45 0.55 0.6 0.6 0.6<br />
Dividend yield (%) 4.23 5.07 5.58 5.58 5.58<br />
Normalised PE (x) 9.99 9.62 10.2 9.39 8.61<br />
EV/EBITDA (x) 8.53 6.89 6.26 5.8 5.02<br />
EV/invested capital (x) 2.78 2.33 2.27 2.05 1.94<br />
Accounting standard: IFRS<br />
Source: Company data, <strong>Rasmala</strong> Research forecasts<br />
year to Dec, fully diluted<br />
Market leader in telecom, well-positioned for broadband<br />
The UAE has one of the most technologically advanced telecommunications infrastructures<br />
in the Middle East and North Africa (MENA). Etisalat is the market leader in the UAE with a<br />
69% subscriber market share compared with Du’s 31%. The UAE has broadband penetration<br />
of 13.2%, among the highest in the MENA telco universe. Etisalat appears well-positioned to<br />
benefit from the broadband opportunity.<br />
Aggressive expansion plan<br />
Etisalat began as a local operator in 1976 and in 2006 started an aggressive expansion plan<br />
following its success with Mobily, its first operation outside the UAE. Today the company has<br />
18 subsidiaries and has invested in an additional five associates in MENA and Asia.<br />
Currently non-UAE operations account for only 14% of revenue.<br />
The stock looks cheap<br />
Current EV/subscriber is about US$550 compared to Du’s US$950. We see risks<br />
surrounding acquisition integration, but believe this is more than priced into the stock.<br />
Possible foreign ownership restriction change<br />
We believe at some point the foreign ownership restriction on the company will be lifted.<br />
currently foreign investors can only gain exposure to the stock on a nominee basis with local<br />
brokers. Should the restriction be lifted, we think the change would unlock value.<br />
Analyst<br />
Shrouk Diab<br />
+20 1 9991 6882<br />
shrouk.diab@rasmala.com<br />
Dubai International Financial Centre,<br />
The Gate Village, Building 10, Level 1,<br />
P.O. Box 31145, Dubai, United Arab<br />
Emirates<br />
www.rasmala.com<br />
Important disclosures can be found in the Disclosures Appendix.<br />
Distributed outside MENA by The Royal <strong>Bank</strong> of Scotland N.V. and its affiliates under a strategic<br />
alliance with <strong>Rasmala</strong> <strong>Investment</strong> <strong>Bank</strong> Ltd.
<strong>Investment</strong> view<br />
We initiate coverage of Emirates Telecommunications Corporation (Etisalat) with a Buy<br />
rating and a 12-month target price of Dh13.60. We use a blended valuation methodology of<br />
sum-of-the-parts (SOTP) combined with peer multiples and DCF.<br />
Etisalat is in talks with UAE government representatives about reducing the annual federal royalty<br />
fee rate the company pays to it. The fee is currently 50% of groupwide net profit and the company<br />
hopes this will be reduced 40%. We have not factored the reduction into our forecasts.<br />
Foreign ownership restriction<br />
Possible plans to IPO Etisalat<br />
Egypt on Egyptian exchange<br />
Currently, trading in Etisalat is restricted for both institutional and foreigner investors.<br />
Management has been in discussions with the UAE government and the capital market authorities<br />
for Etisalat’s conversion into a corporation governed by commercial law. If Etisalat obtains such<br />
approval, it will become eligible for foreign ownership, and we believe this will stimulate trading<br />
and potentially lead to a share price increase.<br />
Etisalat is planning to list Etisalat Egypt on the Egyptian stock exchange. According to Reuters,<br />
the company stated that it intends to launch an initial public offering (IPO) on the Egyptian<br />
exchange; however, it did not reveal the amount or the timing of the listing. We believe that a<br />
listing of Etisalat Egypt could act as a catalyst for Etisalat’s share price.<br />
Valuation and price target<br />
Multiples, SOTP and DCF<br />
valuation<br />
In our base-case scenario, whereby Etisalat continues to pay a 50% federal royalty fee, our SOTP<br />
valuation yields a fair value of Dh13.66 per share, which is 27% higher than the current trading<br />
price of Dh10.75 per share. We value the major operations using a DCF analysis and use the<br />
acquisition value of DB India to account for its value, given little management guidance.<br />
Table 1 : DCF assumptions<br />
Operation WACC Long term growth rate<br />
UAE 10.2% 2.5%<br />
Egypt 13.8% 3.5%<br />
Nigeria 12.2% 3.5%<br />
AT 12.2% 3.5%<br />
Tanzania 12.2% 3.5%<br />
Saudi 10.3% 2.5%<br />
Afghanistan 12.3% 4.0%<br />
Sudan 12.2% 2.5%<br />
Indonesia 12.2% 3.5%<br />
India<br />
Valued at acquisition value<br />
Pakistan 15.0% 2.5%<br />
Sri Lanka 12.2% 3.5%<br />
Source: Company data, <strong>Rasmala</strong> forecasts<br />
Etisalat | <strong>Investment</strong> View | 12 May 2010 2<br />
128
Table 2 : SOTP (base-case scenario: Etisalat pays federal royalty fees of 50%)<br />
Operation (Dh m, unless stated otherwise) Enterprise value Stake Proportionate EV<br />
UAE 70,822 100% 70,822<br />
Egypt 4,739 66% 3,128<br />
Nigeria -341 40% -136<br />
AT 7,906 100% 7,906<br />
Tanzania 718 65% 467<br />
Saudi 55,279 27% 14,925<br />
Afghanistan 714 100% 714<br />
Sudan 620 82% 508<br />
Indonesia 12,654 13% 1,658<br />
India 179 45% 80<br />
Pakistan 3,507 26% 912<br />
Sri Lanka 320 100% 320<br />
Total enterprise value 157,118 101,304<br />
Net cash 6,690<br />
Total equity value 107,994<br />
Total outstanding shares (m) 7,906<br />
Total SOTP (Dh per share) 13.66<br />
Source: <strong>Rasmala</strong> forecasts<br />
Peer valuation<br />
Using our peer group average PE multiples for FY10F of 13.1x and FY11F of 11.5x we arrive at a<br />
target price of Dh13.54 per share, which is the stock’s current price, which is 26% higher than the<br />
current trading share price of Dh10.75 per share.<br />
Table 3 : Estimated 2010 and 2011 PE for telecom peers<br />
Peers PE 2010 (x) PE 2011 (x)<br />
Telefonos de Mexico 8.8 8.5<br />
Reliance Industries 19.6 14.1<br />
Telekom Malaysia 23.1 21.3<br />
Globe Telecom Inc 9.8 9.4<br />
Advanced Info Service 12.8 12.3<br />
Indosat TBK 17.7 14.9<br />
MTN Group 10.48 8.8<br />
Excelcomindo Pratama 15.4 12.4<br />
Turkcell Iletisim Hizmet 10.5 9.7<br />
Vodacom Group 10.53 9.2<br />
Bharti Airtel 12.3 13.2<br />
America Movil SAB de C 13.0 11.7<br />
China Telecom Corp 17.7 14.6<br />
Celtel Zambia 10.6 9.7<br />
Magyar 9.2 9.4<br />
Turk Telekomunikasyon 9.3 8.5<br />
Mobile Telesystems 12.6 7.8<br />
Average 13.1 11.5<br />
Source: Bloomberg<br />
How we differ from consensus<br />
We are slightly higher than Bloomberg consensus on 2010F revenue and EBITDA. Our 2011F<br />
revenue is slightly below consensus, while our 2011F EBITDA is slightly above.<br />
Risks to central scenario<br />
Our main concern is a price war with Du in the UAE. Etisalat appears better capitalised and could<br />
sustain a long battle. But, since the UAE market contributes almost 95% of Etisalat’s consolidated<br />
EBITDA, a prolonged price war could have an adverse impact on the company’s total EBITDA.<br />
A significant increase in expats leaving Dubai could negatively impact total subscribers and<br />
international call volumes. Also, with mobile penetration exceeding 200%, it is difficult to imagine<br />
penetration growing as aggressively as it did in the past. It is critical that the company retain<br />
subscribers, in our view.<br />
Our main concern regarding Etisalat’s aggressive acquisition strategy is overpaying for licences.<br />
Etisalat | <strong>Investment</strong> View | 12 May 2010 3<br />
129
Company dynamics<br />
Our investment case for Etisalat hinges on its ability to capitalise on the growing<br />
broadband segment in the UAE, Saudi Arabia (Mobily) and Egypt (Etisalat Misr). Etisalat<br />
has financial flexibility to make large and small acquisitions in growing telecom markets.<br />
As global and regional telecom operators have been conserving cash and cutting costs, Etisalat<br />
has been on a buying spree, strengthened by its significant net cash position of more than Dh6bn,<br />
which gives the company the financial muscle to seize potential opportunities and bid strongly<br />
against competitors.<br />
Revenue and subscribers<br />
Strong balance sheet;<br />
forthcoming acquisition plans<br />
Expanding too aggressively<br />
Etisalat’s domestic market and largest revenue and EBITDA contributor could continue to come<br />
under pressure as a result of increased competition and declining headline population rates. We<br />
expect foreign operations to start making a more pronounced contribution to consolidated<br />
revenues and EBITDA. We believe Etisalat’s value will be determined by its ability to maintain<br />
subscribers and increase broadband subscribers.<br />
At the Mobile World Congress, Etisalat announced its plans to enter “six possible markets which<br />
would involve both the acquisition of green-field licences within markets with low penetration<br />
levels and industry consolidation” in the MENA region. Management is interested in Libya, where<br />
it has already submitted a bid for a licence; Syria, where a new licence is being formulated; and<br />
possibly acquiring part of Korek Telecom in Iraq. Furthermore, despite having lost a bid to take a<br />
stake in Meditel, Etisalat remains interested in Morocco.<br />
Our main concern regarding Etisalat’s acquisition plans is the possibility of overpaying for<br />
licences, a propensity that MENA telecom operators tend to display.<br />
With the exception of the sub-Sahara African market, the company has focused its acquisitions in<br />
countries that have high UAE expat populations, giving it the ability to cross-sell services between<br />
borders. We believe focusing on a single or limited number of markets will yield higher growth<br />
because management would not become too stretched and a narrower focus could reduce both<br />
currency and political risk. The success of Mobily and Etisalat Misr are good examples of the<br />
company’s willingness and ability to leverage its expertise in greenfield operations with notable<br />
success. Both Mobily and Etisalat very quickly gained momentum and captured a significant<br />
share of subscribers in a very short time.<br />
Financial review<br />
Etisalat increased revenue by 5.0% in 2009 to Dh30.8bn, driven by growth in its Data and Internet<br />
businesses.<br />
Operating expenses declined 6.6% in 2009, driven by a decline in other operating expenses,<br />
which includes foreign exchange gains/losses and operating lease rentals.<br />
Group EBITDA margins (before federal royalty) improved to 63.3% in 2009 compared with 58.7%<br />
in 2008. The improvement was driven largely by the reduction in operating expenses, as<br />
mentioned previously. This is a significant improvement given the weak economic environment<br />
that prevailed in 2009.<br />
Recurring net profit grew 31.4% in 2009, resulting in a return on equity of 26.1% in 2009<br />
compared with 24.2% in 2008.<br />
Etisalat has consistently generated sufficient operating cash to meet its capital expenditure and<br />
other in-house expenses.<br />
Free cash flow declined to Dh4.6bn in 2009 from Dh7.0bn in 2008, due to a 53.5% rise in capital<br />
expenditure to Dh5.6bn.<br />
In the past year, the company raised funds worth Dh1.4bn through bank loans and other sources,<br />
and repaid loans worth Dh560m. Furthermore, it had Dh1.3bn of borrowing facilities available as<br />
of 31 December 2009.<br />
Capex/sales climbed to 17.9% in 2009 from 12.2% in 2008. The increase was driven by the FTTH<br />
initiative in the UAE combined with its expansion strategy in other emerging markets.<br />
Etisalat | <strong>Investment</strong> View | 12 May 2010 4<br />
130
Etisalat by market<br />
Etisalat claims to be the largest carrier of international voice traffic in the MENA region and the<br />
12th-largest voice carrier in the world. In this chapter, we discuss some of the key markets in<br />
which Etisalat operates and the company’s outlook in each of those markets.<br />
Etisalat UAE forecasts (100% stake)<br />
Etisalat remains the market leader in the UAE, with a 69% mobile market share. The mobile<br />
segment has been Etisalat’s main source of revenue. Etisalat’s management expects to complete<br />
the deployment of its fibre-to-the-home (FTTH) network by 2011, reaching full coverage of the<br />
UAE (85% of Abu Dhabi was covered by end-2009) and allowing it to offer advanced triple and<br />
quad play services countrywide. The company is also using its 3G network to introduce attractive<br />
wireless broadband offers.<br />
The UAE remains Etisalat’s core market in terms of overall value. Etisalat’s domestic market<br />
contributed about 86% of year-end 2009 total consolidated revenue and 95% of total EBITDA.<br />
Prior to the credit crisis, mobile subscriber growth and the penetration rate were on the rise, driven<br />
primarily by the expat population residing in the UAE, making up almost 80% of the UAE’s total<br />
population. Total revenue reached Dh26.6bn for year-end 2009, an annual decline of 1%.<br />
For the first time in Etisalat’s history, mobile revenue in the UAE declined by 8% over the year at<br />
year-end 2009, affected by the headline decline in the population, increased competition and the<br />
challenging macroeconomic condition. UAE revenues are driven primarily by mobile, Internet and<br />
data services, with data and Internet services in our view, are expected to grow the fastest.<br />
Etisalat recently launched several promotional offers aimed at increasing customer loyalty and<br />
increasing retention abilities.<br />
Despite a top-line decline, we believe the company did a good job of cutting operational costs,<br />
resulting in EBITDA margin rising to 70% compared with 64% in 2008. Nevertheless, we still<br />
believe margins will come under pressure in the next quarter given the climate of higher<br />
competition.<br />
We expect to see UAE capex ease following the completion of the FTTH network given that it has<br />
been the main focus of the company’s spending for the past three years.<br />
Chart 1 : Etisalat mobile subscribers and market share<br />
Chart 2 : UAE revenue and EBITDA margin<br />
9.0<br />
80%<br />
29.0<br />
70%<br />
8.5<br />
8.0<br />
7.5<br />
7.0<br />
70%<br />
60%<br />
50%<br />
40%<br />
30%<br />
20%<br />
10%<br />
28.5<br />
28.0<br />
27.5<br />
27.0<br />
26.5<br />
26.0<br />
69%<br />
68%<br />
67%<br />
66%<br />
65%<br />
64%<br />
63%<br />
62%<br />
6.5<br />
2008A 2009A 2010E 2011F 2012F<br />
0%<br />
25.5<br />
2008A 2009A 2010E 2011F 2012F<br />
61%<br />
Etisalat UAE mobile subscribers (m) Etisalat UAE market share (%)<br />
UAE revenue (AED bn)<br />
UAE EBITDA margin<br />
Source: Company filings * Etisalat reports gross mobile subscribers, <strong>Rasmala</strong> forecasts<br />
Source: Company filings, <strong>Rasmala</strong> forecasts<br />
Valuation<br />
Our estimated value for Etisalat’s UAE operations is Dh8.96 per share, based on a DCF valuation,<br />
which constitutes around 70% of Etisalat’s total Enterprise value.<br />
Etihad Etisalat (Mobily) forecasts (27% stake) (see Mobily profile)<br />
Etisalat obtained the licence to operate in Saudi Arabia in 2005. Mobily has successfully acquired<br />
the majority of the net subscriber additions in the Saudi market, outstripping Saudi Telecom’s<br />
dominant market share by an average of 13% per year before the entry of Zain Saudi as the third<br />
telecom operator at the end of 2008. Even following the entrance of Zain Saudi, Mobily<br />
Etisalat | <strong>Investment</strong> View | 12 May 2010 5<br />
131
maintained its foothold in the Saudi market, with minimal change in its market share, reaching<br />
about 40% by year-end 2009. Total subscribers reached 18.2m at year-end 2009, while total<br />
revenues increased by an annual 21% to reach Dh12.8bn. EBITDA continued to improve, with<br />
margins reaching 37% at year-end 2009 compared with 35% at year-end 2008.<br />
In late March 2008, Mobily’s founding shareholders, including Etisalat, sold 100m shares,<br />
equivalent to 20% of the company’s total outstanding shares, in a secondary offering to a group of<br />
strategic Saudi investors. In compliance with Saudi Royal decree, Mobily was obligated to<br />
increase its public float to 40% during the third year of its operational lifetime. As a result of this<br />
sale, Etisalat’s stake decreased from 35.5% to 26.25%.<br />
Mobily is Etisalat’s most profitable operation following its UAE operations, and management<br />
recently announced its intention to increase its stake in Mobily. However, no guidance was given<br />
on how much additional stake would be bought. Etisalat currently owns a 27% stake in Mobily.<br />
Today Mobily offers mobile, fixed line and broadband services across the country. During 2009,<br />
the number of its mobile broadband subscribers exceeded 1m. Mobily’s mobile broadband market<br />
share increased from 24% to 41% in 2009 compared with the previous year. The company<br />
launched many promotional packages during the year, targeting specific demographic groups. A<br />
fibre-optic network is being rolled out in Saudi Arabia, which Mobily hopes to leverage and provide<br />
additional services and content in the future.<br />
Chart 3 : Mobily mobile subscribers and market share<br />
Chart 4 : Mobily revenue and EBITDA margin<br />
25.0<br />
41.6%<br />
18.0<br />
40%<br />
20.0<br />
15.0<br />
10.0<br />
5.0<br />
41.4%<br />
41.2%<br />
41.0%<br />
40.8%<br />
40.6%<br />
40.4%<br />
40.2%<br />
40.0%<br />
39.8%<br />
16.0<br />
14.0<br />
12.0<br />
10.0<br />
8.0<br />
6.0<br />
4.0<br />
2.0<br />
39%<br />
38%<br />
37%<br />
36%<br />
35%<br />
34%<br />
33%<br />
0.0<br />
2008A 2009A 2010E 2011F 2012F<br />
39.6%<br />
0.0<br />
2008A 2009A 2010E 2011F 2012F<br />
32%<br />
Mobily mobile subscribers (m) Mobily market share (%)<br />
Mobily revenue (AED bn)<br />
Mobily EBITDA margin<br />
Source: Company filings, <strong>Rasmala</strong> forecasts<br />
Source: Company filings, <strong>Rasmala</strong> forecasts<br />
Valuation<br />
Our estimated value for Mobily’s operations is Dh1.89 per share, based on a DCF valuation,<br />
which constitutes around 15% of Etisalat’s total Enterprise value.<br />
Etisalat Egypt (Etisalat) (66% stake)<br />
Etisalat paid EGP16.7bn (US$2.9bn) in July 2006 to become the third mobile operator in Egypt.<br />
The licence won included 3G spectrum and a monopoly-breaking international voice gateway. The<br />
company was able to attract 1m gross customers in the first 50 days of operation.<br />
Etisalat Egypt covers 98% of the country and ended 2009 with a reported total of 14.2m<br />
subscribers (Etisalat does not report active subscribers). During 2009, the company introduced a<br />
convenient tariff plan that gives customers one flat rate for on-net, cross-net and landline calls.<br />
The company carried out a HSPA+ live trial successfully in 2009. Total revenue reached Dh2.6bn<br />
for year-end 2009, growing by an annual 112%, while EBITDA improved considerably to reach<br />
Dh0.8bn year-end 2009, equivalent to a margin of 30% compared to a previous EBITDA margin of<br />
1% year-end 2008.<br />
Etisalat | <strong>Investment</strong> View | 12 May 2010 6<br />
132
Chart 5 : Etisalat mobile subscribers and market share<br />
Chart 6 : Etisalat revenue and EBITDA margin<br />
14.0<br />
18%<br />
4.0<br />
40%<br />
12.0<br />
16%<br />
3.5<br />
35%<br />
10.0<br />
8.0<br />
14%<br />
12%<br />
10%<br />
3.0<br />
2.5<br />
30%<br />
25%<br />
6.0<br />
8%<br />
2.0<br />
20%<br />
4.0<br />
2.0<br />
0.0<br />
2008A 2009A 2010E 2011F 2012F<br />
Etisalat Egypt mobile subscribers (m)<br />
Etisalat Egypt market share (%)<br />
6%<br />
4%<br />
2%<br />
0%<br />
1.5<br />
1.0<br />
0.5<br />
0.0<br />
2008A 2009A 2010E 2011F 2012F<br />
Etisalat revenue (AED bn)<br />
Etisalat EBITDA margin<br />
15%<br />
10%<br />
5%<br />
0%<br />
Source: Company filings, NTRA, <strong>Rasmala</strong> forecasts<br />
Source: Company filings, <strong>Rasmala</strong> forecasts<br />
We view the Egyptian mobile market as one of the most promising mobile markets in the MENA<br />
region, particularly in the high-speed data market.<br />
Etisalat Egypt was EBITDA-positive in 2008, and in 2009 achieved 30% margin. We assume a<br />
stable market share of 16% in our model, based on an active subscriber base.<br />
Valuation<br />
Our estimated value for Etisalat’s Egyptian operations is Dh0.4 per share, based on a DCF<br />
valuation, which constitutes around 3.% of Etisalat’s total Enterprise value.<br />
Atlantique Telecom, West Africa (100% stake)<br />
Atlantique Telecom operates in seven West African markets – Benin, Burkina Faso, Central<br />
African Republic, Ivory Coast, Gabon, Niger and Togo. It currently covers a population of more<br />
than 70m. Etisalat initially had 70% ownership in the company, which it gradually raised, and in<br />
February 2010 gained 100% ownership. Total subscribers for Atlantique Telecom reached 4.7m at<br />
year-end 2009 compared with 3.7m at year-end 2008. Total revenues reached Dh0.97bn at yearend<br />
2009, an annual 12% increase, while EBITDA reached Dh0.36bn, equivalent to a margin of<br />
37%. Atlantique Telecom contributes approximately 3% of Etisalat’s total consolidated revenue<br />
and 2% of Etisalat’s total consolidated EBITDA.<br />
Table 4 : Atlantique Telecom country overview<br />
Country Population (m) Mobile subscribers (m) Mobile penetration rate (%)<br />
Benin 8.66 3.435 40%<br />
Burkina Faso 15.23 2.553 17%<br />
Togo 6.46 1.5495 24%<br />
Niger 14.7 1.8976 13%<br />
Central African Republic 4.34 0.154 4%<br />
Gabon 1.45 1.3 90%<br />
Source: ITU<br />
In 2009, the company introduced new packages to control churn in the areas of flat rates and<br />
special IDD rates. This resulted in an increase of on-net minutes of use by 48% and the customer<br />
base by 10%.<br />
In 2010, the company has planned major network expansion and launch of BlackBerry services,<br />
as well as promotional activities in all its markets. New value additions are also planned, utilising<br />
mobile Internet and broadband facilities.<br />
Atlantique Telecom is rebranding most of its telecom operations under the commercial name of<br />
Moov to create a strong brand identity in the Western Africa region. At present, Atlantique<br />
Telecom is ranked as one of the top three players in most of the countries in which it operates.<br />
Despite operating in the least mobile penetrated continent and having access to more than 70m<br />
customers through its geographical footprint, we remain concerned on a number of levels. Our<br />
main concern is the continuing need for high capex given the African countries’ general<br />
Etisalat | <strong>Investment</strong> View | 12 May 2010 7<br />
133
characteristics of vast geography and scattered populations. Additionally, with a low GDP/capita,<br />
we believe that high profitability may be difficult to maintain without efficient management. If<br />
management becomes too stretched, we think cost supervision and efficient control could be lost.<br />
Chart 7 : Atlantique Telecom revenue and EBITDA margin<br />
1.6<br />
1.4<br />
1.2<br />
1.0<br />
0.8<br />
0.6<br />
0.4<br />
0.2<br />
0.0<br />
2008A 2009A 2010E 2011F 2012F<br />
45%<br />
40%<br />
35%<br />
30%<br />
25%<br />
20%<br />
15%<br />
10%<br />
5%<br />
0%<br />
Atlantique revenue (AED bn)<br />
Atlantique EBITDA margin<br />
Source: Company filings, ITU, <strong>Rasmala</strong> forecasts<br />
Valuation<br />
Our estimated value for Etisalat’s Atlantique Telecom operations is Dh1.00 per share, based on a<br />
DCF valuation, which constitutes around 8% of Etisalat’s total Enterprise value.<br />
Pakistan (PTCL) (26% stake)<br />
Etisalat acquired a 26% stake of Pakistan Telecommunications Limited Company (PTCL) in April<br />
2005 in an agreement that granted Etisalat management control (53% voting rights) for US$2.6bn.<br />
Under the terms of agreement, Etislalat also charges PTCL an annual technical service fee at<br />
3.5% of PTCL’s gross consolidated revenues. The agreement is valid for five years starting in<br />
2006 and has a cap of US$50m pa. PTCL has advanced infrastructure and offers landline, mobile<br />
and Internet services in Pakistan. Ufone, the mobile arm of PTCL, launched various offers and<br />
BlackBerry products. The number of broadband subscribers grew 300% during 2009 as a result of<br />
lower tariffs and discounts.<br />
Table 5 : Pakistan telecom market overview<br />
2008 2009 2010F 2011F 2012F<br />
Population (m) 230.9 233.7 236.5 239.3 242.2<br />
Mobile penetration 50% 51% 50% 51% 52%<br />
Mobile subscribers (m) 88.0 94.3 97.0 103.7 111.9<br />
Market share 21% 21% 18% 17% 17%<br />
Source: ITU, <strong>Rasmala</strong> forecasts<br />
Recently, however, the fifth payment by Etisalat to the Pakistani government for its 26% stake in<br />
PTCL was withheld, as a dispute over the transfer of properties to PTCL remains unresolved.<br />
Etisalat is withholding US$799m in payments to the Pakistani government until properties that<br />
were originally part of the company's 2006 acquisition in PTCL are registered in PTCL's name.<br />
During 2009, PTCL focused on retention of fixed-line customers by introducing promotional<br />
packages and higher-value propositions. On the mobile front, the company faced tough<br />
competition because there are five other players in the market, in addition to the current<br />
challenging economic and political environment. Given the difficult operating environment in<br />
Pakistan, competing operators such as Orascom Telecom Holding and Telenor are already in<br />
talks to share network infrastructure to reduce their capex and opex costs. Competition in the<br />
market is intense as there are a total of six mobile operators competing for very low ARPU<br />
subscribers. We believe there will be a combination of network sharing agreements and<br />
consolidation in the market as operators struggle to generate adequate returns on investment.<br />
While market has the highest population of the Etisalat’s operations, low cash flows make it a<br />
small contributor to the overall valuation of Etisalat. That noted, we believe ARPUs and EBITDA<br />
Etisalat | <strong>Investment</strong> View | 12 May 2010 8<br />
134
margins should continue to come under pressure throughout our forecast period for PTCL, unless<br />
a similar arrangement can be reached to cut its opex and capex requirements.<br />
Valuation<br />
Our estimated value for Etisalat’s Pakistani operations is Dh 0.12 per share, based on a DCF<br />
valuation, which constitutes around 1% of Etisalat’s total Enterprise value.<br />
Canar, Sudan (82% stake)<br />
Etisalat initially had a 37% stake in Canar, which it increased to 82% in 2007, and is one of two<br />
fixed-line operators in Sudan. During 2009, the fibre-optic links between Sudan and Ethiopia were<br />
rolled out and the company expects to expand the network to all neighbouring countries in the<br />
near future. Canar focused on expanding its Internet broadband services to its enterprise<br />
customers in 2009.<br />
Sudan is the largest country in Africa by geographical area and the sixth largest in terms of<br />
population, exceeding 40m. Given the ongoing fixed-to-mobile substitution effect, the fixed-line<br />
business has not been faring well, with Canar’s subscriber base falling by an annual 20% to<br />
0.14m subscribers at year-end 2009 compared with 0.17m at year-end 2008. Revenue for yearend<br />
2009 grew by an insignificant 1% to reach Dh0.2m. EBITDA margins improved considerably<br />
despite the flat revenue growth to reach 28% compared with 13% at year-end 2008. We believe<br />
the real potential lies in Canar’s ability to provide attractive broadband services, which would help<br />
increase revenue growth.<br />
Table 6 : Sudan telecom market overview<br />
2008 2009 2010F 2011F 2012F<br />
Population (m) 41.4 43.2 45.2 47.2 49.4<br />
Fixed penetration 1% 1% 1% 1% 1%<br />
Fixed subscribers (m) 0.3 0.3 0.3 0.3 0.3<br />
Market share 64% 49% 47% 46% 46%<br />
Source: Operators, Company Filings, ITU, <strong>Rasmala</strong> forecasts<br />
Valuation<br />
Our estimated value for Etisalat’s Sudanese operations is Dh0.06 per share, based on a DCF<br />
valuation, which constitutes around 1% of Etisalat’s total Enterprise value.<br />
Etisalat, Afghanistan (100% stake)<br />
Etisalat was the fourth entrant in to the Afghan market when it began operations in 2007. During<br />
2009, it expanded its network coverage by five provinces and plans to add 11 more provinces in<br />
2010. The company introduced several promotional packages during 2009, targeting both the<br />
enterprise and consumer segments. At the enterprise level, the company introduced new postpaid<br />
plans and offers in addition to services such as bulk SMS and VPN. For the consumer segment,<br />
the company launched the Mumtaz rate plan, which comes at a single flat rate for both on-net and<br />
off-net calls. This plan added 68,000 gross subscribers over six months. Etisalat Afghanistan also<br />
collaborated with PTCL’s mobile arm Ufone to introduce joint IDD promotions in 2009. The<br />
company plans to focus on strengthening brand awareness in all its market segments.<br />
Table 7 : Afghanistan telecom market overview<br />
2008 2009 2010F 2011F 2012F<br />
Population (m) 27.2 27.3 27.5 27.6 27.8<br />
Mobile penetration 29% 47% 57% 66% 74%<br />
Mobile subscribers (m) 7.9 12.4 15.7 18.2 20.5<br />
Market share 15% 22% 22% 25% 28%<br />
Source: Operators, Company Filings, ITU, <strong>Rasmala</strong> forecasts<br />
Afghanistan was generally the top-performing operation in 2009, with the highest annual revenue<br />
growth of 163% and highest annual subscriber growth of 130%.<br />
With about 2.7m subscribers by year-end 2009 and an equivalent estimated market share of 22%,<br />
we believe Etisalat Afghanistan could exceed a market share of 30% by the end of our forecast<br />
period. We expect operations to break even by 2010.<br />
Etisalat | <strong>Investment</strong> View | 12 May 2010 9<br />
135
Valuation<br />
Our estimated value for Etisalat’s Afghani operations is Dh0.09 per share, based on a DCF<br />
valuation, which constitutes around 1% of Etisalat’s total Enterprise value.<br />
Zantel, Tanzania (65% stake)<br />
During 2009, Zantel performed poorly due to changing customer needs that management failed to<br />
predict early on. Revenue dropped by an annual 23% to Dh130m, while EBITDA margin<br />
deteriorated to negative 52% compared with negative 5% at year-end 2008.<br />
To meet the changing customer demands in the market and combat the high churn it faced, the<br />
company altered its product portfolio, including launch of BlackBerry and related services. Zantel<br />
also introduced per-second billing that led to over 1m activations. Additionally, Zantel offered<br />
customer credit loans, a banking service building on the Z-Pesa launched in 2008. We believe<br />
operations for Zantel could break even by 2011 in view of management’s new proactive strategy<br />
and cost efficiency plans.<br />
Table 8 : Tanzania telecom market overview<br />
2008 2009 2010F 2011F 2012F<br />
Population (m) 42.5 44.0 45.5 47.1 48.7<br />
Mobile penetration 31% 40% 48% 55% 61%<br />
Mobile subscribers (m) 13.0 17.5 21.7 25.7 29.5<br />
Market share 8% 8% 8% 7% 7%<br />
Source: Operators, Company Filings, ITU, <strong>Rasmala</strong> forecasts<br />
Valuation<br />
Our estimated value for Etisalat’s Tanzanian operations is Dh0.06 per share, based on a DCF<br />
valuation, which constitutes around 0.5% of Etisalat’s total Enterprise value.<br />
PT XL Axiata Tbk, Indonesia (XL) (13% stake)<br />
At the end of December 2007, Etisalat acquired a 15.97% stake in the third-largest mobile<br />
operator in Indonesia for US$438m. XL’s revenue grew by an annual 14% to year-end 2009,<br />
ahead of management guidance of 10-12%, largely due to data and SMS services. EBITDA<br />
margin also improved to 45% at year-end 2009 compared with 42% year-end 2008, due to cost<br />
control.<br />
XL made technology investments in 2009 in line with its theme for the year, Value Beyond Price.<br />
XL launched the *123# portal during 2009, which allows its customers to switch between plans<br />
and select preferred promotions. Different rate plans were introduced, targeting different types of<br />
customers. XL had more that 200,000 BlackBerry customers by November 2009.<br />
Table 9 : Indonesia telecom market overview<br />
2008 2009 2010F 2011F 2012F<br />
Population (m) 230.9 233.7 236.5 239.3 242.2<br />
Mobile penetration 57% 66% 74% 81% 87%<br />
Mobile subscribers (m) 131.5 154.1 174.9 193.7 210.6<br />
Market share 20% 20% 22% 22% 23%<br />
Source: Operators, Company Filings, ITU, <strong>Rasmala</strong> forecasts<br />
Valuation<br />
Our estimated value for Etisalat’s Indonesian operations is Dh0.21 per share, based on a DCF<br />
valuation, which constitutes about 1.5% of Etisalat’s total enterprise value.<br />
EMTS Etisalat – Nigeria (40% stake)<br />
In September 2007, Etisalat bought a 40% stake in a new Nigerian telecom company, Emerging<br />
Markets Telecommunications Services Limited (EMTS), from the Abu Dhabi-based Mubadala<br />
Development Company, which launched under the commercial brand of Etisalat Nigeria early in<br />
2008.<br />
The company’ strategy during 2009 was to achieve the widest network coverage possible in the<br />
first year of operations by rolling out 1,090 cell sites and achieving a firm subscriber base.<br />
Etisalat | <strong>Investment</strong> View | 12 May 2010 10<br />
136
EMTS expanded its coverage in 2009 to include 76 cities. The company also laid out the<br />
necessary infrastructure to launch Data Services.<br />
Table 10 : Nigeria telecom market overview<br />
2008 2009 2010F 2011F 2012F<br />
Population (m) 151.2 154.2 157.3 160.5 163.7<br />
Mobile penetration 36% 41% 46% 50% 54%<br />
Mobile subscribers (m) 53.7 62.5 71.6 79.5 87.6<br />
Market share 1% 3% 5% 6% 7%<br />
Source: Operators, Company Filings, ITU, <strong>Rasmala</strong> forecasts<br />
Valuation<br />
Our estimated value for Etisalat’s Nigerian operations is a loss of Dh0.02 per share, based on a<br />
DCF valuation, which constitutes around negative 0.1% of Etisalat’s total Enterprise value. Given<br />
the company’s lack of disclosure on the progress of its Nigerian operation, we remain quite<br />
pessimistic, in valuing the future cash flows of this operation.<br />
Etisalat, Sri Lanka (Tigo) (100% stake)<br />
The latest addition to the Etisalat Group is Tigo Sri Lanka, the second-largest operator in the Sri<br />
Lankan mobile market. Etisalat had announced its 100% stake acquisition of Tigo Sri Lanka in<br />
October 2009, which at the time had an enterprise value of US$207m. The company has a market<br />
share of 21%, the second-largest mobile phone operator in Sri Lanka, with 2.25m subscribers.<br />
During 2010, the company plans to target the corporate sector, which it has not entered before. At<br />
the same time, the company plans to expand its reach to the northern and eastern regions of the<br />
country, where it sees strong potential after the end of the civil war.<br />
Table 11 : Sri Lanka telecom market overview<br />
2008 2009 2010F 2011F 2012F<br />
Population (m) 20.1 19.9 19.7 19.5 19.3<br />
Mobile penetration 55% 56% 60% 65% 70%<br />
Mobile subscribers (m) 11.1 11.2 11.8 12.7 13.5<br />
Market share 18% 21% 21% 21% 21%<br />
Source: Operators, Company Filings, ITU, <strong>Rasmala</strong> forecasts<br />
Valuation<br />
Our estimated value for Etisalat’s Sri Lankan operations is Dh0.04 per share, based on a DCF<br />
valuation, which constitutes around 0.3% of Etisalat’s total Enterprise value.<br />
Etisalat DB Telecom Pvt Limited, India (EDBT) (45% stake)<br />
ETBT was formed in 2008 after Etisalat tied up with Dynamix Balwas Group. EDBT is licenced to<br />
offer telecom services across 15 of the 22 operational circles that cover 84% of the population. As<br />
a relatively new player in the large Indian market, EDBT focused on attracting new customers<br />
across the market. With low penetration in India, EDBT sees substantial growth potential going<br />
forward. The aim of the venture is to create an asset-light model in which several ongoing<br />
operations have been outsourced to partners such as Tech Mahindra and Reliance Infra to bring<br />
about cost savings and more efficiency. According to management, research across circles<br />
suggests network-related issues are by far the most important reasons for churn among existing<br />
customers, which management views as a golden opportunity.<br />
Etisalat currently holds 44.7% of Etisalat DB and seeks approval to raise its stake to 50%. We<br />
have not included Etisalat DB in our DCF forecast assumptions because not enough information<br />
was supplied by management regarding the plans or strategy of the company. However, until<br />
more details regarding plans and strategy are announced by management, we have included the<br />
total value of Dh79.9m that Etisalat paid for its 44.7% stake in this venture.<br />
Thuraya Telecommunications Company, UAE<br />
Thuraya offers satellite-based telecommunication services to its customers across the world. It<br />
provides voice, data, maritime, rural telephony and fleet management services. During 2009,<br />
Thuraya partnered with many governments and international organisations, including the World<br />
<strong>Bank</strong> and the UN.<br />
Etisalat | <strong>Investment</strong> View | 12 May 2010 11<br />
137
Appendix<br />
Company overview<br />
Etisalat is an integrated telecommunications operator offering mobile and fixed-line, Internet and<br />
data services to individuals, enterprises, international telecommunications companies, ISPs,<br />
content providers and mobile operators in the MENA region and parts of Asia.<br />
Etisalat claims to be the largest carrier of international voice traffic in the MENA region and the<br />
12th-largest voice carrier in the world. It is also a comprehensive provider of carrier and wholesale<br />
services in the region, with many points of presence (PoPs) globally. Etisalat has more than 500<br />
roaming agreements connecting nearly 200 countries, enabling BlackBerry, 3G and voice<br />
roaming. It also provides hi-tech complementary services, including managerial and technical<br />
training, SIM card manufacturing, payment solutions, clearing house services, peering, voice and<br />
data transit, and submarine and land cable services.<br />
Etisalat was established in 1976 and was the sole operator in the UAE until 2006. The company<br />
has since changed its business strategy and is becoming a global player with operations in West<br />
Africa, South Asia and other Middle Eastern countries.<br />
Etisalat’s presence in the UAE is still its most significant, with 69% market share in the country.<br />
However, given saturation in the UAE, Etisalat is seeking new opportunities in underpenetrated<br />
markets. Following changes in the UAE’s telecommunications regulatory framework, Etisalat<br />
increased its investments abroad and gradually gained controlling ownership of several telecom<br />
companies with promising growth prospects. These include Atlantic Telecom, Pakistan<br />
Telecommunications Company Ltd and Etisalat Misr of Egypt.<br />
The company has completed most of its FTTH initiative, a major step in its strategy to offer<br />
bundled services. The recent legalisation of VoIP services also opens new avenues for Etisalat,<br />
as it hopes to design and implement VoIP solutions for businesses, thereby enabling enterprises<br />
to outsource the management of their telephone networks.<br />
Etisalat pays 50% of its net income as federal royalties to the UAE government, its major<br />
shareholder. Its other shareholders, however, oppose this agreement and await a substantial<br />
reduction of these royalties. For the year ended 31 December 2009, the company paid 60% of its<br />
net profit after royalties as dividends to shareholders. The board also recommended a 1-for-10<br />
bonus share issue, totaling 718m shares.<br />
In March 2010, Etisalat announced its plans to increase its investments in Ethihad Etisalat and to<br />
buy a majority stake in Iraqi telecoms operator Kirkuk Telecom.<br />
Company history<br />
Etisalat was established in 1976 and was the sole telecoms operator in the UAE until 2006. With a<br />
second telecom operator entering the fray in 2006, Etisalat changed its business strategy to<br />
become a global player and now operates in West Africa, South Asia and other Middle Eastern<br />
countries through 18 subsidiaries and five associates.<br />
Etisalat’s presence in the UAE is still its most significant, given its 69% mobile market share in the<br />
country. However, given the saturation in the UAE and the added competition from a second<br />
player, Etisalat is seeking new opportunities in underpenetrated markets. Following changes in<br />
the UAE’s telecommunications regulatory framework, Etisalat increased its investments abroad<br />
and gradually gained controlling ownership of several telecom companies with promising growth<br />
prospects. These include Atlantique Telecom, Pakistan Telecommunications Company Ltd and<br />
Etisalat Misr of Egypt. Following this move, Etisalat’s global subscriber base exceeded 100m in<br />
March 2010.<br />
In March 2010, Etisalat announced its plans to increase its investments in Ethihad Etisalat and to<br />
buy a majority stake in Iraqi telecoms operator Kirkuk Telecom.<br />
Etisalat | <strong>Investment</strong> View | 12 May 2010 12<br />
138
Figure 1 : Corporate events timeline<br />
Launched iPhone 3G.<br />
Introduced 100 GB mobile<br />
broadband package<br />
Acquired Pakistan telecom<br />
operator,<br />
PTCL<br />
Launched audio<br />
conferencing, fixed-line<br />
MMS, corporate GPRS and<br />
BlackBerry solutions<br />
Built strategic partnership<br />
with the federal and many<br />
local government entities in<br />
rolling out ICT solutions and<br />
eServices initiatives<br />
Etisalat Egypt began<br />
operations<br />
Etisalat became the first in<br />
the region to launch 3G and<br />
3.5G services<br />
Deployed 3.5G network,<br />
rolled out and implemented<br />
triple-play services<br />
Launched mCommerce<br />
packages - mobile payment<br />
services to banks, traffic<br />
police, etc.<br />
Received "SuperBrand" and<br />
"Best Telecom in the UAE"<br />
awards<br />
Entered new markets in India<br />
and Nigeria<br />
Increased stake in Atlantique<br />
Telecom to 82%<br />
Received third mobile<br />
license in Iran.<br />
Partnered with China to<br />
enhance global IP VPN<br />
network<br />
Licensed as the first<br />
certification provider for e-<br />
commerce transactions in<br />
the UAE by TRA<br />
Launched eLife: double- and<br />
triple-play services, software<br />
for visually impaired<br />
Entered long-term<br />
partnership with Coniva to<br />
introduce mobile valueadded-services<br />
to its<br />
customers<br />
Launched VoIP solution for<br />
enterprise customers<br />
Global subscriber base<br />
exceeded 100 million<br />
Increased stake on<br />
Atlantique Telecom to 100%<br />
2006 2007 2008 2009<br />
2010 March<br />
[Source: Company data, RBS<br />
! Acquisition of PTCL: In February 2006, Etisalat acquired a 26% stake in PTCL, the Pakistani<br />
state-owned telecom operator. It also gained management control of PTCL.<br />
! Commenced operations of Etisalat Misr, Egypt: Etisalat Misr commenced operations in<br />
May 2007 as the first 3.5G operator in Egypt. It attracted 1m subscribers in the first 50 days of<br />
operations.<br />
! Interconnection agreement with Du: In January 2007, Etisalat entered into an<br />
interconnection agreement with Du, the second entrant to the telecoms market in the UAE.<br />
! Acquisition of shares in Swan Telecom India: Etisalat acquired 45% of Swan Telecom<br />
India, a newly registered telecom operator, in September 2008. This was renamed Etisalat DB<br />
Telecom India in June 2009.<br />
! Rollout of FTTH Network: By December 2009, Etisalat had completed 60% of the rollout of<br />
the FTTH network in the UAE.<br />
! Launch of eLife double and triple play services: These services combine telephony,<br />
broadband Internet access and IPTV services in a bundled offering.<br />
! Launch of iPhone 3G: In February 2009, the company launched the iPhone 3G in the UAE.<br />
Etisalat’s 3G landline network, which covers c99% of the country’s population, will enable<br />
download speeds of up to 7.2Mbps and upload speeds of 1.9Mbps.<br />
! Etisalat and Nokia collaboration: Etisalat announced a joint collaboration with Nokia in April<br />
2009 in a bid to expand advanced Internet and mobile services in the Middle East. The<br />
collaboration enables Etisalat’s customers to enjoy services such as Ovi maps, navigation,<br />
games, music and messaging.<br />
! Increased stake in Atlantique Telecom: In February 2010, Etisalat acquired the remaining<br />
18% stake in the West Africa-based Atlantique Telecom, making it a fully owned subsidiary.<br />
! VoIP solutions to business customers: From March 2010, Etisalat began providing VoIP<br />
solutions to its UAE-based business customers following the recent legalisation of the service.<br />
! Bid for 3G licence in India: Etisalat has made arrangements to participate in India’s 3G<br />
wireless spectrum auction in April 2010. Etisalat will bid for licences only in the regions in<br />
which it already operates, according to Bloomberg.<br />
Etisalat | <strong>Investment</strong> View | 12 May 2010 13<br />
139
Income statement<br />
Dhm FY08A FY09A FY10F FY11F FY12F<br />
Revenue 29360 30831 32017 33399 35050<br />
Cost of sales -3319 -3840 -3988 -4160 -4366<br />
Operating costs -17004 -15642 -16370 -17033 -17989<br />
EBITDA 9036 11349 11660 12206 12695<br />
DDA & Impairment (ex gw) -2484 -2535 -3353 -3245 -2987<br />
EBITA 6552 8815 8307 8961 9708<br />
Goodwill (amort/impaired) 0.00 0.00 0.00 0.00 0.00<br />
EBIT 6552 8815 8307 8961 9708<br />
Net interest -148.4 11.6 388.2 453.9 519.1<br />
Associates (pre-tax) 0.00 0.00 0.00 0.00 0.00<br />
Other pre-tax items 1784 0.00 0.00 0.00 0.00<br />
Reported PTP 8187 8827 8695 9415 10228<br />
Taxation -187.0 -243.8 -173.9 -141.2 -102.3<br />
Minority interests 510.6 253.6 -159.8 -218.6 -249.9<br />
Other post-tax items 0.00 0.00 0.00 0.00 0.00<br />
Reported net profit 8511 8836 8361 9055 9875<br />
Tot normalised items 0.00 0.00 0.00 0.00 0.00<br />
Normalised EBITDA 9036 11349 11660 12206 12695<br />
Normalised PTP 8187 8827 8695 9415 10228<br />
Normalised net profit 8511 8836 8361 9055 9875<br />
Source: Company data, <strong>Rasmala</strong> Research forecasts<br />
year to Dec<br />
Balance sheet<br />
Dhm FY08A FY09A FY10F FY11F FY12F<br />
Cash & market secs (1) 11295 11309 16927 18034 21847<br />
Other current assets 6128 8253 8095 8161 8194<br />
Tangible fixed assets 13101 17585 19245 20903 21359<br />
Intang assets (incl gw) 16204 16778 15818 14816 13764<br />
Oth non-curr assets 16190 17452 17061 16873 16831<br />
Total assets 62918 71379 77145 78787 81995<br />
Short term debt (2) 722.3 1079 0.00 0.00 0.00<br />
Trade & oth current liab 20694 22409 25427 25575 23261<br />
Long term debt (3) 2644 3422 3802 574.8 337.7<br />
Oth non-current liab 3237 4079 3750 3940 4318<br />
Total liabilities 27298 30989 32978 30090 27917<br />
Total equity (incl min) 35620 40389 44167 48697 54078<br />
Total liab & sh equity 62918 71379 77145 78787 81995<br />
Net debt -7928 -6808 -12010 -14232 -21272<br />
Source: Company data, <strong>Rasmala</strong> Research forecasts<br />
year ended Dec<br />
Cash flow statement<br />
Dhm FY08A FY09A FY10F FY11F FY12F<br />
EBITDA 9036 11349 11660 12206 12695<br />
Change in working capital 1319 -153.6 2061 852.7 642.7<br />
Net interest (pd) / rec 12.2 193.4 388.2 453.9 519.1<br />
Taxes paid -87.9 -86.0 -173.9 -141.2 -102.3<br />
Other oper cash items 329.0 -985.1 -159.8 -218.6 -249.9<br />
Cash flow from ops (1) 10609 10318 13776 13153 13505<br />
Capex (2) -3908 -6798 -4052 -3902 -2391<br />
Disposals/(acquisitions) 3869 0.00 0.00 0.00 0.00<br />
Other investing cash flow -2875 -166.0 391.0 188.8 42.0<br />
Cash flow from invest (3) -2914 -6964 -3661 -3713 -2349<br />
Incr / (decr) in equity 0.00 0.00 117.6 811.4 1632<br />
Incr / (decr) in debt -2397 485.9 225.1 -4030 -3112<br />
Ordinary dividend paid -3244 -3893 -4744 -4744 -4744<br />
Preferred dividends (4) 0.00 0.00 0.00 0.00 0.00<br />
Other financing cash flow 0.00 0.00 -96.3 -370.3 -1119<br />
Cash flow from fin (5) -5642 -3407 -4497 -8332 -7343<br />
Forex & disc ops (6) -190.2 67.7 0.00 0.00 0.00<br />
Inc/(decr) cash (1+3+5+6) 1862 14.3 5618 1108 3813<br />
Equity FCF (1+2+4) 6701 3520 9724 9251 11114<br />
Source: Company data, <strong>Rasmala</strong> Research forecasts<br />
year to Dec<br />
Etisalat | Key Financial Data | 12 May 2010<br />
140
Recommendation structure<br />
Absolute performance, short term (trading) recommendation: A Trading Buy recommendation implies upside of 5% or more and a Trading Sell indicates downside of 5% or more. The<br />
trading recommendation time horizon is 0-60 days. For Australian coverage, a Trading Buy recommendation implies upside of 5% or more from the suggested entry price range, and a<br />
Trading Sell recommendation implies downside of 5% or more from the suggested entry price range. The trading recommendation time horizon is 0-60 days.<br />
Performance parameters and horizon: Given the volatility of share prices and our pre-disposition not to change recommendations frequently, these performance parameters should be<br />
interpreted flexibly. Performance in this context only reflects capital appreciation and the horizon is 12 months. Market or sector view: This view is the responsibility of the strategy team<br />
and a relative call on the performance of the market/sector relative to the region. Overweight/Underweight implies upside/downside of 10% or more and Neutral implies less than 10%<br />
upside/downside. Target price: The target price is the level the stock should currently trade at if the market were to accept the analyst's view of the stock and if the necessary catalysts<br />
were in place to effect this change in perception within the performance horizon. In this way, therefore, the target price abstracts from the need to take a view on the market or sector. If it<br />
is felt that the catalysts are not fully in place to effect a re-rating of the stock to its warranted value, the target price will differ from 'fair' value.<br />
Valuation and risks to target price<br />
For a discussion of the valuation methodologies used to derive our price targets and the risks that could impede their achievement, please refer to our latest published research on those<br />
stocks at http://research.rbsm.com<br />
Disclaimer<br />
This report is prepared by <strong>Rasmala</strong> <strong>Investment</strong> <strong>Bank</strong> Limited (“RIB”). RIB is regulated by the Dubai Financial Services Authority (“DFSA”). RIB products or services are only made<br />
available to customers who RIB is satisfied meet the regulatory criteria to be a “ Professional Client”, as defined under the Rules and Regulations of the Dubai International Financial<br />
Centre (“DIFC”)<br />
Our investment recommendations take into account both risk and expected return. We base our long-term fair value estimates on a fundamental analysis of a company’s future prospects,<br />
after having taken perceived risks into consideration. We have conducted reasonable research to arrive at our investment recommendations and fair value estimates for the company or<br />
companies mentioned in this report. Although the information in this report has been obtained from sources that RIB believes to be reliable, we have not independently verified such<br />
information thus it may not be accurate or complete. RIB does not represent or warrant, either expressly or impliedly, the accuracy or completeness of the information or opinions<br />
contained within this report and no liability whatsoever is accepted by RIB or any other person for any loss howsoever arising, directly or indirectly, from any use of such information or<br />
opinions or otherwise arising in connection therewith.<br />
Readers should understand that financial projections, fair value estimates and statements regarding future prospects may not be realized. All opinions and estimates included in this report<br />
constitute our judgment as of this date and are subject to change without notice. This research report is prepared for general circulation and is intended for general information purposes<br />
only. It is not intended as an offer or solicitation or advice with respect to the purchase or sale of any securities referred to in the report. It is not tailored to the specific investment<br />
objectives, financial situation or needs of any specific person that may receive this report. We strongly advise potential investors to seek financial guidance when determining whether an<br />
investment is appropriate to their needs.<br />
RIB is not registered with the U.S. Securities and Exchange Commission, or any U.S. state authority, as a broker-dealer or investment advisor. This report has not been approved,<br />
disapproved or recommended by the U.S. Securities and Exchange Commission, any state securities commission in the United States, the securities commission of any non-U.S.<br />
jurisdiction or any other U.S. or non-U.S. regulatory authority. None of these authorities has passed on or endorsed the merits or the accuracy or adequacy of this report.<br />
RIB and its group entities (together and separately, “<strong>Rasmala</strong>”) does and may seek to do business with companies covered in its reports. As a result, users should be aware that the firm<br />
may have a conflict of interest that could affect the objectivity of this report. Investors should consider this report as only a single factor in making their investment decision.<br />
<strong>Rasmala</strong> and its respective employees, directors and officers shall not be responsible or liable for any liabilities, damages, losses, claims, causes of action, or proceedings (including<br />
without limitation indirect, consequential, special, incidental, or punitive damages) arising out of or in connection with the use of this report or any errors or omissions in its content.<br />
The research analyst or analysts responsible for the content of this research report certify that: (1) the views expressed and attributed to the research analyst or analysts in the research<br />
report accurately reflect their personal opinion(s) about the subject securities and issuers and/or other subject matter as appropriate; and, (2) no part of his or her compensation was, is or<br />
will be directly or indirectly related to the specific recommendations or views contained in this research report. On a general basis, the efficacy of recommendations is a factor in the<br />
performance appraisals of analysts.<br />
Telecommunications | Disclosures Appendix | 12 May 2010