Indirect and Direct Effects of Climate Change on Forest ... - Desai
Indirect and Direct Effects of Climate Change on Forest ... - Desai
Indirect and Direct Effects of Climate Change on Forest ... - Desai

Create successful ePaper yourself
Turn your PDF publications into a flip-book with our unique Google optimized e-Paper software.
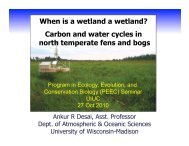
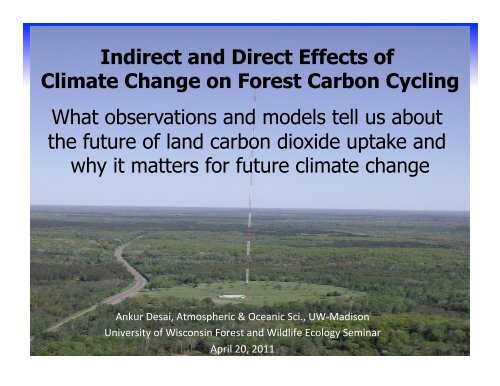
<str<strong>on</strong>g>Indirect</str<strong>on</strong>g> <str<strong>on</strong>g>and</str<strong>on</strong>g> <str<strong>on</strong>g>Direct</str<strong>on</strong>g> <str<strong>on</strong>g>Effects</str<strong>on</strong>g> <str<strong>on</strong>g>of</str<strong>on</strong>g><br />
<str<strong>on</strong>g>Climate</str<strong>on</strong>g> <str<strong>on</strong>g>Change</str<strong>on</strong>g> <strong>on</strong> <strong>Forest</strong> Carb<strong>on</strong> Cycling<br />
What observati<strong>on</strong>s <str<strong>on</strong>g>and</str<strong>on</strong>g> models tell us about<br />
the future <str<strong>on</strong>g>of</str<strong>on</strong>g> l<str<strong>on</strong>g>and</str<strong>on</strong>g> carb<strong>on</strong> dioxide uptake <str<strong>on</strong>g>and</str<strong>on</strong>g><br />
why it matters for future climate change<br />
Ankur <strong>Desai</strong>, Atmospheric & Oceanic Sci., UW-‐Madis<strong>on</strong> <br />
University <str<strong>on</strong>g>of</str<strong>on</strong>g> Wisc<strong>on</strong>sin <strong>Forest</strong> <str<strong>on</strong>g>and</str<strong>on</strong>g> Wildlife Ecology Seminar <br />
April 20, 2011
<strong>Forest</strong>s in the Earth System<br />
• <str<strong>on</strong>g>Climate</str<strong>on</strong>g> system is driven by <br />
– Forcings that impact the energy budget, water <br />
cycle, or trace gas <str<strong>on</strong>g>and</str<strong>on</strong>g> aerosol composiK<strong>on</strong> <str<strong>on</strong>g>of</str<strong>on</strong>g> <br />
atmosphere <br />
– Feedbacks that reverse, limit, or enhance these <br />
forcings <br />
• <strong>Forest</strong>s have low albedo, moderate <br />
evapotranspiraK<strong>on</strong> rates, <str<strong>on</strong>g>and</str<strong>on</strong>g> high carb<strong>on</strong> <br />
stores. They also cover a significant area <str<strong>on</strong>g>of</str<strong>on</strong>g> <br />
the global l<str<strong>on</strong>g>and</str<strong>on</strong>g> surface <br />
– C<strong>on</strong>sequently, forcings <str<strong>on</strong>g>and</str<strong>on</strong>g> feedbacks imposed <br />
by forests are worth c<strong>on</strong>sidering!
Biogeophysical<br />
Mechanisms<br />
<strong>Forest</strong>s in the Earth System<br />
Biogeochemical<br />
Mechanisms<br />
Radiati<strong>on</strong><br />
CO2<br />
SHF<br />
LHF<br />
CH4<br />
Oz<strong>on</strong>e,<br />
N20 ,Others
B<strong>on</strong>an et al., 2008<br />
<strong>Forest</strong>s in the Earth System
B<strong>on</strong>an et al., 2008
Hypothesis<br />
• The indirect sensiKvity <str<strong>on</strong>g>and</str<strong>on</strong>g> feedbacks <str<strong>on</strong>g>of</str<strong>on</strong>g> <br />
forest carb<strong>on</strong> cycle to climate change may <br />
dwarf the direct sensiKvity <br />
– <str<strong>on</strong>g>Direct</str<strong>on</strong>g> effects <br />
– <str<strong>on</strong>g>Indirect</str<strong>on</strong>g> effects <br />
• C<strong>on</strong>temporary observaK<strong>on</strong>s <str<strong>on</strong>g>of</str<strong>on</strong>g> forest <br />
carb<strong>on</strong> exchange can be used to evaluate <br />
<str<strong>on</strong>g>and</str<strong>on</strong>g> improve predicKve simulaK<strong>on</strong> models
IPCC, 4 th AR, (2007) <br />
What Do We Know?
What Do We Know?<br />
385 ppm <br />
(2008) <br />
CO 2 (ppm) <br />
232 ppm <br />
Ice ages <br />
Years Before Present <br />
Source: Lüthi et al (2008), CDIAC, & Wikimedia Comm<strong>on</strong>s
Since 1990: <br />
What Do We Know?<br />
• Global annual CO 2 emissi<strong>on</strong>s grew 25% to <br />
27,000,000,000 t<strong>on</strong>s <str<strong>on</strong>g>of</str<strong>on</strong>g> CO 2 <br />
• CO 2 in the atmosphere grew 10% to <br />
385 ppm <br />
• At current rates, CO 2 is likely to exceed <br />
500-‐950 ppm someKme this century <br />
• But: Rate <str<strong>on</strong>g>of</str<strong>on</strong>g> atmospheric CO 2 increase is about <br />
half the rate <str<strong>on</strong>g>of</str<strong>on</strong>g> emissi<strong>on</strong>s increase. Why?
Where is the Carb<strong>on</strong> Going?<br />
Ecosystem Carb<strong>on</strong> Sink <br />
Hought<strong>on</strong> et al. (2007)
Where is the Carb<strong>on</strong> Going?<br />
Le Quére et al., 2009
Where is the Carb<strong>on</strong> Going?<br />
C. Williams, Clark U, NACP 2011
What D<strong>on</strong>’t We Know?<br />
• Sitch et al., 2008
What D<strong>on</strong>’t We Know?<br />
• Friedlingstein et al., 2006
What D<strong>on</strong>’t We Know?<br />
• Ricciuto et al., in prep <br />
Ricciuto et al., PhD dissertati<strong>on</strong>
Is There Any C<strong>on</strong>sistency to<br />
What We D<strong>on</strong>’t Know?<br />
47 Flux Tower Sites<br />
36 AmeriFlux<br />
11 Fluxnet Canada<br />
30 Models<br />
Num Model Num Model<br />
1 Agro-IBIS 16 GTEC<br />
2 BEPS 17 ISAM<br />
3 Biome-BGC 18 ISOLSM<br />
4 Can-IBIS 19 LoTEC<br />
5 CLM-CASA' 20 LoTEC-DA<br />
6 CLM-CN 21 LPJ_wsl<br />
7 CN-CLASS 22 ORCHIDEE<br />
8 DAYCENT 23 ORCHIDEE-STICS<br />
9 DLEM 24 SiB3<br />
10 DNDC 25 SiBCASA<br />
11 ecosys 26 SiBCrop<br />
12 ED2 27 SIPNET<br />
13 EDCM 28 SSiB2<br />
14 EPIC 29 TECO<br />
15 GFDL LM3V 30 TRIPLEX-Flux<br />
24 submitted output<br />
10 runs per site<br />
Schwalm et al., 2010
A Little Bit<br />
Annual<br />
M<strong>on</strong>th<br />
Diurnal<br />
Synoptic<br />
Not Significant<br />
• Error peak at diurnal & annual Kme scales <br />
• Errors at synopKc & m<strong>on</strong>thly Kme scales <br />
Dietze et al., in review
N America is in Demographic Transiti<strong>on</strong><br />
Pan et al., 2011
N America is in Demographic Transiti<strong>on</strong><br />
Successi<strong>on</strong><br />
ASPEN MORTALITY<br />
natural senescence,<br />
pathogens, insects<br />
UNEVEN-<br />
AGED<br />
(maple, oak,<br />
pine)<br />
EVEN-<br />
AGED<br />
(mostly<br />
aspen)<br />
Courtesy P. Curtis<br />
<strong>Forest</strong> age<br />
(years)<br />
WE ARE HERE
Disturbance Frequency is Poorly C<strong>on</strong>strained<br />
• Fire: 40,000 km 2 /year <br />
• Harvest: 50,000 km 2 /year <br />
• Insects: larger <br />
• Storms/hurricanes: > 17,000 km 2 /year <br />
• Disease: ???
Find the Surprise!<br />
Temperature PrecipitaK<strong>on</strong> Atm. Chem, O 3 <br />
NOx <br />
GHGs <br />
Aerosols <br />
Heat <br />
CO 2 <br />
H 2 O <br />
VOCs <br />
Ecosystems
<str<strong>on</strong>g>Direct</str<strong>on</strong>g> <str<strong>on</strong>g>Effects</str<strong>on</strong>g><br />
• Gross Primary ProducKvity (GPP) <br />
– PAR, VPD, T, Q soil , [CO 2 ], N avail <br />
• Ecosystem RespiraK<strong>on</strong> (ER) <br />
– T, Q soil , C:N
Useful Towers
The Value <str<strong>on</strong>g>of</str<strong>on</strong>g> Network Science<br />
• Ecology is a “synthesis” science <br />
Carpenter et al., 2009<br />
Dept <str<strong>on</strong>g>of</str<strong>on</strong>g> Energy, ORNL
Temperature <str<strong>on</strong>g>and</str<strong>on</strong>g> Dryness Explain<br />
Most NEE Variati<strong>on</strong> Across Space<br />
Yi et al., 2011, ERL
Some C<strong>on</strong>vergence <str<strong>on</strong>g>of</str<strong>on</strong>g> GPP<br />
Baer et al., 2010, Science
GPP C<strong>on</strong>trols Are Understood?<br />
Baer et al., 2010, Science
Respirati<strong>on</strong> Sensitivity C<strong>on</strong>verges?<br />
• Low-frequency<br />
comp<strong>on</strong>ent <str<strong>on</strong>g>of</str<strong>on</strong>g><br />
respirati<strong>on</strong> sensitivity<br />
to temperature is<br />
c<strong>on</strong>sistent across<br />
space<br />
Mahecha et al., 2010, Science
<str<strong>on</strong>g>Indirect</str<strong>on</strong>g> <str<strong>on</strong>g>Effects</str<strong>on</strong>g><br />
• Lagged or coupled resp<strong>on</strong>ses <str<strong>on</strong>g>of</str<strong>on</strong>g> climate to <br />
carb<strong>on</strong> uptake <br />
– Temporal/spaKal lags: Phenology, hydrology <br />
– <strong>Forest</strong> dynamics (recruitment, mortality, <br />
growth): Successi<strong>on</strong>al trajectory <br />
– Disturbance frequency/intensity
Phenology Explains GPP, too!<br />
Later springs lead to lower producKvity in U.S. northeastern forests <br />
Richards<strong>on</strong> et al. (2009) <br />
Onset <str<strong>on</strong>g>of</str<strong>on</strong>g> Spring Anomaly (Days)
Models Overpredict Growing Seas<strong>on</strong> Length<br />
• Early spring/late fall uptake means <br />
posiKve GPP bias <br />
Richards<strong>on</strong> et al., submiqed
What About at the Regi<strong>on</strong>al Scale?<br />
• Chequameg<strong>on</strong> Ecosystem-‐Atmosphere Study (ChEAS)
Coherent Carb<strong>on</strong> Sinks Imply Climatic<br />
Forcing <str<strong>on</strong>g>of</str<strong>on</strong>g> Interannual Variability<br />
<strong>Desai</strong> et al., 2010
Model-Data Assimilati<strong>on</strong> Shows<br />
Predictive Skill with Phenology<br />
Short-term <strong>on</strong>ly<br />
assimilati<strong>on</strong><br />
Short <str<strong>on</strong>g>and</str<strong>on</strong>g> l<strong>on</strong>g term<br />
assimilati<strong>on</strong><br />
<strong>Desai</strong> et al., 2010
Even When Model is Forced to<br />
Maintain Coherent Phenology<br />
<strong>Desai</strong> et al., 2010
But Model Explains Coherent Flux<br />
Differently Depending <strong>on</strong> Ecosystem<br />
<strong>Desai</strong> et al., 2010
Phenology is Not Simple!<br />
• Niwot Ridge Ameriflux subalpine fir/spruce <br />
– 3050m elevaK<strong>on</strong> <br />
Hu et al. (2010), Sacks et al. (2006)
Hu et al. (2010) <br />
Moisture Matters
Snow Water Drives Productivity<br />
Soil sfc <br />
Groundwater <br />
Snowmelt <br />
Rain <br />
Soil 35 cm <br />
WATER <br />
SNOW <br />
Hu et al. (2010)
Sulman et al. (2010) <br />
Speaking <str<strong>on</strong>g>of</str<strong>on</strong>g> Hydrology
Do Models Get This?<br />
• Six model intercomparis<strong>on</strong> <br />
– Residuals = Modeled flux – Observed flux <br />
a) ER residuals <br />
Sulman et al., in prep <br />
b) GPP residuals
Water Table is a Critical Model Element<br />
Sulman et al., in prep
What About L<strong>on</strong>ger Time Scales?<br />
Disturbance <br />
Chr<strong>on</strong>osequences <br />
with Annual NEP <br />
measured by eddy <br />
covariance <br />
Fire = 4 <br />
Harvest = 7+ <br />
Insects = 3 <br />
Hurricane Wilma <br />
Amiro et al., 2010
Rapid Carb<strong>on</strong> Sink Recovery Post-Fire<br />
300<br />
200<br />
NEP (g C m -2 y -1 )<br />
100<br />
0<br />
-100<br />
-200<br />
Saskatchewan: Pine<br />
Manitoba: Spruce<br />
Alaska Spruce<br />
Ariz<strong>on</strong>a: Pine<br />
0 20 40 60 80 100<br />
Age (years)<br />
Amiro et al., 2010
C<strong>on</strong>sistent Ratio <str<strong>on</strong>g>of</str<strong>on</strong>g> GPP/ER With Age<br />
2.0<br />
GPP/ER<br />
1.8<br />
1.6<br />
1.4<br />
1.2<br />
1.0<br />
0.8<br />
Ra =<br />
0.55*GPP<br />
Asympto<br />
te =<br />
1.23<br />
0.6<br />
0.4<br />
0.2<br />
Fire<br />
Harvest<br />
0.0<br />
0 20 40 60 80 100<br />
Amiro et al., 2010<br />
Age (years)
Bugs Are Complicated!<br />
600<br />
400<br />
NEP (g C m -2 y -1 )<br />
200<br />
0<br />
-200<br />
Mountain Pine Beetle<br />
<strong>Forest</strong> Tent Caterpillar<br />
Gypsy Moth<br />
-2 -1 0 1 2 3 4 5<br />
Time since disturbance (years)<br />
Amiro et CFS al., web 2010 page
Extensive Bark Beetle Tree Mortality<br />
Suggests Large Impacts to C cycle…<br />
Raffa et al., BioScience, 2008
Growth Reducti<strong>on</strong> Decreases NEP<br />
Usually a temporary phenomen<strong>on</strong><br />
Hicke et al. in revisi<strong>on</strong>
Tree Mortality Decreases NEP<br />
Hicke et al. in revisi<strong>on</strong>
Mortality Recovery Drives Flux Resp<strong>on</strong>se<br />
Hicke et al. in revisi<strong>on</strong>
Where Do We Go From Here?<br />
• More model intercomparis<strong>on</strong> <str<strong>on</strong>g>and</str<strong>on</strong>g> <br />
benchmakring (MsTMIP, C-‐LAMB) <br />
• L<strong>on</strong>g-‐term carb<strong>on</strong>-‐cycle observatories <br />
(Fluxnet/Ameriflux, NEON, Inventory) <br />
• Remote-‐sensing <str<strong>on</strong>g>of</str<strong>on</strong>g> disturbance (LEDAPS) <br />
• Large <str<strong>on</strong>g>and</str<strong>on</strong>g> small scale manipulaKve <br />
experiments (FASET, ABoVE, MnSPRUCE) <br />
• TheoreKcal advancement <br />
• VegetaK<strong>on</strong> dynamics in IPCC models: <br />
Phenology, large-‐scale episodic <br />
disturbance, successi<strong>on</strong>, wetl<str<strong>on</strong>g>and</str<strong>on</strong>g> hydrology
NEON, Inc.
The <strong>Forest</strong> Accelerated Successi<strong>on</strong> ExperimenT (FASET) <br />
NEP (Mg C ha -1 yr -1 )<br />
3.5<br />
3.0<br />
2.5<br />
2.0<br />
1.5<br />
1.0<br />
0.5<br />
0.0<br />
-0.5<br />
1998<br />
2000<br />
Hypothetical NEP<br />
Hypothetical N availability<br />
A<br />
climate<br />
Girdling<br />
2002<br />
2004<br />
2006<br />
2008<br />
Year<br />
disturbance<br />
2010<br />
successi<strong>on</strong><br />
climate<br />
2012<br />
2014<br />
2016<br />
2018<br />
C<strong>on</strong>ceptual model <str<strong>on</strong>g>of</str<strong>on</strong>g> NEP before, during, <str<strong>on</strong>g>and</str<strong>on</strong>g> <br />
following aspen <str<strong>on</strong>g>and</str<strong>on</strong>g> birch mortality. N <br />
availability will have an important effect <strong>on</strong> <br />
final NEP. <br />
B<br />
recovery<br />
C<br />
+<br />
-<br />
N available for plant growth<br />
UMBS <strong>Forest</strong> <br />
Carb<strong>on</strong> Cycle <br />
Research Program <br />
Courtesy <str<strong>on</strong>g>of</str<strong>on</strong>g> C. Gough, VCU
C<strong>on</strong>venM<strong>on</strong>al <br />
theory suggests <br />
declining <br />
producMvity <str<strong>on</strong>g>and</str<strong>on</strong>g> C <br />
storage in over-mature<br />
st<str<strong>on</strong>g>and</str<strong>on</strong>g>s. <br />
Increasing bioMc <br />
<str<strong>on</strong>g>and</str<strong>on</strong>g> structural <br />
complexity with age <br />
could alter this <br />
trajectory. <br />
Figure 1. C<strong>on</strong>ceptual diagram <str<strong>on</strong>g>of</str<strong>on</strong>g> forest age <str<strong>on</strong>g>and</str<strong>on</strong>g> producti<strong>on</strong>.<br />
Recent data have called into questi<strong>on</strong> the extent <str<strong>on</strong>g>of</str<strong>on</strong>g> productivity<br />
decline in mature-to-senescing st<str<strong>on</strong>g>and</str<strong>on</strong>g>s. Most ecosystem models are<br />
poorly equipped to simulate forests in this older age range.<br />
UMBS <strong>Forest</strong> <br />
Carb<strong>on</strong> Cycle <br />
Research Program <br />
Courtesy <str<strong>on</strong>g>of</str<strong>on</strong>g> C. Gough, VCU
Theoretical Development<br />
<str<strong>on</strong>g>Climate</str<strong>on</strong>g> change pressure<br />
Model<br />
parameter<br />
<str<strong>on</strong>g>Change</str<strong>on</strong>g>s in<br />
productivity:<br />
• Warming in cold<br />
climates<br />
• CO 2 fertilizati<strong>on</strong><br />
• Increased<br />
precipitati<strong>on</strong><br />
• Increased<br />
nitrogen<br />
depositi<strong>on</strong><br />
• Increased<br />
drought pressure<br />
Productivity<br />
multiplier<br />
<str<strong>on</strong>g>Change</str<strong>on</strong>g>s in<br />
disturbance rates:<br />
• Severe storms<br />
• Logging <str<strong>on</strong>g>and</str<strong>on</strong>g> l<str<strong>on</strong>g>and</str<strong>on</strong>g><br />
use change<br />
• Insect outbreaks<br />
• Fire<br />
Disturbance<br />
interval<br />
<str<strong>on</strong>g>Change</str<strong>on</strong>g>s in<br />
decompositi<strong>on</strong><br />
rates:<br />
• Warming leads<br />
to faster<br />
decompositi<strong>on</strong><br />
rates<br />
• Increased<br />
drought pressure<br />
Decay rate<br />
multiplier<br />
Sulman et al., in prep
Most Complex Model Has Similar<br />
Sensitivities to All Three <str<strong>on</strong>g>Effects</str<strong>on</strong>g><br />
Combinati<strong>on</strong> effects <str<strong>on</strong>g>of</str<strong>on</strong>g> three<br />
parameters:<br />
• Increased decay rates cause <br />
higher carb<strong>on</strong> uptake <br />
• CO 2 uptake has about the <br />
same sensiKvity to changes <br />
in all three parameters
C<strong>on</strong>clusi<strong>on</strong>s<br />
• MulK-‐year mulK-‐site flux-‐tower observaK<strong>on</strong>s provide <br />
evidence for mechanisms that link phenology, hydrology, <br />
<str<strong>on</strong>g>and</str<strong>on</strong>g> bioKc disturbance to carb<strong>on</strong> cycle <br />
• Ecosystem models need c<strong>on</strong>Knued “acid tests” to <br />
c<strong>on</strong>strain <str<strong>on</strong>g>and</str<strong>on</strong>g> select opKmal model structure <str<strong>on</strong>g>and</str<strong>on</strong>g> <br />
parameters <br />
• Things I didn’t talk about: <br />
– Plant <str<strong>on</strong>g>and</str<strong>on</strong>g> microbial adaptaK<strong>on</strong> <br />
– Invasive species, herbivory, populaK<strong>on</strong> dynamics <br />
– Rapid climate change <br />
– Nutrient cycling <br />
– AquaKc-‐terrestrial linkages <br />
– Coupled water/carb<strong>on</strong> cycle <str<strong>on</strong>g>and</str<strong>on</strong>g> boundary layer feedbacks <br />
– Lots <str<strong>on</strong>g>of</str<strong>on</strong>g> things!
Thanks!<br />
• <strong>Desai</strong> Ecometeorology Lab (flux.aos.wisc.edu): <br />
• Funding partners: UW Graduate school, NSF, <br />
UCAR, NOAA, USDA NRS, NASA, DOE, DOE NICCR, <br />
WI Focus <strong>on</strong> Energy
Model Complexity Drives<br />
Disturbance Sensitivity<br />
200-‐year modeled mean NEE for <br />
different parameter combinaM<strong>on</strong>s <br />
RaMos <str<strong>on</strong>g>of</str<strong>on</strong>g> sensiMvity to the two <br />
parameters <br />
Blue colors = higher C<br />
uptake<br />
Negative numbers =<br />
C uptake