DEMOGRAPHIC PROFILE 2006 Population WARD 4 Source: Statistics Canada 2006 Census 100% 80% 60% 40% 20% 0% 2001 and 2006 <strong>Ward</strong> Population as Percentage <strong>of</strong> <strong>Richmond</strong> <strong>Hill</strong>'s Total Population 26,235 31,180 30,315 29,465 20,550 27,850 22,890 28,315 20,285 23,465 11,320 21,415 2001 2006 Year <strong>Ward</strong> 1 <strong>Ward</strong> 2 <strong>Ward</strong> 3 <strong>Ward</strong> 4 <strong>Ward</strong> 5 <strong>Ward</strong> 6 Population Change by <strong>Ward</strong>, 2001 to 2006 Population 35,000 30,000 25,000 20,000 15,000 31,180 30,315 29,465 28,315 27,850 26,235 23,465 22,890 21,415 20,550 20,285 <strong>Ward</strong> 1 Population Pyramid, 2006 Age Group 85 years 10,000 and 11,320 80 to 84 years 75 to 79 years 70 to 74 years 5,000 65 to 69 years 60 to 64 years 55 to 59 years 0 50 to 54 years 2001 2006 45 to 49 years 40 to 44 years Year 35 to 39 years 30 to 34 years <strong>Ward</strong> 1 <strong>Ward</strong> 2 <strong>Ward</strong> 3 <strong>Ward</strong> 4 <strong>Ward</strong> 5 <strong>Ward</strong> 6 25 to 29 years 20 to 24 years Population 15 to 19 years Change, Percent Change, 10 to 14 years 5 to 9 2001 2006 2001 - 2006 2001 - 2006 0 to <strong>Ward</strong> 4 years1 11,320 21,415 10,095 47.1% <strong>Ward</strong> 2 20,285 23,465 3,180 13.6% 14 12 10 8 6 4 2 0 2 4 6 8 10 12 14 <strong>Ward</strong> 3 22,890 28,315 5,425 19.2% <strong>Ward</strong> 4 20,550 27,850 Percent <strong>of</strong> Population 7,300 26.2% <strong>Ward</strong> 5 30,315 29,465 -850 -2.9% <strong>Ward</strong> 6 26,235 31,180 4,945 Male % Female % 15.9% <strong>Richmond</strong> <strong>Hill</strong> 132,030 162,704 29,660 18.3% 4
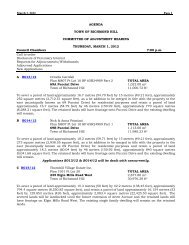
DEMOGRAPHIC PROFILE 2006 Population Density WARD 4 Source: Statistics Canada 2006 Census Note: Density is represented across an entire dissemination area, not a specific geographic location. 5


![Ward 4 Profile [PDF] - Town of Richmond Hill](https://img.yumpu.com/25764780/5/500x640/ward-4-profile-pdf-town-of-richmond-hill.jpg)

![Canada Day Program [PDF] - Town of Richmond Hill](https://img.yumpu.com/25764872/1/167x260/canada-day-program-pdf-town-of-richmond-hill.jpg?quality=85)


![Statistics Fact Sheet - Fall 2009 [PDF] - Town of Richmond Hill](https://img.yumpu.com/25764746/1/190x146/statistics-fact-sheet-fall-2009-pdf-town-of-richmond-hill.jpg?quality=85)