14.1 reteaching
14.1 reteaching
14.1 reteaching

Create successful ePaper yourself
Turn your PDF publications into a flip-book with our unique Google optimized e-Paper software.
Name Date Class<br />
LESSON<br />
14-1<br />
Reteach<br />
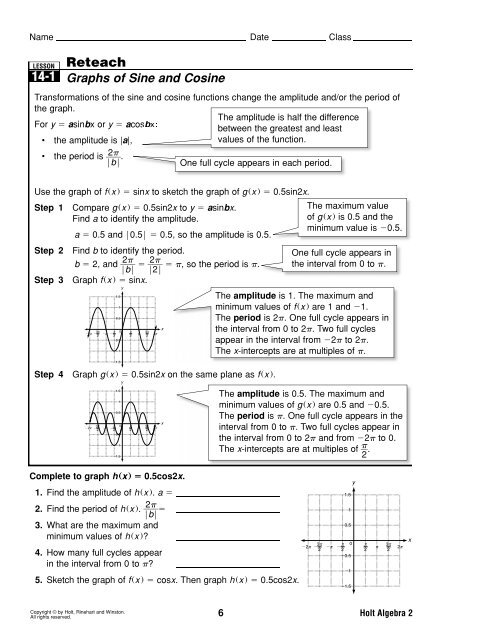
Graphs of Sine and Cosine<br />
Transformations of the sine and cosine functions change the amplitude and/or the period of<br />
the graph.<br />
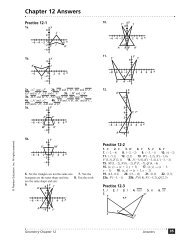
The amplitude is half the difference<br />
For y asinbx or y acosbx:<br />
between the greatest and least<br />
• the amplitude is |a|,<br />
values of the function.<br />
• the period is ___ 2<br />
FbF .<br />
One full cycle appears in each period.<br />
Use the graph of f x sinx to sketch the graph of g x 0.5sin2x.<br />
Step 1 Compare g x 0.5sin2x to y asinbx.<br />
Find a to identify the amplitude.<br />
a 0.5 and F0.5F 0.5, so the amplitude is 0.5.<br />
Step 2 Find b to identify the period.<br />
b 2, and ___ 2<br />
FbF ___ 2 , so the period is .<br />
F2F<br />
Step 3 Graph f x sinx.<br />
<br />
<br />
<br />
<br />
<br />
<br />
<br />
<br />
<br />
<br />
<br />
<br />
<br />
<br />
Step 4 Graph g x 0.5sin2x on the same plane as f x .<br />
<br />
<br />
<br />
<br />
<br />
<br />
<br />
<br />
<br />
<br />
<br />
<br />
<br />
<br />
<br />
<br />
The maximum value<br />
of g x is 0.5 and the<br />
minimum value is 0.5.<br />
One full cycle appears in<br />
the interval from 0 to .<br />
The amplitude is 1. The maximum and<br />
minimum values of f x are 1 and 1.<br />
The period is 2. One full cycle appears in<br />
the interval from 0 to 2. Two full cycles<br />
appear in the interval from 2 to 2.<br />
The x-intercepts are at multiples of .<br />
The amplitude is 0.5. The maximum and<br />
minimum values of g x are 0.5 and 0.5.<br />
The period is . One full cycle appears in the<br />
interval from 0 to . Two full cycles appear in<br />
the interval from 0 to 2 and from 2 to 0.<br />
The x-intercepts are at multiples of __ 2 .<br />
Complete to graph h x 0.5cos2x.<br />
1. Find the amplitude of h x . a 0.5<br />
<br />
2. Find the period of h x . ___ 2<br />
FbF <br />
3. What are the maximum and<br />
minimum values of h x ? 0.5, 0.5<br />
4. How many full cycles appear<br />
in the interval from 0 to ?<br />
1 cycle<br />
5. Sketch the graph of f x cosx. Then graph h x 0.5cos2x.<br />
<br />
<br />
<br />
<br />
<br />
<br />
<br />
<br />
<br />
<br />
<br />
<br />
<br />
<br />
<br />
Copyright © by Holt, Rinehart and Winston.<br />
6 Holt Algebra 2<br />
All rights reserved.
Name Date Class<br />
LESSON<br />
14-1<br />
Reteach<br />
Graphs of Sine and Cosine (continued)<br />
A phase shift is a horizontal translation. Sine and cosine can be translated horizontally<br />
by y sin x h and y cos x h .<br />
A phase shift or horizontal translation of h units moves the graph left h units for h 0 or<br />
right h units for h 0.<br />
Use the graph of f x cosx to sketch the graph of g x cos x __<br />
2 .<br />
Step 1 Compare g x cos x __<br />
2 to y a cosbx.<br />
Find the amplitude and period.<br />
The amplitude and<br />
a 1 and F1F 1, so the amplitude is 1.<br />
period of g are the<br />
b 1, and ___ 2<br />
FbF ___ 2<br />
same as for y cosx.<br />
2, so the period is 2.<br />
F1F<br />
Step 2 Find h to identify the phase shift.<br />
x h x __ Because h 0, the shift is to the right.<br />
__<br />
, so h <br />
2 2 .<br />
The phase shift is __ radians to the right.<br />
Intercepts occur<br />
2<br />
at integer<br />
Step 3 Identify the first two positive x-intercepts.<br />
The x-intercepts of f x cosx occur at __ and<br />
3<br />
2 ___<br />
2 .<br />
multiples of .<br />
The x-intercepts of g x occur at __<br />
3<br />
, or , and ___ , or 2.<br />
2 __ 2<br />
Step 4 Identify the maximum and minimum values.<br />
The maxima and minima of f x cosx occur<br />
at 0 and .<br />
The maxima and minima of g x occur at<br />
3<br />
, or ___<br />
2 .<br />
0 __ 2 , or __ 2 , and __ 2<br />
Step 5 Graph f x cosx and g x cos x __<br />
2 .<br />
2 __ 2<br />
<br />
<br />
<br />
<br />
<br />
<br />
<br />
<br />
<br />
<br />
<br />
<br />
<br />
<br />
<br />
<br />
<br />
<br />
Use the graph of f x sinx to sketch the graph of g x sin x __<br />
2 .<br />
6. Identify h. What is the phase shift?<br />
h __ 2 ; phase shift: __ radians to the right<br />
2<br />
7. Identify the x-intercepts from 0 to 2.<br />
__<br />
2 , ___ 3<br />
2<br />
8. Identify the maxima and minima from 0 to 2.<br />
Maximum of 1 at ; minimum of –1 at 0 and 2<br />
<br />
<br />
<br />
<br />
<br />
<br />
<br />
<br />
<br />
<br />
<br />
<br />
<br />
<br />
9. Sketch the graphs of f x and g x .<br />
<br />
Copyright © by Holt, Rinehart and Winston.<br />
7 Holt Algebra 2<br />
All rights reserved.