14.1 reteaching
14.1 reteaching
14.1 reteaching

You also want an ePaper? Increase the reach of your titles
YUMPU automatically turns print PDFs into web optimized ePapers that Google loves.
Name Date Class<br />
LESSON<br />
14-1<br />
Reteach<br />
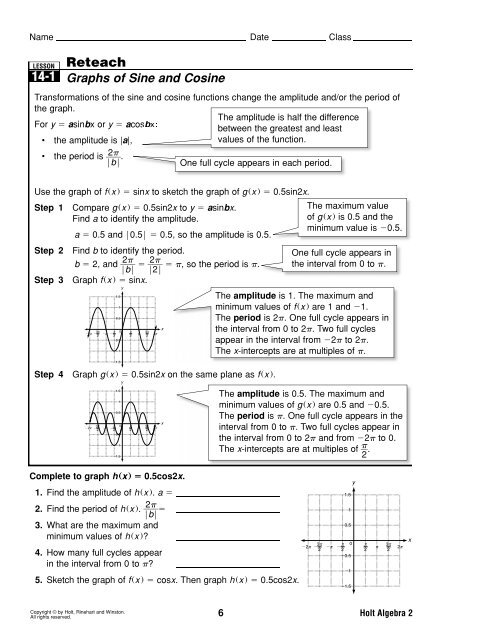
Graphs of Sine and Cosine<br />
Transformations of the sine and cosine functions change the amplitude and/or the period of<br />
the graph.<br />
The amplitude is half the difference<br />
For y asinbx or y acosbx:<br />
between the greatest and least<br />
• the amplitude is |a|,<br />
values of the function.<br />
• the period is ___ 2<br />
FbF .<br />
One full cycle appears in each period.<br />
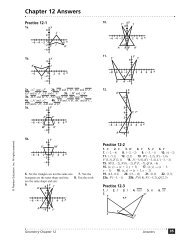
Use the graph of f x sinx to sketch the graph of g x 0.5sin2x.<br />
Step 1 Compare g x 0.5sin2x to y asinbx.<br />
Find a to identify the amplitude.<br />
a 0.5 and F0.5F 0.5, so the amplitude is 0.5.<br />
Step 2 Find b to identify the period.<br />
b 2, and ___ 2<br />
FbF ___ 2 , so the period is .<br />
F2F<br />
Step 3 Graph f x sinx.<br />
<br />
<br />
<br />
<br />
<br />
<br />
<br />
<br />
<br />
<br />
<br />
<br />
<br />
<br />
Step 4 Graph g x 0.5sin2x on the same plane as f x .<br />
<br />
<br />
<br />
<br />
<br />
<br />
<br />
<br />
<br />
<br />
<br />
<br />
<br />
<br />
<br />
<br />
The maximum value<br />
of g x is 0.5 and the<br />
minimum value is 0.5.<br />
One full cycle appears in<br />
the interval from 0 to .<br />
The amplitude is 1. The maximum and<br />
minimum values of f x are 1 and 1.<br />
The period is 2. One full cycle appears in<br />
the interval from 0 to 2. Two full cycles<br />
appear in the interval from 2 to 2.<br />
The x-intercepts are at multiples of .<br />
The amplitude is 0.5. The maximum and<br />
minimum values of g x are 0.5 and 0.5.<br />
The period is . One full cycle appears in the<br />
interval from 0 to . Two full cycles appear in<br />
the interval from 0 to 2 and from 2 to 0.<br />
The x-intercepts are at multiples of __ 2 .<br />
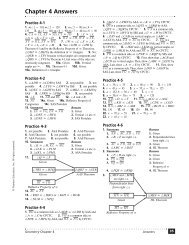
Complete to graph h x 0.5cos2x.<br />
1. Find the amplitude of h x . a 0.5<br />
<br />
2. Find the period of h x . ___ 2<br />
FbF <br />
3. What are the maximum and<br />
minimum values of h x ? 0.5, 0.5<br />
4. How many full cycles appear<br />
in the interval from 0 to ?<br />
1 cycle<br />
5. Sketch the graph of f x cosx. Then graph h x 0.5cos2x.<br />
<br />
<br />
<br />
<br />
<br />
<br />
<br />
<br />
<br />
<br />
<br />
<br />
<br />
<br />
<br />
Copyright © by Holt, Rinehart and Winston.<br />
6 Holt Algebra 2<br />
All rights reserved.
Name Date Class<br />
LESSON<br />
14-1<br />
Reteach<br />
Graphs of Sine and Cosine (continued)<br />
A phase shift is a horizontal translation. Sine and cosine can be translated horizontally<br />
by y sin x h and y cos x h .<br />
A phase shift or horizontal translation of h units moves the graph left h units for h 0 or<br />
right h units for h 0.<br />
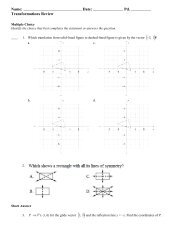
Use the graph of f x cosx to sketch the graph of g x cos x __<br />
2 .<br />
Step 1 Compare g x cos x __<br />
2 to y a cosbx.<br />
Find the amplitude and period.<br />
The amplitude and<br />
a 1 and F1F 1, so the amplitude is 1.<br />
period of g are the<br />
b 1, and ___ 2<br />
FbF ___ 2<br />
same as for y cosx.<br />
2, so the period is 2.<br />
F1F<br />
Step 2 Find h to identify the phase shift.<br />
x h x __ Because h 0, the shift is to the right.<br />
__<br />
, so h <br />
2 2 .<br />
The phase shift is __ radians to the right.<br />
Intercepts occur<br />
2<br />
at integer<br />
Step 3 Identify the first two positive x-intercepts.<br />
The x-intercepts of f x cosx occur at __ and<br />
3<br />
2 ___<br />
2 .<br />
multiples of .<br />
The x-intercepts of g x occur at __<br />
3<br />
, or , and ___ , or 2.<br />
2 __ 2<br />
Step 4 Identify the maximum and minimum values.<br />
The maxima and minima of f x cosx occur<br />
at 0 and .<br />
The maxima and minima of g x occur at<br />
3<br />
, or ___<br />
2 .<br />
0 __ 2 , or __ 2 , and __ 2<br />
Step 5 Graph f x cosx and g x cos x __<br />
2 .<br />
2 __ 2<br />
<br />
<br />
<br />
<br />
<br />
<br />
<br />
<br />
<br />
<br />
<br />
<br />
<br />
<br />
<br />
<br />
<br />
<br />
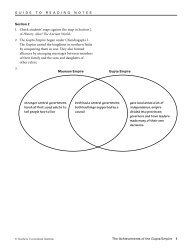
Use the graph of f x sinx to sketch the graph of g x sin x __<br />
2 .<br />
6. Identify h. What is the phase shift?<br />
h __ 2 ; phase shift: __ radians to the right<br />
2<br />
7. Identify the x-intercepts from 0 to 2.<br />
__<br />
2 , ___ 3<br />
2<br />
8. Identify the maxima and minima from 0 to 2.<br />
Maximum of 1 at ; minimum of –1 at 0 and 2<br />
<br />
<br />
<br />
<br />
<br />
<br />
<br />
<br />
<br />
<br />
<br />
<br />
<br />
<br />
9. Sketch the graphs of f x and g x .<br />
<br />
Copyright © by Holt, Rinehart and Winston.<br />
7 Holt Algebra 2<br />
All rights reserved.