Robeco Act.Quant Emerging Markets Eq. I EUR - Robeco.com
Robeco Act.Quant Emerging Markets Eq. I EUR - Robeco.com
Robeco Act.Quant Emerging Markets Eq. I EUR - Robeco.com

You also want an ePaper? Increase the reach of your titles
YUMPU automatically turns print PDFs into web optimized ePapers that Google loves.
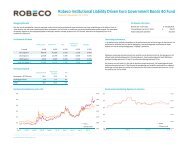
Factsheet Figures as of 31/10/2012<br />
<strong>Robeco</strong> <strong>Act</strong>.<strong>Quant</strong> <strong>Emerging</strong> <strong>Markets</strong> <strong>Eq</strong>. I <strong>EUR</strong><br />
<strong>Robeco</strong> <strong>Act</strong>ive <strong>Quant</strong> <strong>Emerging</strong> <strong>Markets</strong> <strong>Eq</strong>uities invests in stocks of <strong>com</strong>panies in emerging economies throughout the world, such as Korea, Taiwan, Poland and Brazil. These economies can<br />
show rapid growth, so the risks can be greater than those in developed countries. The fund uses a quantitative stock-selection model and aims to benefit from the systematic behavioral mistakes<br />
of investors. This model ranks stocks according to valuation and sentiment. Highly ranked stocks are overweighted against the benchmark, whereas low-ranked stocks are underweighted.<br />
Performance<br />
1 m<br />
3 m<br />
Ytd<br />
1 year<br />
2 years*<br />
3 years*<br />
Start*<br />
*Annualized<br />
Fund<br />
-0.93%<br />
-0.33%<br />
11.52%<br />
11.63%<br />
3.52%<br />
12.00%<br />
6.27%<br />
Calendar Year Performances<br />
Fund<br />
2011<br />
-13.54%<br />
2010<br />
31.53%<br />
2009<br />
93.69%<br />
Rel.<br />
0.35%<br />
-0.08%<br />
0.98%<br />
1.89%<br />
3.06%<br />
3.87%<br />
-<br />
Rel.<br />
3.08%<br />
5.73%<br />
21.73%<br />
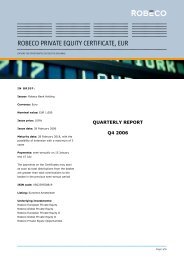
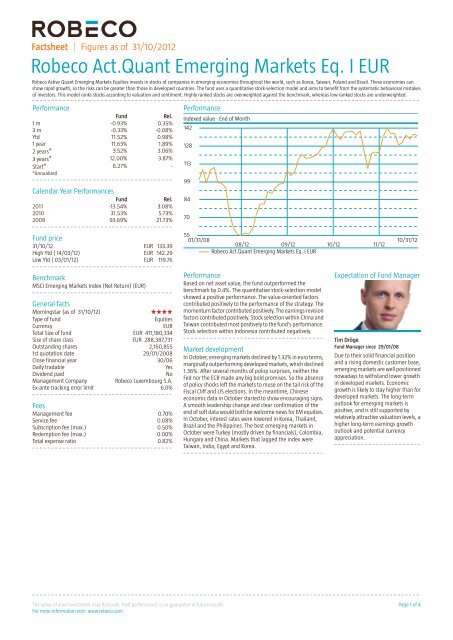
Performance<br />
Indexed value - End of Month<br />
142<br />
128<br />
113<br />
99<br />
84<br />
70<br />
Fund price<br />
31/10/12<br />
High Ytd ( 14/03/12)<br />
Low Ytd ( 03/01/12)<br />
<strong>EUR</strong><br />
<strong>EUR</strong><br />
<strong>EUR</strong><br />
133.39<br />
142.29<br />
119.76<br />
55<br />
01/31/08<br />
08/12 09/12 10/12 11/12<br />
<strong>Robeco</strong> <strong>Act</strong>.<strong>Quant</strong> <strong>Emerging</strong> <strong>Markets</strong> <strong>Eq</strong>. I <strong>EUR</strong><br />
10/31/12<br />
Benchmark<br />
Performance<br />
Expectation of Fund Manager<br />
MSCI <strong>Emerging</strong> <strong>Markets</strong> Index (Net Return) (<strong>EUR</strong>)<br />
Based on net asset value, the fund outperformed the<br />
benchmark by 0.4%. The quantitative stock-selection model<br />
showed a positive performance. The value-oriented factors<br />
General facts<br />
Morningstar (as of 31/10/12)<br />
contributed positively to the performance of the strategy. The<br />
momentum factor contributed positively. The earnings-revision<br />
Type of fund<br />
<strong>Eq</strong>uities factors contributed positively. Stock selection within China and<br />
Currency<br />
<strong>EUR</strong> Taiwan contributed most positively to the fund's performance.<br />
Total Size of fund<br />
<strong>EUR</strong> 411,180,334 Stock selection within Indonesia contributed negatively.<br />
Size of share class<br />
<strong>EUR</strong> 288,387,731<br />
Tim Dröge<br />
Outstanding shares 2,160,855<br />
Fund Manager since 29/01/08<br />
Market development<br />
1st quotation date<br />
29/01/2008<br />
In October, emerging markets declined by 1.32% in euro terms, Due to their solid financial position<br />
Close financial year<br />
30/06<br />
marginally outperforming developed markets, which declined and a rising domestic customer base,<br />
Daily tradable<br />
Yes<br />
1.36%. After several months of policy surprises, neither the emerging markets are well positioned<br />
Dividend paid<br />
No<br />
Fed nor the ECB made any big bold promises. So the absence nowadays to withstand lower growth<br />
Management Company<br />
<strong>Robeco</strong> Luxembourg S.A.<br />
of policy shocks left the markets to muse on the tail risk of the in developed markets. Economic<br />
Ex-ante tracking error limit<br />
6.0%<br />
Fiscal Cliff and US elections. In the meantime, Chinese<br />
growth is likely to stay higher than for<br />
economic data in October started to show encouraging signs. developed markets. The long-term<br />
Fees<br />
A smooth leadership change and clear confirmation of the outlook for emerging markets is<br />
end of soft data would both be wel<strong>com</strong>e news for EM equities. positive, and is still supported by<br />
Management fee<br />
0.70%<br />
In October, interest rates were lowered in Korea, Thailand, relatively attractive valuation levels, a<br />
Service fee<br />
0.08%<br />
Brazil and the Philippines. The best emerging markets in higher long-term earnings growth<br />
Subscription fee (max.)<br />
0.50%<br />
outlook and potential currency<br />
Redemption fee (max.)<br />
0.00% October were Turkey (mostly driven by financials), Colombia,<br />
Hungary and China. <strong>Markets</strong> that lagged the index were appreciation.<br />
Total expense ratio<br />
0.82%<br />
Taiwan, India, Egypt and Korea.<br />
The value of your investment may fluctuate. Past performance is no guarantee of future results.<br />
For more information visit: www.robeco.<strong>com</strong><br />
Page 1 of 4
<strong>Robeco</strong> <strong>Act</strong>.<strong>Quant</strong> <strong>Emerging</strong> <strong>Markets</strong> <strong>Eq</strong>. I <strong>EUR</strong><br />
Factsheet Figures as of 31/10/2012<br />
Top 10 largest positions<br />
Top 10 largest positions<br />
The top ten positions are primarily the result of the fact that Holdings<br />
Sector<br />
%<br />
these <strong>com</strong>panies have a large weight in the benchmark. Samsung Electronics<br />
Information Technology 4.12<br />
China Construction Bank-H<br />
Financials 1.79<br />
Gazprom/ADR<br />
Energy 1.78<br />
Taiwan Semiconductor Manufacturing Company<br />
Information Technology 1.58<br />
Vale SA ADR<br />
Materials 1.49<br />
China Mobile Ltd<br />
Tele<strong>com</strong>munication Services 1.45<br />
Hyundai Motor<br />
Consumer Discretionary 1.40<br />
Bank Of China Ltd - H<br />
Financials 1.36<br />
Industrial & Commercial Bank of China Lt<br />
Financials 1.36<br />
Petroleo Brasileiro SA ADR PRF<br />
Energy 1.36<br />
Total<br />
17.69<br />
Legal status<br />
Statistics<br />
Legal status<br />
Investment <strong>com</strong>pany with<br />
3 years<br />
variable capital incorporated Tracking error ex-post (%)<br />
3.27<br />
under Luxembourg law (SICAV) Information ratio<br />
1.18<br />
Issue structure Open-end Sharpe ratio<br />
0.77<br />
UCITS IV Yes Alpha (%)<br />
3.00<br />
Umbrella fund This fund is a subfund of <strong>Robeco</strong> Beta<br />
1.08<br />
Capital Growth Funds, SICAV Standard deviation<br />
17.01<br />
Share class I Excess return (%)<br />
3.87<br />
-<br />
Registered in Austria, Finland, France, Max. monthly gain (%)<br />
11.28<br />
Germany, Ireland, Italy, Max. monthly loss (%)<br />
-10.31<br />
Luxembourg, Netherlands,<br />
Norway, Singapore, Spain,<br />
Switzerland, United Kingdom<br />
Turnover rate 30/06/2011<br />
124.00<br />
Currency policy<br />
Hit ratio<br />
Currency risk is not hedged.<br />
3 years<br />
Months outperformance<br />
20<br />
Risk management<br />
Hit ratio (%)<br />
55.6<br />
Months Bull market<br />
21<br />
Risk management is fully integrated into the investment Months outperformance Bull<br />
14<br />
process to ensure that positions always meet predefined Hit ratio Bull (%)<br />
66.7<br />
guidelines.<br />
Months Bear market<br />
15<br />
Months outperformance Bear<br />
6<br />
Dividend policy<br />
The fund does not distribute dividend. The fund retains any<br />
in<strong>com</strong>e that is earned and so its entire performance is reflected<br />
in its share price.<br />
Hit ratio Bear (%)<br />
40.0<br />
Fund codes<br />
ISIN<br />
Reuters<br />
Bloomberg<br />
WKN<br />
Valoren<br />
LU0329356306<br />
LP65104278<br />
RCEMEIE LX<br />
A0NDKK<br />
3527523<br />
The value of your investment may fluctuate. Past performance is no guarantee of future results.<br />
For more information visit: www.robeco.<strong>com</strong><br />
Page 2 of 4
<strong>Robeco</strong> <strong>Act</strong>.<strong>Quant</strong> <strong>Emerging</strong> <strong>Markets</strong> <strong>Eq</strong>. I <strong>EUR</strong><br />
Factsheet Figures as of 31/10/2012<br />
Sector spread<br />
The fund's sector allocation is the result of the bottom-up<br />
stock-selection strategy.<br />
Sector spread + deviation benchmark<br />
Financials 27.2 % 1.7 %<br />
Information Technology 13.8 % 0.2 %<br />
Energy 13.0 % 0.0 %<br />
Materials 9.3 % -2.6 %<br />
Industrials 8.1 % 1.7 %<br />
Consumer Discretionary 7.0 % -1.0 %<br />
Tele<strong>com</strong>munication Services 6.9 % -1.1 %<br />
Utilities 6.4 % 2.8 %<br />
Consumer Staples 5.4 % -3.2 %<br />
Other 2.2 % 2.1 %<br />
Liquidity 0.4 % 0.4 %<br />
Health Care 0.3 % -1.0 %<br />
Regional spread<br />
The fund's regional allocation is the result of the bottom-up<br />
stock-selection strategy.<br />
Regional spread + deviation benchmark<br />
Far East 58.3 % -2.3 %<br />
America 18.1 % -3.4 %<br />
Europe 12.5 % 2.6 %<br />
Africa 7.7 % -0.4 %<br />
Other Countries 3.0 % 3.1 %<br />
Liquidity 0.4 % 0.4 %<br />
Currency spread<br />
The fund's currency allocation is the result of the bottom-up<br />
stock-selection strategy. The seemingly high position in USD<br />
originates from the investment in ADRs / GDRs which are<br />
quoted in USD.<br />
Currency spread + deviation benchmark<br />
US Dollar 21.5 % 19.8 %<br />
Hong Kong Dollar 19.2 % 0.8 %<br />
Korean Won 14.1 % -1.1 %<br />
New Taiwan Dollar 9.1 % -1.4 %<br />
South African Rand 6.9 % -0.7 %<br />
Brazilian Real 6.3 % -6.2 %<br />
Indian Rupee 4.6 % -2.2 %<br />
Thai Baht 4.5 % 2.3 %<br />
Other 4.2 % -13.7 %<br />
Malaysian Ringgit 4.0 % 0.2 %<br />
Turkish Lira 3.3 % 1.4 %<br />
Zloty 1.9 % 0.4 %<br />
Liquidity 0.4 % 0.4 %<br />
The value of your investment may fluctuate. Past performance is no guarantee of future results.<br />
For more information visit: www.robeco.<strong>com</strong><br />
Page 3 of 4
<strong>Robeco</strong> <strong>Act</strong>.<strong>Quant</strong> <strong>Emerging</strong> <strong>Markets</strong> <strong>Eq</strong>. I <strong>EUR</strong><br />
Factsheet Figures as of 31/10/2012<br />
Investment policy<br />
The quantitative model that is used for <strong>Robeco</strong> <strong>Act</strong>ive <strong>Quant</strong> <strong>Emerging</strong> <strong>Markets</strong> <strong>Eq</strong>uities is based on a <strong>Robeco</strong> stock-selection<br />
model which is a performance driver for two successful institutional <strong>Robeco</strong> funds. This model ranks stocks according to value,<br />
price momentum and earnings revisions. The <strong>Act</strong>ive <strong>Quant</strong> <strong>Emerging</strong> <strong>Markets</strong> <strong>Eq</strong>uities strategy makes optimal use of the<br />
model’s forecasting power, as it takes advantage of both its positive and negative views on stocks. High-ranked stocks are<br />
used to determine overweight positions, whereas low-ranked stocks are underweight. The size and number of positions provide<br />
a better level of diversification than a fundamentally managed long-only portfolio. This creates an optimized risk-return profile.<br />
Fund Manager's CV<br />
Mr. Tim Dröge is a Senior Portfolio Manager with <strong>Robeco</strong> and a member of the <strong>Quant</strong>itative <strong>Eq</strong>uities team since 2006. He<br />
started his career in the investment industry in 1999 with <strong>Robeco</strong> as Account Manager institutional clients. In 2001 he became<br />
Portfolio Manager Balanced Investments. Tim holds a Master's degree in Business Economics from Erasmus University<br />
Rotterdam.<br />
Fiscal product treatment<br />
The fund is established in Luxembourg and is subject to the Luxembourg tax laws and regulations. The fund is not liable to<br />
pay any corporation, in<strong>com</strong>e, dividend or capital gains tax in Luxembourg. The fund is subject to an annual subscription tax<br />
('tax d'abonnement') in Luxembourg, which amounts to 0.01% of the net asset value of the fund. This tax is included in the<br />
net asset value of the fund. The fund can in principle use the Luxembourg treaty network to partially recover any withholding<br />
tax on its in<strong>com</strong>e.<br />
Fiscal treatment of investor<br />
Investors who are not subject to (exempt from) Dutch corporate-in<strong>com</strong>e tax (e.g. pension funds) are not taxed on the achieved<br />
result. Investors who are subject to Dutch corporate-in<strong>com</strong>e tax can be taxed for the result achieved on their investment in<br />
the fund. Dutch bodies that are subject to corporate-in<strong>com</strong>e tax are obligated to declare interest and dividend in<strong>com</strong>e, as<br />
well as capital gains in their tax return. Investors residing outside the Netherlands are subject to their respective national tax<br />
regime applying to foreign investment funds. We advise individual investors to consult their financial or tax adviser about the<br />
tax consequences of an investment in this fund in their specific circumstances before deciding to invest in the fund.<br />
Morningstar<br />
Morningstar proprietary ratings on funds registered for sale in Europe reflect historical risk-adjusted performance. The ratings<br />
are subject to change every month. The calculation for the Morningstar ratings on funds registered for sale in Europe is<br />
motivated by the expected utility theory. The top 10% of the funds in a category receive five stars, the next 22.5% receive four<br />
stars, the next 35% receive three stars, the next 22.5% receive two stars and the bottom 10% receive one star. The fund was<br />
rated exclusively against funds registered for sale in Europe. All copyrights relating to the Morningstar Rating are held by<br />
Morningstar. For more information on Morningstar, please refer to www.morningstar.<strong>com</strong><br />
Disclaimer<br />
The information in this publication is derived from sources considered to be reliable. <strong>Robeco</strong> assumes no responsibility for the<br />
accuracy and <strong>com</strong>pleteness of the facts, opinions and expectations it contains, or their consequences. While we have taken<br />
every possible care in selecting the information in this publication, we accept no responsibility for any damage resulting from<br />
incorrect or in<strong>com</strong>plete data. This publication is subject to change without prior notice. The value of your investments may<br />
fluctuate, and past performance is no guarantee of future results. The performance figures are based on end-of-month<br />
transaction prices and are calculated on the basis of total returns with reinvestment of dividend. The prices used for the<br />
performance figures of the Luxembourg-based funds are the end-of-month transaction prices up to 4 August 2010. From 4<br />
August 2010, the transaction prices will be those of the first business day of the month. The investment-management result<br />
before deduction of management fees and/or performance fees is based on the performance figures relative to the benchmark.<br />
Fund returns include reinvestment of dividend and are based on the net asset values and exchange rates at the time the<br />
benchmark valuation was performed. Investors may lose all or part of their initial investment. If the currency in which the past<br />
performance is displayed differs from the currency of the country in which you reside, then you should be aware that due to<br />
exchange rate fluctuations the performance shown may increase or decrease if converted into your local currency. A full list<br />
of risks and disclosures can be found in the fund's prospectus. Please read the prospectus carefully before investing. This is<br />
available from <strong>Robeco</strong> offices or from www.robeco.<strong>com</strong>. The total expense ratio referred to in this publication is taken from<br />
the fund's latest (semi)annual report and calculated on the basis of data from the closing date of the last calendar year. All<br />
sources (unless indicated): <strong>Robeco</strong>.<br />
The value of your investment may fluctuate. Past performance is no guarantee of future results.<br />
For more information visit: www.robeco.<strong>com</strong><br />
Page 4 of 4