final report - tum
final report - tum
final report - tum

You also want an ePaper? Increase the reach of your titles
YUMPU automatically turns print PDFs into web optimized ePapers that Google loves.
Conservation and Wise Use of Wetlands –<br />
Global Programme<br />
Project:<br />
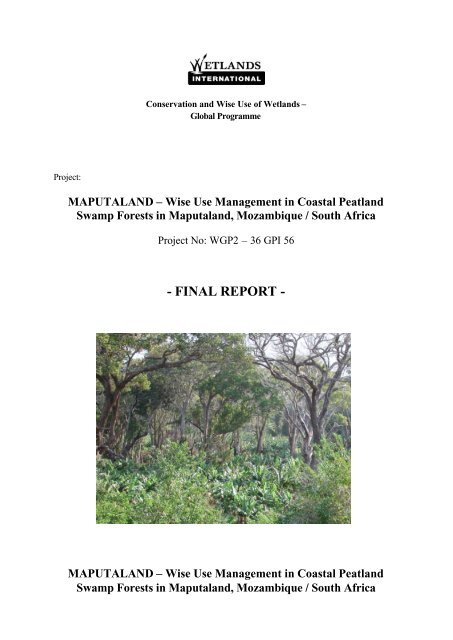
MAPUTALAND – Wise Use Management in Coastal Peatland<br />
Swamp Forests in Maputaland, Mozambique / South Africa<br />
Project No: WGP2 – 36 GPI 56<br />
- FINAL REPORT -<br />
MAPUTALAND – Wise Use Management in Coastal Peatland<br />
Swamp Forests in Maputaland, Mozambique / South Africa
Abbreviations in the following text indicate responsible persons:<br />
JS Jan Sliva PLG P-L Grundling<br />
FE Fred Ellery CM Christoph Moning<br />
DK Donovan Kotze RG Retief Grobler<br />
PT<br />
P.B. Taylor<br />
1. INTRODUCTION (PLG, JS)..............................................................................................3<br />
1.1 AIMS AND GOALS OF THE PROJECT, PROJECT PARTNERS AND ACTIVITIES ..........................3<br />
1.1.1 Fulfilment degree of the project objectives and outputs...........................................4<br />
1.1.2 Project partners.........................................................................................................4<br />
1.2 DELIVERABLES WITHIN THE FIRST PHASE, OUTLOOK FOR THE NEXT PHASES .....................5<br />
2. ECOLOGICAL DIVERSITY AND FUNCTIONS OF CPSF (JS, CM, RG).................5<br />
2.1 INTRODUCTION..................................................................................................................5<br />
2.2 MATERIAL AND METHODS.................................................................................................8<br />
2.2.1 Study area and physical environment........................................................................8<br />
2.2.2 Investigation methods..............................................................................................15<br />
2.3 RESULTS.......................................................................................................................20<br />
2.3.1 Peat swamp forest ecology: Site characteristics – hydrology, peat stratigraphy and<br />
quality, influence of human disturbance ..........................................................................20<br />
2.3.2 Vegetation patterns of Peat Swamp Forest sites depending on human impact/<br />
Regeneration pathways of Swamp Forests.......................................................................36<br />
2.3.3 PSF plant communities: Results and discussion .....................................................40<br />
2.3.4 Peat Swamp Forest Bird communities in pristine and disturbed sites....................55<br />
2.3.5 Functioning of CPSF in the landscape....................................................................56<br />
2.5 ANNEX CHAPTER 2..........................................................................................................58<br />
3. ORNITHOLOGICAL SURVEYS OF SWAMP FOREST IN THE GREATER ST<br />
LUCIA WETLAND PARK, AND AN ASSESSMENT OF THE TOURISM<br />
POTENTIAL OF THIS HABITAT (PT).............................................................................82<br />
3.1 SURVEY AREAS AND VISITS ...................................................................................82<br />
3.2 RESULTS - BIRDS........................................................................................................82<br />
3.2.1 Birds associated with swamp forest ........................................................................82<br />
3.2.2 Selected bird species of vegetated wetlands adjacent to swamp forest...................84<br />
3.2.3 Recorded and [possible] bird species at Ozabeni (Robson & Horner 1996) .........85<br />
3.2.4 Additional possible bird species..............................................................................85<br />
3.3 RESULTS - MAMMALS ..............................................................................................86<br />
3.4 CONCLUSIONS ............................................................................................................86<br />
4. DISTRIBUTION, MAPPING AND EVALUATION OF CPSF (FE, PLG) .................87<br />
4.1 INTRODUCTION................................................................................................................87<br />
4.2 METHODS USED FOR INVENTORY, MAPPING AND EVALUATION .......................................87<br />
4.3 RESULTS..........................................................................................................................88<br />
4.3.1 Geomorphological settings of interdune peatlands.................................................89<br />
4.4 TENDENCIES/ SCENARIOS (E.G. THE FUTURE OF CPSF AREAS, PRESUMED THE DAMAGE<br />
CONTINUES IN THE SAME EXTENT; AND THE CONSEQUENCES) ...............................................90<br />
4.5 OUTLOOK FOR FURTHER WORK........................................................................................91<br />
4.7 GENERATION OF A MAP OF PEAT SWAMP FOREST DISTRIBUTION IN MAPUTALAND USING<br />
REMOTE SENSING DATA (FE) .................................................................................................91<br />
4.7.1 Introduction.............................................................................................................91<br />
1
4.7.2 Methods used for inventory, mapping and evaluation............................................92<br />
4.7.3 Results......................................................................................................................94<br />
3.7.4 An assessment of trend ............................................................................................96<br />
3.7.5 Outlook for further work .........................................................................................97<br />
4.6 ANNEX CHAPTER 4..........................................................................................................97<br />
4.6.1 Characterisation of individual peatlands of Maputaland .......................................97<br />
4.6.2 Result maps............................................................................................................122<br />
5 SOCIO-ECONOMIC BACKGROUND AND CURRENT UTILIZATION OF THE<br />
KOSI BAY SWAMP FORESTS (DK, JN).........................................................................127<br />
5.1 SOCIO-ECONOMIC BACKGROUND...................................................................................127<br />
5.1.1 A brief history the Kosi Bay area and utilization of its swamp forests.................127<br />
5.1.2 The socio-economic status of the Kosi Bay Area ..................................................131<br />
5.2 CURRENT AND ALTERNATIVE FUTURE LAND-USE OPTIONS IN KOSI BAY’S PEAT SWAMP<br />
FORESTS ..............................................................................................................................136<br />
5.2.1 Rationale and objectives........................................................................................136<br />
5.2.2 Methodology..........................................................................................................137<br />
5.2.3 Results of the survey of individual plots................................................................137<br />
5.2.4 The rapid visual appraisal of plots........................................................................142<br />
5.3 AN EXAMINATION OF ALTERNATIVE LAND-USE OPTIONS...............................................143<br />
5.3.1 Approach used in identifying alternatives.............................................................143<br />
5.3.2 Tourism..................................................................................................................144<br />
5.3.3 Enhanced productivity of upland gardens and field crops....................................145<br />
5.3.4 Enhanced productivity of wetland margin gardens...............................................146<br />
5.3.5 New commercial crops ..........................................................................................147<br />
5.3.6 Cultivation and processing of Raphia palms.........................................................147<br />
5.3.7 Crafts woven from wetland sedges ........................................................................148<br />
5.3.8 Plantation forestry.................................................................................................149<br />
5.3.9 Public works programmes.....................................................................................149<br />
5.3.10 Other alternatives................................................................................................150<br />
5.3.11 Summary of the features of potential alternatives to swamp forest cultivation ..150<br />
5.3.12 Issues around control of land-use activities........................................................151<br />
5.4 A FRAMEWORK TO ELUCIDATE AND RESOLVE CONFLICTING LAND USE OPTIONS FOR PEAT<br />
............................................................................................................................................153<br />
5.4.1 Application of the framework to the situation at Kosi Bay ...................................154<br />
5.4.2 Recommendations for revision of the framework of Joosen and Clarke (2002)...157<br />
5.5 ANNEX CHAPTER 5........................................................................................................158<br />
6 RECOMMENDATIONS FOR BUILDING A COMMON FUTURE AND<br />
PROMOTING WISE USE OF THE SWAMP FORESTS...............................................162<br />
6.1 RECOMMENDATIONS FOR NEGOTIATING A COMMON FUTURE ........................................162<br />
6.2 RECOMMENDATIONS FOR BUILDING AWARENESS ..........................................................162<br />
6.3 RECOMMENDED BEST MANAGEMENT PRACTICES .........................................................163<br />
6.4 SUMMARY OF RECOMMENDATIONS ...............................................................................165<br />
6.5 RECOMMENDATIONS FOR FURTHER RESEARCH..............................................................166<br />
7. REFERENCES .................................................................................................................168<br />
2
1. Introduction (PLG, JS)<br />
1.1 Aims and goals of the project, project partners and activities<br />
A main goal of the MAPUTALAND project is first to determine the extent of the distribution of peat<br />
swamp forests in Maputaland with a narrow link to IMPESA (Identification and Mapping of Peatlands<br />
in Southern Africa) and second to determine the associated land use impacts. The long-term aim is to<br />
suggest/ provide alternative land use practices that will benefit both local human populations and the<br />
environment.<br />
The project runs under the GPI (Global Peatland Initiative) focal area “Peatlands/ Poverty reduction”:<br />
Integrated development (although with direct links to the focal area “Biodiversity conservation”).<br />
It does also compliment the southern African objectives as set out by the South African Peatland<br />
Group (cf. Sliva & Heinl 2002).<br />
The project addresses the following GPI short-term objectives:<br />
?? On the ground projects, especially in developing and transitional counties<br />
?? Dissemination of IMCG/IPS global wise use guidelines<br />
?? Promotion of the (CBD) Ecosystem Approach for Management of peatlands<br />
?? Awareness and education activities<br />
?? Evaluation of peatlands<br />
?? Regional capacity building<br />
Based on the above-mentioned GPI objectives, following aims have been developed for the<br />
MAPUTALAND project:<br />
1. Improvement of scientific based knowledge<br />
1.1 Initiating and completion of inventory on Coastal Peatland Swamp Forest, using of LANDSAT<br />
imagery, available aerial photographs, current map information and ground-base fieldwork<br />
1.1.1 in South African part of Maputaland<br />
1.1.2 in Mozambique: only general overview of current situation of CPSF (non exhaustive study;<br />
limited field work)<br />
1.2 Study on ecological diversity (floristic and faunistic diversity), main ecological values and<br />
functions (incl. habitat quality) of CPSF<br />
1.2.1 in selected CPSF sites in South Africa<br />
1.3 Study on traditional use of CPSF by local human population and by large scale use by communal<br />
horticulture, forestry and agriculture; evaluation and assessment of actual and potential threats;<br />
evaluation of the short-term and long-term impacts of land use practices on CPSF<br />
1.3.1 South Africa: comprehensive study<br />
1.3.2 Mozambique: general study only<br />
3
2. Wise use based management – proposal of alternatives<br />
2.1 Based on newest data (see 1.) development of alternative (wise) use forms of CPSF and/or of<br />
areas of former CPSF (actually degraded or transformed peatlands), respecting the local needs and<br />
cultural traditions.<br />
3. Awareness improvement of and consideration in the education and training<br />
3.1 Awareness rising by the narrow co-operation with, and the involvement of the local<br />
community.<br />
1.1.1 Fulfilment degree of the project objectives and outputs<br />
1. Improvement of scientific based knowledge<br />
1.1 Based on field survey, map and GIS-data evaluation as well as on the aerial photographs and<br />
satellite data analysis (data purchased or provided by the department of Agriculture) the complete<br />
map of the Coastal Peat Swamp Forests in South Africa and Mozambique in two categories<br />
(pristine; degraded) was developed<br />
1.2 The group University of Pretoria [UP] and Technical University Munich [TUM] has laid out two<br />
field campaigns in May and September 2003. Detailed <strong>report</strong> on the (vegetation) ecology,<br />
floristics and peatland ecology of the CPSF produced<br />
1.3 Traditional use and the new horticultural practices and its impacts on the forests were evaluated<br />
during the field campaign (cf. ii) and are combined with the findings of the group around D. Kotze<br />
who is responsible for the socio-economical aspects (see 2).<br />
2. Wise use based management – proposal of alternatives<br />
The comprehensive survey (see <strong>final</strong> <strong>report</strong>) on the social and economical background of the forest<br />
exploitations is laid out in the group around D. Kotze (Pietmaritzburg). The affiliation of Mr. Ngubane<br />
(Tembe) helps and improves the in-sight knowledge on the socio-economical problems in relation to<br />
the peat swamp forest use.<br />
3. Awareness improvement of and consideration in the education and training<br />
The aims of the project, as well as the importance of the swamp forest for the local community<br />
because of its multilateral functions and values, was brought forward to the Tembe Authorities during<br />
the meetings in May 2003. The local guides who support the field work were trained and educated in<br />
this respect and they act well as multipliers of information for the locals. After termination of this<br />
project phase, it is intended to produce a leaflet about the functions and values of the peat swamp<br />
forests and the necessity of the wise use of this resource in Zulu language, and disseminate this<br />
information within the Maputaland area (presumed funds will be found)<br />
1.1.2 Project partners<br />
Technische Universitaet Muenchen, Germany on behalf of IMCG, Lille, France<br />
University of Pretoria, Pretoria, South Africa<br />
4
University of Natal, South Africa<br />
Tembe Tribal Authority, KwaNganase, KwaZulu-Natal, South Africa<br />
Ezemvelo KZN Wildlife, South Africa<br />
National Department of Agriculture, Pretoria, South Africa<br />
Ihlaphosi Enviro Services cc, South Africa<br />
1.2 Deliverables within the first phase, outlook for the next phases<br />
Deliverables:<br />
1. South Africa: Peatland Swamp forest inventory maps (Mapped on 1:50 000 /inferred level); GIS<br />
format and paper print in scale 1: 250 000.<br />
2. Mozambique: Report on current status of Peatland Swamp Forest in Maputaland Mozambique<br />
(approx. area and distribution; land use practices; conservational status; type and extent of actual<br />
threats)<br />
3. South Africa: Study on ecological functions and values of CPSF (MSc quality)<br />
4. South Africa: Study on traditional and current land use practices in CPSF areas, with special<br />
focus on corresponding short-term and long-term threats for the ecosystem (MSc quality)<br />
5. South Africa: Study on principles (methods and tools) of alternative sustainable (wise) use of<br />
CPSF and/or former CPSF sites (currently degraded peatlands) outside of conservational areas<br />
with special emphasis on the inter-communicative planning procedure (incorporation of local<br />
populations into the proposal making) (BSc quality)<br />
2. Ecological diversity and functions of CPSF (JS, CM, RG)<br />
2.1 Introduction<br />
Coastal peat swamp forests (CPSF) are fresh water forested wetlands that are established on peat soils<br />
adjacent to an ocean. These ecosystems require a high water table with periodic saturated conditions,<br />
as a result of flooding, that creates a favourable hydrological regime for peat development. If the<br />
hydrological regime would for some reason become too dry, due to natural events or anthropogenic<br />
interference, the systems would no longer be an active mire but could still persist with normal<br />
functioning as long as the peat layer remains intact.<br />
Swamp forests in general are predominately located in the tropics and to a lesser extend in the<br />
subtropics, but also occur in the temperate areas of North America and Europe (Wessels 1997). In<br />
Africa there are several types of peat swamp forests. In Nigeria for example, they are characterized by<br />
species such as Cleistopholis patens, Ficus congensis, Syzygium guineense, and Voacanga obtusa,<br />
while many parts of West Africa and the Central basin of Congo are characterized by locally<br />
dominating stands of the palm Raphia farinifera (Thompson & Hamilton 1983). In South-eastern<br />
Africa Raphia farinifera is replaced by another palm Raphia australis, also forming locally<br />
dominating stands in Mozambique and southwards to the most north-eastern corner of Maputaland,<br />
South Africa. Mozambique is well known for a special type of swamp forest that can tolerate and<br />
thrive in saline conditions – mangrove swamps. Mangroves are a common vegetation feature all along<br />
5
the Mozambique coast, forming large peat deposits and typically grow in estuaries where there is less<br />
wave energy. They are able to form a continuous vegetation connection with fresh water swamp forest,<br />
resulting in a gradient of salt-tolerant to salt-intolerant swamp forest communities (Thompson &<br />
Hamilton 1983). In the Kosi Lake System (KLS) there are both fresh water swamp forest and<br />
mangrove swamp forest, although they are distinct from one another and geographically separated.<br />
Only the fresh water swamp forests are at risk from subsistence farming, as the saline conditions of the<br />
mangrove swamp forests would be completely unfavourable for crop cultivation.<br />
Swamps forests are highly threatened ecosystems in South Africa, being the second rarest forest type<br />
in the whole country and only occur in isolated patches from the Mozambique border to just south of<br />
the Msikaba river in the eastern Cape (Moll 1980; Wessels 1997). Roughly 3 986 ha of swamp forest<br />
occur in Maputaland of which a great deal is still unclassified due to their remoteness and<br />
inaccessibility. The swamp forests on the flat coastal plain of Maputaland form 75 % of all swamp<br />
forest found in South Africa which make them very valuable for future conservation (Lubbe 1997). In<br />
Maputaland the largest sections of swamp forest, comprising a total of 59 % of all South African<br />
swamp forest are protected inside the Greater St. Lucia Wetland Park (Wessels 1997). The largest<br />
intact individual peat swamp forest in South Africa occurs adjacent to the Syhadla River, the main<br />
source of fresh water for the KLS, with a total area of 880 ha (Wessels 1997). CPSF in South Africa<br />
and especially those around Kosi Bay are under threat from various sources. In the past large areas of<br />
swamp forest was cleared for sugarcane farming, forestry, slash and burn agriculture, and eradicating<br />
of tsetse fly and mosquito habitat, but are now provided better protection through legislation and<br />
alternative insect pest control practices. Although it is presently virtually impossible to erect new<br />
commercial sugarcane farms and forestry plantations in swamp forest habitat, the lasting effect of<br />
existing farming and forestry activities are still felt. The reason being that these activities, even when<br />
they are some distance removed from swamp forest habitat, are responsible for lowering the water<br />
table by removing large quantities of the available water from the catchment via evapotranspiration<br />
and drainage.<br />
The Tonga people of the Tembe Tribe have been living next to the KLS for centuries and use the<br />
indigenous plants from the swamp forest for various purposes: For construction material, especially<br />
the palm Raphia australis, whose leaf has an extremely long ragis that is light and strong and therefore<br />
an excellent component for building canoes, ladders, roofs and even walls. There is presently less<br />
stress on the palm as its use in house construction has subsided due to it being seen more and more as<br />
a sign of poverty, it is also protected as one of the area’s endemic plant species that prohibits felling<br />
any live specimens. Many of the indigenous swamp forest plants are also used as medicines, and food<br />
resources, such as berries from Syzygium corda<strong>tum</strong>.<br />
Slash and burn agriculture on peat soils of swamp forests do however posses the highest risk to CPSF<br />
in the Kosi Lake System. The peat soils of the swamp forests provide the only suitable habitat for<br />
cultivating crops (see section on soil) especially bananas (Musa) and also others, such as Colocasia<br />
esculenta, sweet potato (Ipomoea batatas), and manioc or as it is locally known umDumbula (Casava<br />
edulis). Peat soils of swamp forests are favoured above other peat soils such as those from open<br />
swamps dominate by stands of Typha capensis and Phragmites australis, because swamp forest peat<br />
soils are typically sloped. These slopes were created by rivers and streams with which swamp forests<br />
6
are always closely associated and make it possible for the peat soils to be more easily drained to allow<br />
cultivation as opposed to the flat open wetlands. The need for more food and therefore more crop<br />
cultivation is also continually escalating and intensifies due to the following reasons:<br />
?? A general increase in population growth as health services and infrastructure have improved<br />
over the last few decades.<br />
?? Many miners have been retrenched as mines closed in Gauteng and the Free State, leading to<br />
increase poverty and more mouths to feed.<br />
?? Portuguese and Tonga speaking illegal immigrants continue to flock to the area, while the<br />
local Tembe people do not treat them, especially fellow Thongas, with antagonism, but rather<br />
feel obligated to help them, leading to yet more gardens being established.<br />
?? HIV/Aids is also becoming a serious problem causing yet more poverty as the breadwinners<br />
are commonly those most at risk to the disease. As the disease proliferates it creates the need<br />
for yet more nutrient supplements to stay healthy for longer. These additional nutrient sources<br />
can only be guaranteed from one source in this poverty stricken community: peat swamp<br />
forests.<br />
The main crop cultivated in gardens is bananas (Musa paradisiaca) and the reasons for this is varied,<br />
yet perfectly logical. Musa paradisiaca is not native to Africa, but was introduced to Africa from<br />
Southeast Asia, their cradle of origin and land of cultivation, approximately 2000 years ago and ever<br />
since became an integral part of the food supply (Reader 1997). This is clearly reflected in the 250 kg<br />
of bananas that a present day average African consumes annually in the tropical and subtropical parts<br />
of the continent where it has been a very important staple food source for centuries (Reader 1997).<br />
Bananas are an excellent energy food source, second only to cassava (Manihot esculen<strong>tum</strong>) in calorie<br />
yield and two to three times more productive than cereals. They have high concentrations of vitamin C<br />
and potassium, but are unfortunately low in iron, calcium, and virtually contains no proteins or fat<br />
(Reader 1997). It is therefore a very good food supplement for the Tembe people living around the<br />
Kosi Lake System, because their diet that is already rich in fish consumption that contains the<br />
nutrients that bananas lack. Musa paradisiaca is easy to cultivate and in return yields large quantities<br />
of fruit that makes the crop a very good investment for any farmer and his family. A well maintained<br />
banana garden in favourable conditions that may or may not be cultivated on peat are known to<br />
produce good crops for thirty years or more (Reader 1997). Such ease of cultivation has allowed many<br />
African farmers and their families to rely on bananas on plots typically smaller than one hectare. In<br />
order for bananas to be grown throughout the whole year they require a more or less continuous<br />
rainfall and temperatures always relatively high. Peat swamp forest habitats fit this description<br />
perfectly, being located in a more or less longitudinal strip adjacent to the coastline that receives high<br />
rainfall with warm temperatures throughout the year and the absence of frost during winter (see<br />
section on climate 2.2.1 ). This allows a year round growing season for Musa paradisiaca as well as<br />
other cultivated crops.<br />
7
2.2 Material and Methods<br />
2.2.1 Study area and physical environment<br />
Maputaland<br />
Maputaland is located in the north-eastern corner of KwaZulu-Natal and is confined by the RSA-<br />
Mozambique border to the north, the Indian Ocean to the east, the Lebombo Mountains and Swaziland<br />
to the west and the Mkuzi River and Lake St. Lucia to the south (Moll 1977). Maputaland forms part<br />
of the Mozambique coastal plain and comprises a broad, flat to undulating, cretaceously uplifted,<br />
sandy region about 60 km in width (Figures 1-3). Maputaland is also situated mostly within the<br />
Coastal Bushveld/ Grassland Biome of Southern Africa (Low and Rebelo 1996). Many plant and<br />
animal species reach their southernmost distribution limit here, which indicates that Maputaland can<br />
be understood as the southern end of the tropics in Africa (Van Wyk 1994), although tropical<br />
influences in the flora extend as far as Alexandria Forest between Port Elizabeth and East London<br />
(Meadows 1985).<br />
The boundaries of the Maputaland Centre are biogeographically clearly defined, except in the north,<br />
where the line is arbitrary (Van Wyk 1994). Biogeographically Maputaland is to a large extend part of<br />
the Maputaland coastal forest mosaic (WWF 2001), which also extends far into Mozambique (up to<br />
Xai Xai in the north) while phytogeographically, it is part of the Indian Ocean Coastal Belt (Moll and<br />
White 1978), which is both a regional transitional zone and a regional mosaic (White 1976a).<br />
Maputaland is characterized by a high species richness (e.g. 2 500 plant species/ interspecific taxa (van<br />
Wyk et al. 2001); 470 bird species including five endemics (Harisson et al. 1997)) and a high<br />
proportion of endemic plant (9.2% of vascular plant species) and animal species (Moll 1980,<br />
Stattersfield et al. 1998, WWF 2001). In addition many plant species are centred in the Maputaland<br />
Centre of endemism (Davis et al. 1994). Therefore it forms floristically part of the Tongaland-<br />
Pondaland Regional Mosaic (White 1983, Meadows 1985), a region which displays at least three foci<br />
of high floristic endemism, namely the Maputaland Centre in the north (extending along the coast<br />
between Richards Bay in the South and Xai-Xai in the North) and the Pondoland Centre and Albany<br />
Centre to the south (van Wyk 1994, van Wyk et al. 2001). For its size, which is approximately 26 734<br />
km², the Maputaland Centre is one of the most remarkable areas of biodiversity in the world. Not only<br />
is the number of endemic species high, but also they are spread over virtually the entire taxonomic<br />
spectrum. The total number of vascular plant species in the Maputaland Centre is at least 2 500, with a<br />
minimum of 225 species or infraspecific taxa being endemic or near endemic to the centre<br />
(MacDevette et al. 1989, Van Wyk 1994b). Of the more than 472 species of birds in the Maputaland<br />
Centre (almost 60% of South Africa’s total), 4 species and approximately 43 subspecies are endemic<br />
or near endemic. Other endemic or near-endemic species and infraspecific taxa include 14 species of<br />
mammals (of more than 100 species recorded), mainly of subspecific rank, 23 species of reptiles (of<br />
approximately 112 species), 3 species of frogs (of 45 species or subspecies) and 8 of 67 species of<br />
freshwater fish (Van Wyk 1996). Even on a worldwide scale this diversity of rare animals and plants<br />
concentrated in such a small area is unusual. Most of the endemic taxa appear to have evolved only<br />
recently. Evidence for this does include the large number of infraspecific endemics and the young age<br />
of most of the sandy coastal plain, perhaps less than one million years (WWF 2001). The boundaries<br />
of the Maputaland centre also enclose the southern portion of the Southeast African coast Endemic<br />
Bird Area (Stattersfield et al. 1998), which extends into Swaziland. Additionally to the endemic<br />
8
species the vegetation of Maputaland is in general exceptionally diverse. This is also because of a<br />
diverse mosaic, which consists of forests, woodlands, grasslands, swamps and coastal habitats. Moll<br />
(1980) classified the vegetation of Maputaland into 15 major types, ranging from coast with coastal<br />
grassland and dune forest through different types of bushveld, sandforest and swamps up to the forest<br />
on the Lebombo Mountain Range.<br />
Maputaland also contains the most extensive wetlands, which in turn host the best-developed peat<br />
deposits in KwaZulu-Natal and in the whole of South Africa (Grundling et al. 1998). Lake St. Lucia<br />
covers approximately 350 Km² and is the largest estuarine system in Africa. Lake Sibaya (60Km²) is<br />
the largest freshwater lake in southern Africa. The largest perennial river in Maputaland, the Pongola,<br />
was dammed in the 1960’s where it passes through the Lebombo Mountains (WWF 2001). In the 266<br />
known peatlands of Maputaland, the thickness of peat ranges between
Mozambique<br />
N<br />
Ingwavuma<br />
River<br />
Ndumo GR<br />
Ndumo<br />
Tembe<br />
Elephant<br />
Park<br />
Manguze<br />
Kosi Bay<br />
Lake<br />
System<br />
10 Km<br />
Swaziland<br />
Ingwavuma<br />
Pongola River<br />
Sileza<br />
Forest<br />
Reserve<br />
Kosi Bay<br />
Coastal Forest<br />
Reserve<br />
Lake Sibaya<br />
Pongolapoort Dam<br />
Lebombo Mountain NR<br />
Mkuzi<br />
Mkuzi River<br />
Mkuzi GR<br />
Sodwana Bay<br />
Indian Ocean<br />
Lake St. Lucia<br />
Republic<br />
Of<br />
South<br />
Africa<br />
Figure 1. Map of the South African part of Maputaland: Game Reserves (GR), main water bodies and major<br />
roads (after Lubbe 1997)<br />
10
Main study area: Kosi Bay Catchment Area<br />
Topography and Landscape<br />
Kosi Bay<br />
Catchment area<br />
N<br />
40 Km<br />
1-50 m 50-100 m >100 m<br />
Figure 2. Map showing topography of Maputaland (after Bruton et al. 1983)<br />
Maputaland is predominantly a flatly undulating, low-level coastal plain dominated by sand ridges<br />
(Matthews 2001, Figure 2). It is known as the Zululand or Mozambique Coastal Plain (Hobbay 1979,<br />
Moll 1980). The Lebombo Range in the west rises up to some 600 m and forms at the same time the<br />
western boundary of Maputaland. The coast is topographically dominated by the north-south tending<br />
coastal dune ridge. It rises up to an elevation of 183 m above sea level and extends from Mtunzini<br />
northward well into Mozambique. Some of the largest coastal cordons in the world can be found here<br />
(Hobday 1979). The land immediately behind the coastal dune ridge is flat and also characterized by<br />
flatly undulating dunes. In between the dunes PSF can be found in the interdunal depressions. In this<br />
zone also the big lake systems like the Kosi Lakes can be found.<br />
Geology<br />
The formation of the modern landscape started after the resistant volcanic rhyolite lavas that form the<br />
Lebombo Range and underline the coastal plain where steeply tilted eastwards during the break up of<br />
Gondwanaland 140 million years ago. At the newly formed coastline, on the seaward sloping rhyolite<br />
base, Cretaceous marine sedimentary rock and conglomerates were laid down to form the present day<br />
level coastal plain (Maud 1980). From the end of the Cretaceous, through the Tertiary and Quaternary,<br />
the coastal plain was repeatedly exposed and submerged as the southern African continental margin<br />
flexed and worldwide sea levels rose and fell. Recurring marine transgressions and regressions<br />
11
esulted in cycles of sedimentation and erosion, with marine deposits being laid down, then eroded and<br />
redistributed by wind and water. The result has been the formation of a series north-south aligned dune<br />
ridges parallel to the present day coastline. The largest part of these dunes are of Pleistocene<br />
(beginning: 1.6 million years B.P.) to recent age, most of them having formed over the past 25 000<br />
years and thus consist of superimposed sediment strata of different ages (Maud 1980). Many of the<br />
large dunes exceed 160 m in height, the highest being the Mapelane dune (183 m) near to the village<br />
of St. Lucia (Goodman 1990). Thus most of the Maputaland coastal plain is covered with recent,<br />
infertile, wind distributed sands (Figure 3).<br />
SEA<br />
LEVEL<br />
WEST<br />
Lebombo<br />
Range<br />
Terrace<br />
Gravels<br />
LEBOMBO<br />
RHYOLITE<br />
Red<br />
Sands<br />
Tertiary<br />
Sediments<br />
Pongola<br />
River<br />
Alluvium<br />
Tertiary<br />
Sediments<br />
Grey Sand<br />
Port Dunford Beds<br />
Red Sands<br />
CRETACEOUS<br />
SEDIMENTS<br />
Coastal Dune<br />
Sand<br />
Grey Sand<br />
EAST<br />
Coastal<br />
Sandy<br />
Limestone<br />
Indian<br />
Ocean<br />
Figure 3. Schematic geological cross-section of Maputaland (not to scale) (after Bruton et al. 1980)<br />
Because of the lack of any major mineral wealth, the development options for Maputaland are largely<br />
limited to the rational and sustainable utilization of its renewable natural resources (mainly agricultural<br />
output and eco-tourism industry) (Watkeys et al. 1993). Caused by the soil characteristics of<br />
Maputaland (see paragraph below) the agricultural land is mainly restricted to peat-soils, which makes<br />
their sustainable use especially essential for the whole of the Maputaland region.<br />
Soil<br />
The soil of Maputaland does mainly consist of Arenosols and Alluvials (von Harmse in Werger 1978).<br />
It can be characterized as very sandy, leached and low in nutrients, which gives it a low agricultural<br />
potential. The dunes of the coastal areas are mainly consisting of pure quartz sand with local<br />
concentrations of heavy minerals such as ilmenite, rutile, zircon and magnetite (Hobday 1979). Recent<br />
sands are whitish, whereas older sands are reddish to brownish with higher clay content. On older<br />
dunes with closed woody vegetation, the soils are dark greyish-brown sand with relatively high humus<br />
content (Weisser and Cooper 1993). Typical features for the region are impermeable horizons within<br />
the soil profile, which is due to leaching as a result of the high rainfall (Watkeys et al. 1993). In the<br />
interdunal valleys a higher water table is found and this leads to soil being waterlogged, at least<br />
periodically. This results in bleached, grey soil profiles (Matthews 2001) and if the soil is waterlogged<br />
permanently peatlands can develop. The high water table of interdunal depressions is due to the<br />
impermeable Pleistocene Port Dunford Beds (Figure 3; Maud 1980). Swamp Forests do only occur in<br />
these depressions. Due to interactions between vegetation and hydrology peat soils could develop<br />
here. As can be seen from the general soil situation of Maputaland (see above) the peat soils are the<br />
12
only reasonably fertile soils in the area, which makes them highly favourable for agricultural purposes.<br />
This explains the high land use pressure on the Swamp Forests.<br />
Climate<br />
Maputaland lies within a transitional zone between the tropics to the north and sub-tropical coastal<br />
conditions to the south (Matthews 2001). In general the climate can be described as warm to hot in<br />
summer (mean daily January maximum is 28°C) and mild to warm in the winter (22°C) as well as<br />
humid and subtropical (Meadows 1985). The Algulhas current exerts a significant warming influence.<br />
The mean annual temperature exceeds 21°C. Although the annual precipitation is high compared to<br />
other South African areas, the climate diagram for Kosi Bay illustrates, that soil moisture deficit is a<br />
problem during the winter months (Figure 4). This soil moisture deficit is increased by the sandy soils<br />
that dominate in the Kosi Bay area (see paragraph “soil” above). Only the peat soils are moist all year<br />
round, which additionally increases the land use pressure on the peatlands.<br />
Figure 4. Average temperature and rainfall for Kosi Bay (Figure according to Larcher 1983 in Lubbe<br />
1997)<br />
The mean annual precipitation values vary from over 1000 mm at the coast to less than 600 mm short<br />
distance inland, creating a sharp rainfall gradient between the coast and further inland and causing a<br />
dry subtropical climate at the coast (Figure 5). 60% of the rain is falling in the summer months<br />
between October and April, which means that there is a pronounced dry season in winter (van Wyk et<br />
al. 2001). The subtropical climate can be regarded as providing an almost all year round growing<br />
season (Meadows 1985). The southern boundary of the Maputaland Centre of Endemism seems to<br />
13
follow the 18°C mean midwinter isotherm quite closely and marks a zone where the fauna and (to a<br />
lesser extent) the flora changes from predominantly tropical to predominantly temperate (Poynton<br />
1962 in van Wyk et al 2001).<br />
Figure 5. Maputaland: mean annual rainfall (after Bruton et al. 1980)<br />
Hydrology<br />
Water table and ground water movements play an important role in relation to vegetation patterns in<br />
most parts of Maputaland, including the Kosi Bay area, as the area is covered by deep sand. The water<br />
table can be situated well below the surface as surveys indicated this further west (Matthews 2001).<br />
There is no data for the Kosi Bay area available, but plenty of permanent interdunal wetlands indicate<br />
a rather high water table in general. After rains quick fluctuations in local water levels can be<br />
experienced for a period. Kruger (1986) measured for the Sileza Nature Reserve, which shows similar<br />
soils as the Kosi Bay area, that vertical seepage rates are in the order of 0.1m/day. Water movements<br />
through the sands are at an average transmissivity of 20m²/day and co-efficient of storativity of 1*10³.<br />
Hattingh (1998 in Matthews 2001) states that permeabilities are highly variable, because the<br />
Pleistocene sediments underlying the cover sands show extreme east-west lateral variability. In<br />
general, the swamps and marshes are surface expressions of the groundwater table, with perched<br />
aquifers within the dunes draining to the interdune valley floors (Grundling et al. 1998).<br />
Kosi Lake System [KLS]<br />
The KLS is situated in the north-eastern corner of Maputaland. It is a wetland of international<br />
importance (RAMSAR Site: 1ZA011). Only the Lake System covers an area of 10 982 ha. The total<br />
14
catchment has been estimated to be 500 km² (Hughes et al. 1992). It is the best-preserved large estuary<br />
system in KwaZulu Natal. The KLS is relatively isolated, which is over 100 km north or south to any<br />
other major estuarine system. It is an estuary-linked lake system composed of four interconnected, and<br />
roughly circular lakes, which open to the Indian Ocean via a shallow estuary near the northern end<br />
(Kosi Bay mouth). The lakes are separated from the ocean by a strip of forest-covered sand dunes, 600<br />
to 2 000 m in width (Lubbe 1997). As a result of their mode of origin, the KLS presently lie on<br />
Quaternary, or re-worked Tertiary marine sands (see paragraphs on geology and soil above). The<br />
original beds of the KLS penetrate only as deeply as underlying Tertiary sediments, and do not reach<br />
the Cretaceous deposits, nor the deeper underlying Stormberg-Lebombo rhyolite bedrock (see<br />
paragraph on geology above). Based on the nature of the soils, on which they lie, the KLS is naturally<br />
infertile, but have been variously enriched by fluvial deposits (Hart in Cowan 1995). This is why the<br />
rivers that disembogue into the KLS have an inherent importance concerning the nutrient and<br />
herbicide/ biocide input into the KLS. These rivers in turn are strongly influenced and lined by Swamp<br />
Forests that grow along the river margins. PSF function as a filter for nutrients and biocides/<br />
herbicides although the latter are only used to a small extent by local subsistence farmers. That is why<br />
influences on PSF will also have influences on the KLS. Four coastal streams of which the Syhadla<br />
River and Tswamanzi River are the biggest feed the KLS. The Syhadla River, which is approximately<br />
30 km long and enters Lake Amanzimnyama in the south drains some 13 000 ha of swampy land. The<br />
Tswamanzi River, which is approximately 15 km long, enters Lake Nhlange on its western shore. The<br />
system was once the estuary of a much larger river, almost certainly the Ingwavuma (Hughes et al.<br />
1992). The Syhadla River is very low in nutrients and has got a dark colour caused by fragmented and<br />
decomposed plant material from the adjacent forests and swamps. The salinity of the lakes ranges<br />
from salinity close to seawater in the tidal basin (Kosi mouth area) to freshwater in Lake<br />
Amanzimnyama. The lake level seems to be rather stable with recordings varying between 1.0 and 1.7<br />
m. A rise in water level can be detected in or after months with a high rainfall (Lubbe 1997).<br />
Principal habitats include PSF, Phragmites beds, mangrove forest (including all 6 mangrove species of<br />
southern Africa), coastal grassland, open woodland and palm communities like the endemic Raphia<br />
palm forests. Numerous sandy mud banks, emergent at low tide, occur in the lower part of the system.<br />
2.2.2 Investigation methods<br />
Selection of investigated sites<br />
In May and September 2003 a total of 41 days was spend in the field. During this period 16 sites were<br />
visited (Figure 6). Most of them are belonging to the Kosi Bay System. Sites were identified in<br />
advance by using remote sensing data delivered by the Department of Agriculture in Pretoria and by<br />
local knowledge of the guides, Scotty Kyle (Kosi Bay Nature Reserve) and P.L. Grundling (Working<br />
for Water), whom all contributed their extensive knowledge very beneficially to the project. The<br />
Swamp Forests showed to be distributed over the whole area, mainly along permanent water courses.<br />
Visited sites are shown on Figure 6. We concentrated our work on the Kosi Bay System for the<br />
following reasons:<br />
* Logistically it showed to be not effective to visit adjacent systems such as Lake Sibaya or Pongola<br />
Floodplain in an extensive scale while using Kosi Bay Nature Reserve as a base.<br />
* The Swamp Forests at the Kosi Bay area are very extensive and offer enough sites for sampling<br />
regarding the total period planned to be spend in the field.<br />
15
* Hydrologically it makes sense to concentrate on one catchment area in order to minimize variations<br />
in the samples in terms of precipitation and other hydrological factors.<br />
Working with the aid of GPS (GPS 12) and detailed maps (topographical maps South Africa 1:50 000<br />
sheets) showed to be essential. In this context also the guides were an indispensable help because of<br />
their detailed local knowledge. It was often necessary to contact the farming people at the sites, in<br />
order to ask them for permit to work in their gardens and to inform them about our project as well as<br />
asking them about their gardening practices. Again our guides helped with translation and to calm<br />
people’s fears.<br />
In order to describe the ecosystem of the PSF in a comprehensive way, six transects were cut into the<br />
forest. They had a length between 80 and 200 m. Along these transects studies on vegetation, peat<br />
stratigraphy and hydrology were done in a standardized way. Peat corings and vegetation plots were<br />
carried out in regular intervals. Perforated plastic pipes were put into the ground every 10 to 20 m<br />
along the transects (see detailed description below). Also the nivellement was taken with the aid of a<br />
theodolite.<br />
16
Figure 6. Map of the visited sites; basic maps taken from topographical map 2632 Mkuze 1:250 000<br />
sheet and Rice Project map 1:100 000. The dark patches are indicating shallow flat-floored water<br />
courses and depressions with permanently wet conditions. For details concerning the sites see Table<br />
6 in the appendix of this section.<br />
17
Peat stratigraphy, hydrology and nivellement (transects)<br />
Peat coring has been done with the aid of a Russian Peat Sampler (Table 11 in the annex of this<br />
section) along all six transects. This device allows the collection of samples from top to the bottom of<br />
the peat bed. The accuracy with which a sample can be pinpointed in the profile is of the order of a<br />
decimetre. Each core increment was inspected in the field and sub-sampled. Samples were described<br />
in the field according to colour, moisture content (qualitative), fibre length and compared with the tenpoint<br />
von Post humification scale (see Table 5 in the appendix). The Figures of the cross sections in<br />
section 2.3.1 are showing the results.<br />
Hydrological measurements have been made at all six transects. Perforated plastic pipes where put at<br />
regular intervals into the ground and after 24 hours measuring values where taken from the water in<br />
the pipes. These included water depth, pH, conductivity and temperature. The values were taken with<br />
the aid of a conducting meter, a pH meter and a folding rule. The results of the hydrological studies are<br />
also shown in the section 2.3.1 and in Table 4 in the annex.<br />
The nivellement was taken with the aid of a theodolite, a levelling board and a 50 m-measuring tape.<br />
Nivellement results are shown in the peat profile graphs in the section 2.3.1 and in Table 3 in the<br />
appendix.<br />
Vegetation survey<br />
Peat Swamp Forest sites were sampled in 10x10 m plots in areas with relatively homogenous<br />
vegetation. Inside each plot all the represented plant species were recorded and assigned the<br />
appropriate Braun-Blanquet cover-abundance value (Werger 1974). During the first field campaign<br />
(May 2003) plots were randomly placed in different Swamp Forest habitats while in the second field<br />
campaign (September 2003) they were placed at regular intervals on transect lines bisecting a specific<br />
Swamp Forests. The first was done to obtain a general impression of the area and identify potentially<br />
valuable sites for further investigation, which formed part of the September excursion that included<br />
more detail habitat data measurements, such as pH, electro-conductivity of peat water, and water<br />
depth.<br />
The vegetation was surveyed on a total of 65 plots. At each site date, site name and abbreviation,<br />
location/ coordinates and categories of biotic effects were noted on plot sheets. Plot characteristics<br />
such as fire disturbance, hydrology, pH, conductivity, presence of drain ditches, peat depth (in some<br />
cases peat profiles) and cover of trees, shrubs, herbs and litter were noted. Subsequently the species<br />
and their cover regarding the different layers were also recorded. The vegetation in each plot was<br />
separately assessed in four different layers: tree (T), shrub (S), herb (H), and liana (L) layer. The<br />
height of each layers, when present, was decided based upon the physiognomy of each plot. If the<br />
same species occurred in every layer it would be recorded in each of the layers. Data on the habitat<br />
were also noted and included a subjective categorical classification of the hydrology of the peat soil<br />
surface, as either: flooded, wet, moist, or dry. The presence of drain ditches associated with gardening<br />
activity presence was noted, and peat depth as determined with a standard clay auger.<br />
Different PSF sites were in different land use stages and each one was consequently classified as<br />
belonging to one of the following:<br />
?? Pristine PSF<br />
?? Recently disturbed PSF<br />
18
?? Long-time recovering PSF<br />
?? Active gardening in PSF<br />
Most of the time the specific category was apparent, but in some cases, especially the old disturbed<br />
recovering PSF, information was gathered from local people that have been farming in the area for<br />
some time or from aerial photographs. It was however essential that each recorded site had to be a PSF<br />
sometime in the past irrespective of how it looked at the time of investigation. An additional<br />
requirement for each sampled site was that it still had to contain a distinguishable peat layer,<br />
irrespective of its depth, to ensure that it was still a PSF or at least had the potential to become one<br />
again in the future. Additional general notes on the nature of any visual disturbances were also<br />
recorded and included remarks on cutting and clearing, fire, and active gardening. More than one type<br />
of disturbance category (see above) was possible in a single site.<br />
Knowing the species was a key factor. We compiled a herbarium of the “difficult” species. Fortunately<br />
we were allowed to make use of the excelle nt field herbarium at near by Tembe Elephant Park. We are<br />
also very appreciated to Wayne Mathews with his extensive knowledge about the species of the region<br />
who helped us a full day with our herbarium species. For the confirmation of the determination of the<br />
species we made use of the huge specimens collection at the National Botanical Institute in Pretoria<br />
(NBI).<br />
Ornithological survey<br />
Ornithological studies were done parallel to the vegetation studies. Data was gained from plots that<br />
were at the same sites as the vegetation studies. This is to compare ornithological with vegetation data.<br />
A plot had to be homogenous in structure as birds of other habitat types should not be included. Four<br />
structure types were used:<br />
?? Pristine PSF<br />
?? Long-time recovering PSF<br />
?? Disturbed PSF along the margin, central part natural<br />
?? PSF totally transformed to gardens<br />
In the plots point counts were used. 22 plot samples were taken. Individuals were counted within a<br />
radius of 70 m and within a time interval of 15 minutes. The time chosen compromised between the<br />
need to ensure all the birds within the plot were recorded and to avoid re-recording the same individual<br />
(Bibby et al. 1992). At least five minutes recovery time was allowed before recording. Samples were<br />
only taken in the time between sunrise and 11:00 hr. The weather had to be more or less sunny and not<br />
too overcast or windy as bird activity drops down under such conditions. Because it was difficult to<br />
see birds on the point counts, particularly in dense vegetation, I relied on calls for many records. Bird<br />
calls and songs were already known from previous experience, learned from tapes (Gibbon 1995) or<br />
learned in situ. For the observations a pair of Leica 10x42 BA binoculars were used. Studies were<br />
done in May and September, which is the southern hemisphere winter. This resulted in low song<br />
activities and few western Palaearctic or intra-African migrants being present.<br />
19
Statistical analysing methods<br />
The data produced were manipulated to create two types of detrended correspondence analysis<br />
(DECORANA/ DCA) ordinations (Hill and Gauch 1980) by applying PcOrd computer software (Ver.<br />
4.27). The first DCA ordination included all the vegetation data and environmental data of all the<br />
reléves that had species that occurred twice and more in the entire survey and possessed a total cover<br />
abundance value of 0.5% and greater in all the reléves. All cultivated crops were excluded from the<br />
ordination, because they were planted and cared for by man and would therefore not result in an<br />
objective interpretation of the vegetation ecology of PSF. The second DCA ordination included all the<br />
vegetation and environmental data of all the pristine and long-time recovering plots to generate an<br />
interpretation of pristine PSF and long-time recovering PSF, in order to observe any difference<br />
between the two and determine the main environmental factors that shape and maintain their<br />
ecological functioning. The environmental data used in both ordinations excluded the more detailed<br />
environmental data on pH, water depth, conductivity and peat stratification, because not all the<br />
included reléves had data of this quality available.<br />
By applying Cluster Analysis, performed in PcOrd with the Relative Euclidean as distance measure<br />
and Ward’s Method as group linkage, resulted in two sets of reléve divisions at group membership<br />
levels of 9 and 5 respectively for the same vegetation data sets used in the first and second DCA<br />
ordination. The results of this classification procedure of both data sets were combined with an<br />
Indicator Species Analysis, also in PcOrd, and Braun-Blanquet classification techniques done in<br />
Microsoft’s Excel program to identify vegetation communities characterized by species that have the<br />
highest Indicator Species values and are statistically significant at a p-value of 0.05 and less. The<br />
community numbering from the Cluster Analysis is non-sequential and has been left in this way in the<br />
discussion in order to make referencing back to the classification tables and dendograms logical.<br />
For the statistical tests the U-test of Mann-Whitney was used. This test calculates an additional twosided<br />
probability.<br />
2.3 Results<br />
2.3.1 Peat swamp forest ecology: Site characteristics – hydrology, peat stratigraphy and quality,<br />
influence of human disturbance<br />
In this chapter, all six investigated transects are analysed regarding to stratigraphy, hydrology and<br />
human impacts. This is to show how these factors are related to the environmental functions of Swamp<br />
Forests.<br />
The peat profile graphics in this chapter are showing the peat quality, which is the humification degree<br />
of the peat. In order to arrange the graphics readable, the von Post humification degrees were<br />
combined to four groups, which are H2 to H3, H4 to H5, H6 to H7 and H7 to H10 (see also von Post<br />
scale in the appendix (Table 5)). Other stratigraphical categories that can be found in the graphics are<br />
sand that contains a high portion of organic material, pure sand, which is the main surface ground<br />
material in the whole Kosi Bay area (see chapter 2.2) and water with a low portion of peat, which is a<br />
result of the terrestrialization process of former open water bodies. Additional graphics are showing<br />
20
the results of the water table measurements. In these, also peat layers that contain wood remnants are<br />
indicated. But peat that does not contain wood remnants is not necessarily not Swamp Forest peat as<br />
the wood remnants might have been decomposed in layers of high humification degrees or they where<br />
not caught by the peat corer that only takes a sample of 5 cm in diameter. However if there is wood in<br />
the peat, it indicates that Swamp Forest covered the site at the time when the particular peat developed.<br />
For the location of the transects see Figure 6 and Table 6 in the appendix of this section.<br />
Cele Transect<br />
The peat body of the Cele transect is divided into two parts. The part close to the river is up to 2.10 m<br />
deep (Figure 7). This sharp depression is most likely caused by the stream. At the southern margin (in<br />
Figure 7 on the left side) of the more extensive part opposite of the river some small scale gardening<br />
activities could be found. The peat in this part is obviously influenced by the ploughing activity. It is<br />
already very decomposed (indicated with 1 in Figure 7). The local farmer stated that his family was<br />
ploughing at this plot for more than 20 years already. The peat of the central, southern part is still well<br />
preserved as can be seen by the low humification degree close to the surface (indicated with 2 in<br />
Figure 7). The vegetation in this part indicates disturbance in the past but the forest recovered<br />
eventually to a state close to natural conditions (see also chapter 2.3.2 and 2.3.3), which prevents<br />
further peat decomposition in the combination with a high ground water level (see Figure 8). The<br />
aerial photographs show that the area has been cleared before 1942 (Figure 9). The local farmer told us<br />
that they did not manage to plough the whole area after clearing it, as they were not able to drain the<br />
area adequately at that time. This also explains the low humification degree of the central southern part<br />
(indicated with 2 in Figure 7) despite the clearing. The central part of the transect shows a low, quiet<br />
decomposed peat layer (indicated with 3 in Figure 7). The peat close to the river (indicated with 4 in<br />
Figure 7) is obviously influenced by the river, as highly decomposed layers (H8 to H10) alternate with<br />
less decomposed layers (H4 to H5). Wood remnants could be found throughout the profile (see Figure<br />
8), which indicates that this site has been Swamp Forest for a long time already.<br />
21
Figure 7. Stratigraphy Cele transect<br />
22
Figure 8. Hydrology and location of identifiable wood remnants in peat layers in Cele transect<br />
23
1942 1959 2002<br />
Figure 9. Aerial photographs Cele; The location of the transect is indicated by a black line<br />
3<br />
24
Matitimani Transect<br />
The Matitimani peat profile is characterized by up to three metre deep, generally little decomposed<br />
peat (H1 to H3). In the centre of the transect a water body containing loose peat can be found close to<br />
the surface (Figure 10). It can be construed as a result of the terrestrialization processes. Identifiable<br />
wood remnants could only be found in the western part of the profile (Figure 11 right side). The site is<br />
generally wet and the ground water level exceeds in many parts the surface level (Figure 11).<br />
Hydrologically the site is determined by flowing groundwater, which is entering the site from the<br />
upper part of the valley. This explains, why the peat at the transect site is in general so little<br />
decomposed although the site has been cleared at least twice in the past. This can be seen from the<br />
series of aerial photographs in Figure 12. Also the vegetation indicates disturbance which can be seen<br />
especially in the very wet central part of the transect. Here the trees could not build up a closed canopy<br />
after more than 10 years. The vegetation here belongs to the typical vegetation type that can be found<br />
at wet, long-time recovering sites (see sections 2.3.1 and 2.3.2). The aerial photographs of Figure 12<br />
are also reflecting the establishment of the Nature Reserve in 1987: While the transect area has been<br />
cleared by 1991, the Swamp Forest could recover to a state close to natural conditions until 2002 as<br />
this part became a part of the Nature Reserve. At the same time between 1991 and 2002 the part<br />
outside the reserve (northern part of the valley) has been cleared until 2002. But even today these parts<br />
are very wet as there is a stream that is flowing through the peat body (pers obs. September 2003).<br />
Thus the site is hydrologically independent from the on-site conditions, which is also reflected by the<br />
name of the valley (Matitimani = cold water).<br />
Figure 10: Stratigraphy Matitimani Transect<br />
25
Figure 11. Hydrology and location of identifiable wood remnants in peat layers in Matitimani transect<br />
Photo 1. Most of the Swamp Forest in the Matitimani valley has been cleared during the last 10 years<br />
26
1942 1959 1991 2002<br />
Figure 12. Aerial photographs Matitimani; The location of the transect is indicated by a black line<br />
27
Nkanini Transect<br />
The Nkanini profile has got the deepest peats of all investigated transects (nearly 4 m in the centre).<br />
Concerning the peat quality, rather decomposed peats dominate it. Furthermore the inhomogeneous<br />
layering does indicate changing hydrological conditions during the peat building process (Figure 14).<br />
Although the surface level shows a difference in elevation of nearly 3 m, the surface is wet all along<br />
the transect (Figure 15). Water table fluctuations showed to be low on a short time scale (two weeks);<br />
the average fluctuation being 0,02 m along the transect and 0,34 m at the margin (20 m from inside the<br />
peatland to the peatland margin). This indicates inflowing water from the bordering slopes, as this<br />
hydrological pattern can not be caused by the lower situated stream, that can be found in the northeastern<br />
(left side in Figure 14) part of the transect. Wood remnants could be found extensively in the<br />
whole transect, which is a sign for this site being an old Swamp Forest site (Figure 15). Albeit there<br />
could be found evidence of fire in the past (charcoal at a peat depth of 3 m), this Swamp Forest site<br />
has been intact until the connecting road between the town of Manguze and the border of Mozambique<br />
has been built (see Figure 13). This example points up how the establishment of roads sets Swamp<br />
Forest sites into a position where they are accessible for exploitation. Today the whole site is cleared<br />
and heavily disturbed.<br />
1942 1959<br />
1991 2002<br />
Figure 13. Aerial photographs Nkanini; The location of the transect is indicated by a black line<br />
3<br />
28
Figure 14. Stratigraphy Nkanini transect<br />
29
Figure 15. Hydrology and location of identifiable wood remnants in peat layers in Nkanini transect<br />
30
Mvelabus ha Transect<br />
This transect is characterized by a very shallow and decomposed peat (H8 to H10; Figure 16). As the site has been part of the rice project, it has been partly<br />
cleared during the 1940’s. Ploughing stopped in 1957 (local farmer pers. comm. and Figure 18). During this period and since then the peat decomposed very<br />
much and it can also be assumed, that the peat layer lost in depth. The gardening sites can still be seen along the transect and in many places the peat has been<br />
mixed up with sand from beneath or even with stony material from outside the area. This has also most likely accelerated the peat decomposition. As a result, the<br />
site is rather dry (Figure 17) with a water table lying averagely 0.2 m below the surface. This means, that much of the peat remains under aerobic conditions,<br />
which will lead to a rapid peat loss in the future. The vegetation recovered to a dry type of long-time recovering Swamp Forest (2.3.2). Characterising species<br />
include Halleria lucida and Peddiea africana. This type of Swamp Forest is rather different from pristine Swamp Forests.<br />
Figure 16. Stratigraphy Mvelabusha Transect<br />
31
Figure 17. Hydrology Mvelabusha transect<br />
1942 1962 1991 2002<br />
Figure 18. Aerial photographs Mvelabusha; The location of the transect is indicated by a black line<br />
32
Syadla Transect<br />
Although this site is a gardening site, the rather deep peats (nearly 3 m) of the Syadla transect are only<br />
little decomposed (Figure 19). The reasons for this are that gardening has only taken place since less<br />
than four years (Mandle pers. comm. and aerial photographs: Figure 21) and that the local farmer is<br />
planting Colocasia esculenta, which favours wet conditions. As it can be seen from Figure 20, the<br />
water table is generally close to the surface. Only at the central part the surface is drier due drain<br />
ditches that cause a low water table (Figure 20). The peat profile shows a gliding scale from less<br />
decomposed peat (H4 to H5) close to the surface down to very decomposed peat (H8 to H9) close to<br />
the bottom of the peatland. There is no irregular layering, except close to the stream, which might be<br />
caused by the fluctuating water table of the stream that might periodically have a draining function<br />
(Figure 19). The general stratigraphical pattern indicates a long and stable peat building process. This<br />
thesis is also supported by wood remnants that could be found extensively in the whole profile, which<br />
also means that this is an old PSF site (Figure 20).<br />
Figure 19. Stratigraphy Syadla transect<br />
Figure 20. Hydrology and location of identifiable wood remnants in peat layers in Syadla transect<br />
33
1942 1959<br />
1991 2002<br />
Figure 21. Aerial photographs Syadla; The location of the transect is indicated by a black line<br />
Tswamanzi Transect<br />
The peat of this transect shows a very inhomogeneous layering. This seems to be caused by the stream<br />
that meanders through the relatively narrow valley. Sand layers are alternating with little or very<br />
decomposed peat layers (Figure 22). An interesting feature of this transect are the terrestrialized<br />
backwaters (Figure 23, photo 2). A thick floating carpet of fine Ficus trichopoda roots covers them.<br />
This species seems to play an important role for the terrestrialization process in Swamp Forests. There<br />
has been nearly no vegetation found on these carpets. If there was more light available, it would be<br />
more likely that other species like Pycreus mundii or Eriochloa meyerana would have built up floating<br />
mats.<br />
Wood remnants could be found throughout the peat of the transect, which means that this is an old<br />
Swamp Forest site (Figure 23). The series of aerial photographs (Figure xxx) is showing that this site<br />
has not been cleared at least for more than 70 years. The vegetation is distinct for pristine wet Swamp<br />
Forests. Typical species include tall Ficus trichopoda trees, Dalbergia armata and Bersama lucens<br />
(see also section 2.3.3).<br />
34
Figure 22. Stratigraphy Tswamanzi transect<br />
Figure 23. Scheme of a terrestrialized backwater at Tswamanzi transect<br />
Photo 2. Terrestrialized backwater at Tswamanzi transect (Dracaena mannii in the foreground)<br />
35
Figure 24. Hydrology and location of identifiable wood remnants in peat layers in Tswamanzi transect<br />
1942 1959<br />
1991 2002<br />
Figure 25. Aerial photographs Tswamanzi; The location of the transect is indicated by a black line<br />
2.3.2 Vegetation patterns of Peat Swamp Forest sites depending on human impact/ Regeneration<br />
pathways of Swamp Forests<br />
Pristine PSF differs clearly from impacted sites that are marked by broad changes in the vegetation.<br />
These changes are concerning mainly the forest structure and the species composition. Figures 26 and<br />
27 indicate the main features of the structural changes. Pristine Swamp Forest is characterized by<br />
significantly higher tree and not significantly higher litter cover values (63.1% (p 1.86e -6 ) and 81.3%<br />
respectively) and relatively low shrub and significantly lower herb cover values (21.5% and 59.3% (p<br />
0.015) respectively) than the disturbed PSF categories (Figure 26). The portion of shrubs (p 3.66e -4 ),<br />
36
trees (p 0.002) and especially liana (p 4.88e -4 ) is significantly higher compared to the other categories<br />
(Figure 27). Due to shady and wet conditions in the herb layer in pristine forests, the relative portion<br />
of herb species is significantly lower (p 2.38e -6 ) (Figure 27). Also nearly no weeds can be found in this<br />
forest type. Still the large-scale diversity is high (67 species found in all pristine Swamp Forest plots)<br />
although the average number of species per plot is low (19.9 species) (Table 1 group 6).<br />
The gardening sites are distinguished from all other disturbance categories by low average vegetation<br />
and litter cover values, although compared to the other categories the herb (p 4.1e -4 ) and shrub layer<br />
cover values (p 5.4e -4 ) are significantly higher due to a higher supply of light, averagely dryer<br />
conditions and less interspecific competition due to disturbance. The herb layer is extremely rich in<br />
species, which also contributes to the significantly higher total number of species in gardening sites (p<br />
3.38e -4 ; 83 species: group 3 in Table 1; Figure 27). Most of the weed species that occurred in the plots<br />
could be found in this disturbance category. Gardening sites showed also to be the most diverse sites<br />
on a small scale: the average number of species per plot is 27, which is the highest of all groups in<br />
Table 1. In contrast to that, the number of shrub species is significantly lower (p 0.009) and there are<br />
nearly no lianas (Figure 27). These only come back in long-time recovering sites where there is a<br />
reasonable tree cover again (Figure 26 and Figure 27). The herb layer becomes less diverse from<br />
gardening to pristine sites, while the portion of tree species increases along this gradient (Figure 26<br />
and Figure 27).<br />
Recently disturbed sites differ in the average number of species per plot. Wet plots have an average<br />
number of 13,6 species while drier sites have an average number of 25,3 species per plot (Table 1<br />
groups 7 and 5). This is because wet sites are characterized by more difficult conditions to grow at and<br />
species that are adapted to wet conditions like Thelypteris interrupta, Typha capensis and Ludwigia<br />
octovalvis can out compete other species and dominate much of the plots. The herb cover in the wet<br />
sites is therefore very high and it is difficult for tree species to establish on such sites. This might be<br />
the reason why very wet long-time recovering Swamp Forests still show a low open canopy layer as<br />
could be observed at Matitimani transect and at Kusifungwe site (Table 6 in the appendix).<br />
Compared to pristine Swamp Forest, the average tree layer height of long-time recovering Swamp<br />
Forest is significantly lower (p 0.001; pristine: 14,3 m (n=15; standard deviation 2,77)/ long-time<br />
recovering: 10,4 m (n=22; standard deviation 3,47)) and compared to pristine and recently disturbed<br />
Swamp Forest, long-time recovering Swamp Forest is characterized by a significantly higher cover of<br />
shrubs (p 0.009) (Figure 26), although the number of shrub species is not significantly higher (p 0.841)<br />
than in pristine Swamp Forest (Figure 26). This is because in long-time recovering sites the Swamp<br />
Forest trees are still growing, having more or less the same age (period since disturbance) and the<br />
limiting factor of the competition for light with trees in the canopy layer is not as high as in pristine<br />
sites. The species composition of Swamp Forest of this disturbance category is variable.<br />
37
100,0<br />
90,0<br />
80,0<br />
70,0<br />
60,0<br />
50,0<br />
40,0<br />
30,0<br />
tree layer<br />
shrub layer<br />
herb layer<br />
litter<br />
20,0<br />
10,0<br />
0,0<br />
pristine old recovering recently disturbed gardens<br />
Figure 26. Average cover values (%) of vegetation layers in every disturbance category<br />
100%<br />
80%<br />
60%<br />
40%<br />
20%<br />
% liana<br />
% trees<br />
% shrubs<br />
% herbs<br />
0%<br />
pristine old recovering recently<br />
disturbed<br />
gardens<br />
Figure 27. Relative composition of species assigned to structural vegetation types regarding the<br />
disturbance categories<br />
Principally there are two types of long-time recovering Swamp Forests. On the one hand there is a dry<br />
type in which the peat is decomposed probably due to gardening techniques even mixed with nonorganic<br />
soil as well as the water table is well below the surface (like at Mvelabusha transect; see also<br />
previous chapter). This forest (group 12, Table 1) is characterized by species like Peddiea africana<br />
(shrub layer), Rauvolfia caffra (tree layer), Halleria lucida (shrub layer) and Oplismenus hirtellus.<br />
Contrariwise there is the more wet type of old disturbed/ recovering Swamp Forest. It is characterized<br />
by species like Nephrolepis biserrata, Scleria angusta or Voacanga thouarsii (tree layer). These<br />
species can also be found in pristine Swamp Forests at places where there has been some natural<br />
disturbance for example due to Bush Pigs (Potamochoerus porcus), along streams or at canopy gaps.<br />
The tree species composition of old disturbed/ recovering sites does also differ from pristine sites. In<br />
old disturbed sites Voacanga thouarsii, Rauvolfia caffra, Keetia gueinzii or Halleria lucida can be<br />
38
found commonly but not so much in pristine sites. These species have a pioneer character and over the<br />
time they retreat in favour of typical pristine Swamp Forest species like Ficus trichopoda.<br />
Eventually it has to be noted that long-time recovering Swamp Forest differs clearly from pristine<br />
Swamp Forest even if the disturbance was 60 years ago (like at Mvelabusha or Cele transect).<br />
Table 1. Species number indexes for the systematic groups (see also section 2.3.3)<br />
Group Nr. 1 5 7 3 2 12 4 6 13<br />
Total number of species 51 57 66 83 66 44 17 67 69<br />
Average number of species per plot 22.0 25.3 13.6 27.0 20.2 18.3 9.3 19.9 24.3<br />
Standard deviation 5.5 6.7 4.2 5.5 4.1 4.5 2.9 5.9 7.3<br />
Number of plots 5 4 7 8 13 7 3 11 7<br />
The groups of this table can be explained as follows (see also chapter 2.3.3):<br />
- 1: wet open disturbed sites with upcoming Swamp Forest trees (with Voacanga thouarsii, Syzygium<br />
corda<strong>tum</strong> (both shrub layer), Cyperus prolifera, Cyperus pectinatus, Lygodium microphyllum (shrub<br />
layer), Panicum parvifolium and Dissotis canescens as indicator species* (p
2.3.3 PSF plant communities: Results and discussion<br />
An ordination and classification of Peat Swamp Forest containing all the species except<br />
cultivated crops, that are present two times and more in all reléves, and have an accumulated<br />
cover abundance value of greater than 0.5 % per reléve<br />
The first DCA ordination (Figures 29 and 30) was performed on the vegetation data of all the species<br />
except the cultivated crops, that are present two times and more in total in all reléves, and have an<br />
accumulated cover abundance value of greater than 0.5 % per plot. The resultant patterns reveal the<br />
gradients of similarity between the different reléves and species expressed on different axis. This<br />
gradient pattern is solely generated based upon every species’ level of abundance, expressed in<br />
percentage (Excel table 1), from each individual reléve. In this first ordination, only axis 1 meets the<br />
statistical requirements to enable the present species and reléves to be correlated reliably, having an<br />
eigenvalue of higher than the minimum 0.5 (0.55) and having a length of gradient longer than the<br />
required value of 2 (3.91).<br />
In Figures 29 and 30 the predominant environmental influences are clearly displayed as red vector<br />
lines, combined with the distribution of reléves. The environmental factors expressed should ideally<br />
have an r-value of greater than 0.5 in the positive or negative axis direction according to Pearson and<br />
Kendall’s method for ordination axes correlation. Axis 1 is strongly correlated with the tree cover (rvalue<br />
= -0.769) as a structural component to the left and recent disturbance and peat draining to the<br />
right (r-values = 0.535 and 0.456 respectively). The presence of drain ditches and evidence of recent<br />
disturbances that can include fire, clearing and cutting, are all associated with active gardening or<br />
preparation for it. A high tree cover on the other hand is indicative of more pristine or well recovered<br />
Swamp Forests as can also be observed from the relatively high pristine r-value (-0.412 for axis 1) in<br />
more or less the same direction as tree cover (figure 29). Axis 2, which is not completely statistically<br />
significant due to its eigenvalue just below 0.5, is strongly correlated with hydrology that has an r-<br />
value of 0.574 and can still be used as a useful indicator to explain the relationship among different<br />
reléves and species. The hydrology vector in the positive direction of axis 2 indicates drier conditions.<br />
In Excel table 1 the Braun-Blanquet/ Cluster Analysis resulted in a vegetation classification with nine<br />
vegetation communities and 23 species groups for all the species excluding cultivated crops, that are<br />
present two times and more, and have an accumulated cover abundance value of greater than 0.5% per<br />
reléve.<br />
The dendogram (Figure 28) performed on the same reléves of Excel table 1 resulted in the grouping of<br />
nine separate communities. The sooner a community is split off from the rest, the more dissimilar its<br />
species composition is from the others. All the communities located on the same branch of the<br />
dendogram are therefore more alike when compared with those of the other branches. The last level of<br />
separation separates the communities most alike, while the ones at the opposite end of the <strong>final</strong> linear<br />
line are the most dissimilar in terms of their species composition. The first split indicates the most<br />
apparent difference between the reléves, which is variation in the structural intactness of the<br />
communities. The left hand sided reléve group’s structure is disrupted as is evident in a poorly<br />
developed tree canopy and a well-developed herbaceous layer. It has primarily been caused by human<br />
induced disturbances, directly related to gardening practices. The right hand sided reléve group has a<br />
40
etter-developed structure with an intact tree canopy cover, as is to be expected in more pristine<br />
Swamp Forests sites. Subsequent divisions in the dendogram are bases on smaller and smaller<br />
differences until only nine groups where left that made ecologically sense. These nine groups with<br />
their characteristic species composition therefore formed the basis of the plant classification table<br />
(Excel table 1).<br />
All species except cultivated crops, that are present two times and more, and have an<br />
accumulated cover abundance value of greater than 0.5 % per reléve<br />
Comm. 1. Comm. 2.<br />
Com ben H, Cyp pro H, Cyp sph<br />
H, Lee hex H, The int H and Typ<br />
cap H<br />
Bri mic T, Fic tri T, Nep<br />
bis H, Scl ang H, Ste ten H<br />
and S, Tar par H and S and<br />
Voa tho T<br />
Comm. 2.<br />
Comm. 6.<br />
Bri mic T, Fic tri T, Ipo mau<br />
L, Sen/Mi L and Ste ten S<br />
Comm 2.<br />
Comm. 4.<br />
Rap aus T and S<br />
Comm 1.<br />
Comm 3.<br />
Hyd bon H, Old cep H,<br />
Pan bre H, Cen asi H, Rub<br />
rig H and Pyc pol H<br />
Comm. 1. Comm. 7.<br />
Typ cap H, The int H<br />
and Lud oct H<br />
Comm. 6.<br />
Comm. 13.<br />
Comm 1. Comm. 5.<br />
Voa tho S, Cyp<br />
pro H and Dis<br />
can H<br />
Cyp tex H, Fui<br />
umb H, Fic sur<br />
H, Pha imb H,<br />
Hug Cyp H, Spa<br />
lea L, and Sen<br />
Pol H<br />
Fic tri T, Ipo mau<br />
L, Dal arm, L Ber<br />
luc H and S<br />
Comm. 2. Comm. 12.<br />
Nep bis H, Voa<br />
tho T, Scl ang H<br />
Ped afr S, Ste ten H, Hal<br />
luc S, Kee gui S, Rau caf<br />
T, Opl hir H, Rhr rho H and<br />
Smi anc H<br />
Mor ser T, Bra<br />
dis H and Dra<br />
man H<br />
Figure 28. Dendogram, illustrating how the Cluster Analysis was performed and which communities<br />
and their most diagnostic species were split off from the collective whole at each level of division. It<br />
was performed for all the species (except cultivated crops) that are present two times and more, and<br />
have an accumulated cover abundance value of greater than 0.5 % per reléve. Comm. = Community.<br />
For the abbreviations see table 8 in the appendix of this section.<br />
41
Figure 29. DCA ordination graph with axis 1 and axis 2 illustrating the relationships between reléves, with their respective vegetation communities, and the most<br />
important environmental factors, for all the species (except cultivated crops), that are present two times and more, and have an accumulated cover abundance<br />
value of greater than 0.5 % per reléve. h = herb; s = scrub, t = tree, l= liana; black dots represent species<br />
42
Figure 30. A DCA ordination graph with axis 1 and axis 3 illustrating the relationships between reléves, with their respective vegetation communities, and the<br />
most important environmental factors, for all the species (except cultivated crops), that are present two times and more, and have an accumulated cover<br />
abundance value of greater than 0.5 % per reléve. h = herb; s = scrub, t = tree, l= liana; black dots represent species<br />
43
Making use of the ordination and classification results (Figures 28-30), the nine vegetation<br />
communities can be described as follow:<br />
Group 1. Voacanga thouarsii (shrub) – Cyperus prolifera (herb) community: Wet and open<br />
sites with upcoming Swamp Forest trees<br />
This community consists out of the five reléves: CE-1, KW-1, NK-1, T-CE-2, and T-NK-1 that are a<br />
combination of recently disturbed and long-time recovering Swamp Forest sites (Table 6 in the<br />
appendix of this section). The plots are situated at the opposite end of the strong tree cover correlation<br />
on axis one (Figures 29 and 30), indicating that full-grown trees are absent from the habitat and it is<br />
therefore more open. It also indicates that any recovering that has been occurring has not resulted in<br />
fully developed trees with a closed canopy so far. This is suggesting that this community is<br />
somewhere in between a recently disturbed and a long-time recovering Swamp Forest. The community<br />
is also wet (in the opposite direction of the hydrology vector), indicating marshy conditions, as is<br />
typical habitat for the sedge Cyperus prolifera, which has the second highest statistically significant<br />
indicator species value (p-value = 0.009, and IS-value = 34.8) (Excel table 1). At the same time the<br />
reléves exhibit a positive correlation with recent disturbances and the presence of drain ditches<br />
because the sites of this group are recovering from rather recently abandoned gardening practices. The<br />
community is characterized by species group AA (Excel table 1). No mature trees are present, but<br />
Voacanga thouarsii and Syzygium corda<strong>tum</strong> shrubs are very diagnostic, both having high indicator<br />
species values (44.6 and 35.1 respectively) that are statistically significant as well (p-values = 0.001<br />
and 0.01 respectively) (Excel table 1). These tree species are either still in a process of growing<br />
towards maturity or are limited in their growth by the wet conditions to which they may not be that<br />
well adapted. Syzygium corda<strong>tum</strong> is indeed known to grow on peripheral water logged mineral soils,<br />
although it can also develop on stagnant mire surfaces and is therefore definitely tolerant of deep peat<br />
(Thompson and Hamilton 1983). All other significant diagnostic species are located in the herbaceous<br />
layer and include the fern Lygodium microphyllum, the herb Dissotis canescens, the sedge Cyperus<br />
pectinatus, and the grass Panicum parvifolium. The community has 50 species in total, with an<br />
average of 22 species per reléve (Table 1).<br />
Group 5. Cyperus textiles (herb) – Fuirena umbellata (herb) community: Recently disturbed<br />
sites dominated by Cyperus textilis<br />
This community consists of four reléves: FOS-2, NK-4, MAL-1, and MAL-2 that form a combination<br />
of pristine, long-time recovering, gardening and recently disturbed Swamp Forests sites (Table 6 in the<br />
appendix of this section). As can be expected from such a group of diverse reléves, they are distributed<br />
over quite a wide gradient in the ordination (Figures 29 and 30). All the reléves are scattered in a belt<br />
shape towards the right of axis 1, indicating a weakly developed tree canopy differing in its scale. The<br />
best developed tree canopy belonging to the pristine and long-time recovering reléves and the poorest<br />
to the gardening reléve, where trees have been cleared for gardening, explaining the strong association<br />
with recent disturbances and draining ditches (Figures 29 and 30). The reléves and species also exhibit<br />
a preference for wetter conditions (Figures 29 and 30), with the recently disturbed and long-time<br />
recovering plots being the driest and the gardening plots the wettest, although the change is not as<br />
huge as in the wide gradient revealed in tree canopy structure differences. The wet conditions can also<br />
be concluded from the occurrence of many species that favour wet conditions, such as sedges and the<br />
presence of the hydrophilic sedge Typha capensis and fern Thelypteris interrupta in species group AC<br />
44
(Excel table 1). The community is however characterized by species group AB (Excel table 1) The<br />
reason for these diverse reléves being grouped together can only be explained by their shared species<br />
composition and it is especially the sedge Cyperus textiles that is strongly present in the reléves. It also<br />
has the highest significant indicator species value (76.6) in the community (Excel table 1). This<br />
species as well as the other two sedges Fuirena umbellate and the unknown “Huge Cyperaceae”<br />
species, occupy the same position in the ordination as the reléves in which they occur (Figures 29 and<br />
30) and have statistically significant high indicator species values for the community (Excel table 1).<br />
Other important species that occur in this community and favoured by the same environmental factors<br />
are: both shrub and tree growth forms of Ficus sur, and two Asteraceae weeds Senecio<br />
polyanthemoides and Crassocephalum picridiformis that are typical for recently disturbed and<br />
gardening Swamp Forest sites (Excel table 1). The pristine site is only included because of the high<br />
cover of Cyperus textilis. The disturbance due to the river in the pristine site is in contrast to the other<br />
reléves of this group of natural origin. The community has a total of 57 species and an average of 25<br />
species per reléve (Table 1).<br />
Group 7. Typha capensis (herb) – Thelypteris interrupta (herb) community: Very wet,<br />
recently disturbed sites<br />
This community consists of seven reléves: KM-1, KM-2, MA-2, T-NK-5, T-MAT-3, NK-2, and T-<br />
NK-3. They are all recently disturbed Swamp Forest sites, with the exception of T-MAT-3, which is a<br />
long-time recovering site (Table 6 in the appendix). All the reléves are more or less clumped together,<br />
illustrating common factors that have determined their species composition (Figures 29 and 30). The<br />
largest gradient is in the negative direction of axis 2 that pertains to very wet conditions in the plots,<br />
being so far situated at the bottom end the axis 2 (Figure 29). The other main orientation of the reléves<br />
is towards the far right of axis 1 (Figures 29 and 30). Axis 1 relates to level structural intactness of the<br />
tree canopy being either well developed or disturbed by natural environmental factors and/ or human<br />
induced disturbances associated with gardening or preparation for gardening. The plots of this group<br />
have been severely affected by disturbances. The structural absence of trees is in some extend due to<br />
the limited time since cutting and clearing, but more importantly long periods of the water logged<br />
conditions have limited tree development completely or restricted it to the presence of only a few<br />
Ficus trichopoda, Voacanga thouarsii and Bridelia micrantha individuals in the herb and shrub layer.<br />
The community is characterized by species group AC and includes aquatic macrophytes, such as<br />
Typha capensis, Thelypteris interrupta, and Ludwigia octovalvis that have the highest significant<br />
indicator species values as well (Excel table 1 in the appendix). Other diagnostic species are<br />
Melanthera scandens, Cyperus dives, and Persicaria hydropiper. These species occupy the same<br />
positions in the ordination as the mentioned reléves (Figures 29 and 30). The community has a total of<br />
35 species with an average of 13 species per reléve (Table 1), which is very low. On the other hand the<br />
vegetation cover in this community is very high which makes it difficult for trees to establish.<br />
Group 3. Hydrocotyle bonariensis (herb) – Rubus rigidus (herb) community: Gardening sites<br />
with permanent or at least recent disturbance and very little or no canopy layer<br />
This community consists of eight reléves: CE-3, MANG-1, NK-3, T-CE-1, RA-3, T-SYAD-2-3, SF1-<br />
1, and SY-1 (Table 6 in the appendix) that are combinations of active gardening and recent disturbed<br />
sites that have been abandoned after gardening practices. In spite of the fairly similar types of land<br />
uses in the plots, they have quite wide distribution gradients in the ordination, especially along axis 1<br />
45
(Figures 29 and 30), but also with reference to axis 2 (Figure 29). This is because the reléves have a<br />
rather inhomogeneous character. All the reléves are grouped towards the positive side of axis 1, but<br />
with some having a few trees present while others are totally absent of any trees and even shrubs,<br />
resulting in a wide structural gradient. They do however all share influences of recent disturbances and<br />
drain ditches (Figures 29 and 30). With respect to hydrology the plots also show a varied response.<br />
RA-3 is an open disturbance site inside a Raphia australis Swamp Forest that is characteristically dry,<br />
while the other plots are also relatively dry due to draining that has taken place to enable crop<br />
cultivation (Figure 29). Reléve NK-3 is at the opposite end of the spectrum has the wettest condition in<br />
the community (Figure 29). The community is characterized by species group AD and has the highest<br />
biodiversity of all the communities (Excel table 1). The reason being that many species are pioneers<br />
that include several weeds that thrive in the continuous gaps created by gardening and associated<br />
disturbances that include frequent clearing by means of burning and cutting. Herbs of the following<br />
species characterize the community: Hydrocotyle bonariensis, Rubus rigidus, Panicum brevifolium,<br />
Pteridium aquelinum, Oldenlandia cephalotes, and Centella asiatica. These species have the highest<br />
indicator species values and statistically significant p-values (Excel table 1). Most of the weeds are<br />
members of the Asteraceae family. Some typical species are: Bidens pilosa, Sonchus oleraceus,<br />
Helichrysum aureonitens, and Agera<strong>tum</strong> houstonianum. These species also clearly occupy the same<br />
distribution patterns in the ordination as the reléves belonging to the community. The community has a<br />
total of 78 species and an average of 29 species per reléve (Table 1), which is very high compared to<br />
the other groups.<br />
Group 2. Nephrolepis biserrata (herb) – Voacanga thouarsii (tree) community: Long-time<br />
recovering Swamp Forest<br />
The community is the largest of all the communities, containing 13 reléves: CE-2, SY-3, MAZ-1,<br />
KUSI-1, SF2-1, SF2-2, T-SF2-1, SY-2, KUSI-2, T-NK-2, T-CE-5, T-CE-3, and T-CE-4 (Table 6 in<br />
the appendix). They are predominantly a combination of pristine and long-time recovering Swamp<br />
Forest sites, containing two recently disturbed sits as well. In the case of the latter, the disturbance was<br />
not too intense to change the vegetation in a drastic way from those of pristine and long-time<br />
recovering Swamp Forest sites. It typically involves clearing and burning of the light fires to remove<br />
the herb layer as an initial step in gardening preparation, while the tree canopy and most of the shrub<br />
layer still remains intact. The communities described from here on are all more pristine Swamp<br />
Forests and sites that have been recovering for quite a while to closely resemble pristine Swamp<br />
Forests. This is evident from the ordination in which the reléves are all located to the left hand side<br />
(negative side) of axis 1, indicating a well-developed tree canopy (Figures 29 and 30). The<br />
communities are nevertheless spread out in a band-like fashion parallel to axis 1, depicting a relative<br />
high degree of heterogeneity in the structural composition of the community. Following the same<br />
trend as in the previous communities there is much less dissimilarity in the hydrological regime of the<br />
plots, tending to be more or less moist (Figure 29). The community can also not be considered as a<br />
genuinely pristine PSF, due to most of the reléves being orientated towards the long-time recovering<br />
environmental vector, although statistically the association is weak. The community is characterized<br />
by species group AH and can be portrayed as a relatively general Swamp Forest community, because<br />
its diagnostic species with the highest significant indicator species values have wide distributions<br />
ranges, being abundant in several other less disturbed communities (Excel table 1). These species<br />
include: the fern Nephrolepis biserrata, the very common Swamp Forest sedge Scleria angusta and<br />
46
the tree species Voacanga thouarsii and Keetia gueinzii, all typical Swamp Forest species. Other<br />
important species associated with the community are: the tree Schefflera umbellifera, the fern<br />
Lygodium microphyllum and the liana Rhoicissus rhomboidea (Excel table 1 in the appendix). Because<br />
this community has a better developed tree layer, lianas that require a well-developed tree structure for<br />
attachment also become more common. Lianas are therefore quite susceptible to disturbances that<br />
negatively impact on the tree structure, presenting them to be a potentially useful indicator of just how<br />
pristine a PSF is. The community has a total of 63 species, being the second largest in terms of<br />
biodiversity, with an average of 21 species per reléve (Table 1).<br />
Group 12. Peddiea africana (shrub) – Stenochlaena tenuifolia (herb) community: Dry type of<br />
long-time recovering Swamp Forest<br />
This community consists out of seven reléves: KW-2, SYD-3, SF1-2, T-SF2-2, T-SF2-3, T-SF2-4, and<br />
T-SF-5. These reléves are primarily all PSF sites that have been in the process of recovering from<br />
human related gardening disturbances for an extensive period already. A small minority (SYD-3 and<br />
SF1-2) has been recovering for a much shorter period of time from recent disturbances that are<br />
indicated by evidence of burning and cutting. These disturbances have not been too severe though,<br />
leaving the tree structure partly intact, resulting in a species and structural composition that closely<br />
resembles that of the long time recovering Swamp Forest sites. From the ordination it is clear that<br />
most of the reléves exhibit a strong affinity with the ‘long-term recovering’ vector (Figure 29). The<br />
differences in the structural makeup of the plots are also reflected in the distribution pattern of the<br />
reléves with regards to axis 1 (Figures 29 and 30), indicating that they have canopy development of<br />
variable state.<br />
More than 70 % of the plots of this community are located at the site Mvelabusha, in which a peat<br />
profile was constructed (see section 2.3.1), indicating a very shallow remaining peat layer following<br />
the abandonment of gardening 47 years ago. This resulted in a loss of the quantity of water that could<br />
be retained in the peat and therefore the system, making it a great deal drier. Dry conditions are also<br />
reflected by the position of the reléves in the ordination. Most of the reléves are orientated along the<br />
positive direction of axis 2 (Figure 29). The community is characterized by species group AJ (Excel<br />
table 1). It contains among others the following important significant and diagnostic species: the shrub<br />
Peddiea africana, the fern Stenochlaena tenuifolia, the tree Rauvolfia caffra and the liana Smilax<br />
anceps. The species also most typically prefer drier conditions as indicated by their similar orientation<br />
as the majority of the reléves in the ordination (Figures 29 and 30). The trees are typically shorter than<br />
in other structurally intact Swamp Forests and fewer sedges are present, most likely due to the drier<br />
conditions. The species composition of this community is differing considerably from that of pristine<br />
sites. Species that can tolerate waterlogged soils for long periods like Ficus trichopoda are much less<br />
abundant. On the other hand species having a wide ecological amplitude but that can only take moist<br />
conditions are much more abundant (e.g. Halleria lucida). It can be confidently assumed that this<br />
community will keep its separate identity from the more pristine Swamp Forest communities. The<br />
community has a total of 41 species with an average of 19 species per reléve (Table 1).<br />
Group 4. Raphia australis (tree) – Raphia australis (shrub) community: Raphia Swamp<br />
Forest<br />
This community was sampled least of all the communities and therefore contains the fewest reléves.<br />
The community is undoubtedly the most characteristic of all the PSF due to the dominant presence of<br />
47
the rare endemic palm Raphia australis. It consists of the following reléves: FOS-1, RA-2, RA-1<br />
(Excel table 1), being all pristine Swamp Forest sites. These extensive stands of Raphia australis<br />
Swamp Forest, the only ones in South Africa, are located on the western shore of lake Amanzimnyama<br />
and are protected inside the Kosi Bay Coastal Forest Reserve. The community has a virtually uniform<br />
structural canopy development, with all the reléves distributed closely together on the negative side of<br />
axis 1 (Figures 29 and 30). The community is by far the driest of all the Swamp Forest communities,<br />
being orientated high up along the positive direction of axis 2 (Figure 29). The community is<br />
characterized by species group AM (Excel table 1). The only statistically significant diagnostic species<br />
is Raphia australis in its tree and shrub category (Excel table 1). Raphia australis and other important<br />
species in the community, such as the fern Nephrolepis biserrata and the small tree Macaranga<br />
capensis (Excel table 1) all prefer drier peat conditions (Figure 29). Raphia australis palms are<br />
commonly found in homogenous plots, that all seem to have members of the species that are of the<br />
same age. The reason for this is that they are monocarpic palms that die after fruiting. Within a<br />
localized area all the fruit are distributed at the same time and germinate close to one another. They<br />
therefore commonly form stands of cohorts. Each separate Raphia australis stand is therefore at the<br />
same developmental stage, and consequently, as they die off together and fall over, they create new<br />
gaps in the existing vegetation. When these palms are half way through their life cycle and<br />
approximately ten metres high, their canopy is very dense and very little light penetrates the<br />
underlying strata. As a result there is also very little undergrowth in the shrub and herb layers. When<br />
they are fully developed they can be up to 14 metres and even higher. At this height, the canopy is<br />
much more open and therefore many more species are present in the herb and shrub layers. The<br />
community has a total of 16 species and an average of 9 species per reléve (Table 1), making it the<br />
species-poorest community of all the Swamp Forest communities.<br />
Group 6. Ficus trichopoda (tree) – Ipomoea mauritiana (liana) community: Pristine Swamp<br />
Forest<br />
This community consists of 11 reléves: FOS-3, T-SYAD-2-4, T-CE-4, MAL-3, SW-1, SW-3, SW-2,<br />
T-TSW-2, SYD-2, T-TSW-1, and T-TSW-3 (Table 6 in the appendix). The majority of them are<br />
pristine Swamp Forest sites and those that are not are long-time recovering Swamp Forest sites that<br />
closely resemble pristine sites. The reléves are in totality, structurally very rich developed with little<br />
evidence of disturbances, although there is yet again quite a high level of diversity in the degree of tree<br />
canopy closure as displayed in the reléves’ ordination distribution along axis 1 (Figures 29 and 30).<br />
The community has a moist to wet hydrological regime, much wetter than any of the other Swamp<br />
Forest communities thus far (Figure 29). This community is typically located next to rivers and<br />
streams draining into the KLS and is therefore subject to occasional flooding. The community is<br />
characterized by species group AO (Excel table 1). The most distinctive species characterizing the<br />
community is the tree Ficus trichopoda, containing the highest indicator species value (38.6) in the<br />
community with a p-value of 0.001 (Excel table 1). The tree grows on the riparian zone of the rivers<br />
and streams, where it is able to thrive in this periodically flooded environment by means of specialized<br />
morphological structures, such as prop and buttress roots that anchor these trees and prevent the peat<br />
from eroding away at the same time. Other statistically significant diagnostic species within the<br />
community are the ferns Microsorium puncta<strong>tum</strong> and Polypodium lycopodioides, the lianas Ipomoea<br />
mauritiana, Dalbergia armata, Petopentia natalensis, and Asparagus falcatus (Excel table 1). The<br />
sedge Scleria angusta and the fern Stenochlaena tenuifolia, although occurring diagnostically in other<br />
48
drier communities, are also well represented in this community, indicating that they can successfully<br />
grow under different hydrological regimes (Excel table 1). While another common Swamp Forest<br />
herb, the fern Nephrolepis biserrata, is virtually absent from the community, possibly because it<br />
cannot tolerate wetter conditions with periodic flooding, as is evident from its preference of drier<br />
conditions in the ordination (Figure 29). There are a total of seven species classified as belonging to<br />
the liana layer within species group AO, the highest of any Swamp Forest community (Excel table 1).<br />
This indicates a well-developed tree structure having experienced little disturbances. The absence of<br />
weed species, that are so typical of community 3 (gardening sites), is also a good indicator for pristine<br />
conditions as is the distribution of the community’s reléves along the pristine environmental vector in<br />
the ordination (Figure 29). There is a total of 66 species; making it one of the most biodiversity rich,<br />
structurally intact Swamp Forest communities. The community contains an average of 21 species per<br />
reléve (Table 1).<br />
Group 13. Morella serrata (tree) – Brachylaena discolor (herb) community: Indifferent<br />
group; open Swamp Forest structurally determined<br />
This community consists of the following seven reléves: MA-1, SYD-1, T-MAT-1, T-MAT-2, T-<br />
MAT-4, T-SYAD-2-1, and T-SYAD-2-2. The plots of this community consist out of two totally<br />
opposite types of disturbance categories: gardening and pristine Swamp Forest sites. The reason why<br />
these two completely different types of Swamp Forest plots can be grouped together in the same<br />
community is because both share the same level of structural richness, caused by the presence of a<br />
well-developed tree layer in both cases (Figures 29 and 30). The gardening that is conducted at plots<br />
SYD-1, T-SYAD-2-1, and T-SYAD-2-2, occur underneath a high tree layer that has only been<br />
partially removed to provide space for cultivation. The fact that these three gardening reléves are<br />
orientated a bit more to the disturbed side of axis 1 is due to the presence of drain ditches, necessary<br />
for keeping the peat soils dry for crop cultivation (Figure 29). These drier conditions of the gardening<br />
reléves are also clearly distinguished in their orientation towards the dry direction of the hydrology<br />
environmental vector (Figure 29). The more pristine reléves on the other hand are again much wetter<br />
(Figure 29). The community is characterized by species group AR (Excel table 1). The species<br />
composition of the community almost seems to be separated into two parts: Those occurring in the<br />
gardening section and those occurring in the pristine section. This is totally logical, because the<br />
different environmental influences are favouring different species to dominate. Even with respect to<br />
the tree layer, which is well developed in both categories, the species composition differs. In the<br />
pristine reléves (MA-1, T-MAT-1, T-MAT-2, and T-MAT-4) the tree species Morella serrata has the<br />
highest significant indicator value, but it is totally absent from the three gardening reléves (Excel table<br />
1). The pioneer weed species Brachylaena discolor is the diagnostic species with the highest<br />
significant indicator species value in the gardening reléves, being again absent from the pristine<br />
reléves (Excel table 1). The tree species that the community do share as a whole occur in other species<br />
groups and include most predominantly Ficus trichopoda, followed by Voacanga thouarsii and then<br />
Syzygium corda<strong>tum</strong> (Excel table 1). It is from the resultant common structure based on the coalescence<br />
of these tree species as well as the joined presence of other species, like the ferns Stenochlaena<br />
tenuifolia and Thelypteris interrupta (Excel table 1), that these diverse reléves are grouped together as<br />
a single community. The community has a total of 67 species (Table 1). This high biodiversity in only<br />
seven reléves can be contributed to the fact that three of the plots are sites that are actively disturbed<br />
by gardening. This creates conditions for various pioneer species, such as Brachylaena discolor and<br />
49
Trema orientalis and weeds like Crassocephalum crepidiodes to become established and proliferate. It<br />
is also reflected in the average number of species per reléve. In total the community has 28 species per<br />
reléve, while separately the four pristine reléves average 20 and the three gardening reléves average 38<br />
species per reléve. Finally it has to be emphasized that the structure in the plots of this group is<br />
determined by man’s activity. As the group is only determined by structure and is also the last one to<br />
be split in the dendogram (Figure 28) it is consisting of the ‘remaining’ reléves of the grouping in the<br />
ordination. Therefore this group does not describe a community that could be compared with the<br />
previous ones at the same level.<br />
An ordination and classification of pristine and long-time recovering PSF sites<br />
The second ordination (Figures 31 and 32) and classification (Excel table 2) was done on all the<br />
reléves that showed no evidence of recent disturbances, but were perceived to be pristine or have been<br />
in a process of recovering for a long period of time, up to the point where they were structurally<br />
similar to pristine Swamp Forest sites. The DCA ordination contains the vegetation data of these<br />
reléves and the same environmental variables as in the first ordination. With reference to the<br />
ordination, axis 1 has a high eigenvalue of 0.668 with an appropriate gradient length of 4.445, while<br />
axis 2’s eigenvalue is only marginally lower than the required 0.5 at 0.423 with a gradient length of<br />
3.483. Meaningful correlations can therefore be deduced along axis 1 and 2, especially axis 1, while<br />
axis 3’s eigenvalue is too far below 0.5 to have any statistically significant bearing. The prevalent<br />
environmental factors are designated as red vector lines, pointing in the direction in which their<br />
influence is asserted (Figure 31). These vector lines are correlated with the significant axes in order to<br />
determine their influence in specific directions. In the direction of axis 1 (both negative and positive)<br />
Pearson and Kendall’s r-value is higher than the recommended 0.5 for the environmental factors: tree<br />
cover (0.576) and herb cover (-0.518). Axis 2 only has drain ditches higher than 0.5 (0.539), while<br />
long-time recovering, pristine, and hydrology are just below being significant with values of 0.485, -<br />
0.485, and 0.464 respectively and can still be used as a good indication of trends in these vector<br />
directions. The most apparent observation in the second ordination is the vertically spread out<br />
distribution of the reléves and species (Figure 31), which is completely opposite to the first ordination<br />
(Figures 29 and 30). This indicates that the structural development of the different communities are<br />
much more similar than in the first ordination. The main differences are between pristine and longtime<br />
recovering Swamp Forest sites and are determined by the differences in the hydrological regimes,<br />
and the presence of drain ditches associated with abandoned gardening locations in this context<br />
(Figure 31).<br />
50
Figure 31. A DCA ordination graph with axis 1 and axis 2 illustrating the relationships between reléves, with their respective vegetation communities, and the<br />
most important environmental factors, for all the species from pristine and long-time recovering reléves. h = herb; s = scrub, t = tree, l= liana; black dots represent<br />
species<br />
51
All species from pristine and long-time recovering Swamp Forest reléves<br />
Comm. 1 Comm. 4<br />
Des ads H, Kee gue H, Tar<br />
pav S, Mor ser H and Voa<br />
tho T<br />
Fic tri T, Dal arm L Ipo<br />
mau L, Ber luc S, whi<br />
Ast H, Mic pun L and Pol<br />
lyc L<br />
Comm. 1 Comm. 2<br />
Com ben H and Sen/Mi H<br />
Comm. 2<br />
Rap aus T, Rap<br />
aus H, and Rap<br />
aus S<br />
Comm. 3<br />
Sen/Mi H, Lee hex H<br />
and Com ben H<br />
Comm. 3<br />
Sen/Mi H and<br />
Lee hex H<br />
Comm. 7<br />
Ste ten H, Ped afr S,<br />
Hal luc S, and Syz<br />
cor T<br />
Figure 32. A dendogram, illustrating how the Cluster Analysis was performed and which communities<br />
and their most diagnostic species were split off from the collective whole at each level of division,<br />
based on the species data from all the pristine and long-time recovering PSF reléves.<br />
The Braun-Blanquet/ Cluster Analysis vegetation classification performed on the vegetation data of<br />
all the pristine and long-time recovering reléves resulted in five vegetation communities with nine<br />
species groups as represented in Table xxx in the appendix. Utilizing the ordination and classification<br />
results simultaneously the five vegetation communities that can be described as follow:<br />
Group 1. Scleria angusta (herb) – Nephrolepis biserrata (herb) Swamp forest Community:<br />
Long-time recovering Swamp Forest<br />
This community is the biggest of the five Swamp Forest communities and consists of 13 reléves: CE-<br />
2, MAZ-1, RA-1, SF2-2, SY-3, T-CE-3, KUSIF-1, KUSIF-2, MAL-3, SF2-1, T-CE-5, T-SF2-1 and<br />
T-SF2-5. The community is made up of eight long-time recovering and five pristine Swamp Forest<br />
sites. Structurally wise the community is fairly homogenous. Plot T-CE-5 is the most open due to<br />
52
disturbance years before, while plot RA-1 possesses clearly a much stronger tree canopy structure<br />
(Figure 31). In the general sense the communities’ reléves are grouped around the central point of the<br />
ordination graph with a tendency to be more dispersed towards the upper middle part of the ordination<br />
(Figure 31). The community seen as a whole tends to be more dry than wet with the exceptions of a<br />
few plots, exhibiting evidence of previous gardening exploitation as can be concluded from the<br />
majority of the reléves being orientated towards the drain ditches environmental vector (Figure 31).<br />
On a wide-ranging scale the community can be viewed as long-time recovering Swamp Forest, but<br />
with several exceptions, indicating a more wide ranging PSF ecosystem that embraces numerous<br />
general tendencies as seen from the ordination (Figure 31). As a result the communities characteristic<br />
species are those that have a wide distribution in PSF extending into many communities and have a<br />
wide ecological amplitude, but reach their most abundant quantity in this particular community. This<br />
is especially true for Scleria angusta, which occurs in more reléves than any other species (Excel table<br />
2). The community is characterized by species group AA. The only two statistically significant<br />
character species in the community are the sedge Scleria angusta and the fern Nephrolepis biserrata<br />
(Excel table 2). Other diagnostic species are the trees Apodytes dimidiata, Schefflera umbellifera, and<br />
Cassonia sphaerocephala, while the tree Voacanga thouarsii is also very dominant but not diagnostic<br />
to the community (Excel table 2). The community has a total of 64 species, with an average of 21<br />
species per reléve, making it the richest community in terms of plant biodiversity (Excel table 2).<br />
Group 2. Raphia australis (tree) – Raphia australis (herb) Swamp forest Community: Raphia<br />
Swamp Forest<br />
This community only contains two reléves; FOS-1 and RA-2, both pristine Swamp Forest sites. It is<br />
very similar to the Raphia australis (tree) – Raphia australis (shrub) Swamp Forest Community<br />
described in the previous section. Both reléves possess the best-developed tree canopy of all the<br />
reléves and also show somewhat drier conditions, especially reléve RA-2 (Figure 31). The community<br />
is characterized by species group AB, with Raphia australis (tree) and Raphia australis (herb) as the<br />
only significant species with a high indicator species value in the community (Excel table 2). Raphia<br />
australis occupy the same area in the ordination as the community’s two reléves, indicating their<br />
importance to it. The community has a total of 11 species with an average of eight species per reléve.<br />
More data would be needed to describe this community properly.<br />
Group 3. Leersia hexandra (herb) – Senecio deltoideus/ Mikania natalensis (herb) Swamp<br />
Forest Community: Slightly disturbed Swamp Forest with dense herb cover<br />
The community is composed of nine reléves: FOS-3, NK-4, T-CE-4, T-CE-6, T-MAT-3, MA-1, T-<br />
MAT-1, T-MAT-2, and T-MAT-4. These plots are predominantly a combination of pristine plots;<br />
including all the plots from the Matitimani transect; with only one plot (NK-4) being a long-time<br />
recovering Swamp Forest site. In the ordination they exhibit a great deal of variation in both the<br />
structural herb/ tree canopy direction along axis 1 and in terms of hydrology (Figure 31). The general<br />
inclination of the reléves is however to be stretched out towards the bottom left from the centre of the<br />
axes, indicating generally high herb cover values. There is also a sharply expressed differentiation in<br />
the hydrology of the reléves, with a clear trend towards wet conditions, but to different extends<br />
(Figure 31). The community is characterized by species group AC (Excel table 2). The herb species<br />
complex Senecio deltoideus/ Mikania natalensis that could not be separately identified in the field and<br />
the grass Leersia hexandra were the only species with a statistically significant high indicator species<br />
value (Excel table 2). Other important diagnostic species include: the fern Thelypteris interrupta, and<br />
53
the sedges Cyperus prolifera, Typha capensis, and Cyperus textilis that indicate wet and open<br />
conditions. Important non-diagnostic tree species in the community are Voacanga thouarsii and Ficus<br />
trichopoda (Excel table 2). The community has a total of 44 species with an average of 18 species per<br />
reléve. The causes of disturbance that in turn created open structures, which allow a dense herb layer<br />
to grow are various. Bush Pigs (Potamochoerus porcus), floods or even old disturbances are some of<br />
them.<br />
Group 7. Stenochlaena tenuifolia (herb) – Peddiea africana (shrub) Swamp Forest<br />
Community: Dry type of long-time recovering Swamp Forest<br />
This community consists of five reléves: KW-1, KW-2, T-SF2-2, T-SF2-3, and T-SF2-4. These are all<br />
long-time recovering Swamp Forest sites that are orientated in a clearly defined single cluster towards<br />
the upper left hand part of the ordination (Figure 31). Again the structural heterogeneity of the<br />
community is not too great, with a more or less equally well-developed herb layer and tree canopy.<br />
The gradient does point towards a slightly denser and more complete herb layer than tree canopy,<br />
especially in reléve KW-1. The community is however much drier than any other of the other<br />
communities, especially reléve T-SF2-3, and does also indicate the presence of drain ditches (Figure<br />
31). The community is characterized by species group AE and is very similar to the Peddiea africana<br />
(shrub) – Stenochlaena tenuifolia (herb) Swamp Forest Community described in the section above<br />
(Excel table 2). The fern Stenochlaena tenuifolia and the shrubs Peddiea africana and Halleria lucida<br />
are the only significant species with high indicator species values in the entire community (Excel table<br />
2). The two shrubs are typical plant species of dry long-time recovering Swamp Forest, dominating in<br />
habitats where peat decomposition due to draining has taken place. Other important diagnostic species<br />
include: the trees Syzygium corda<strong>tum</strong> and Rauvolfia caffra, the shrub Keetia gueinzii, the grasses<br />
Panicum parvifolium and Oplismenus hirtellus, as well as the herb Smilax anceps (Excel table 2). The<br />
community has a total of 42 species with an average of 19 species per reléve.<br />
Group 4. Ficus trichopoda (tree) – Ipomoea mauritiana (liana) Swamp forest Community:<br />
Pristine and wet Swamp Forest<br />
This community is quite distinct from the rest and split of first from the other four communities in the<br />
cluster analysis, as is illustrated in the dendogram (Figure 31). It consists of nine reléves: FOS-3, SW-<br />
1, SW-2, SW-3, SYD-2, T-SY2-4, T-TSW-1, T-TSW-2, and T-TSW-3, all of which are pristine<br />
Swamp Forest sites, with the exception of SW-2, which is an old disturbed recovering site. The<br />
community is very similar to the Ficus trichopoda (tree) – Ipomoea mauritiana (liana) Swamp Forest<br />
community described from the first ordination and classification (Figure 31 as well as Excel table 2).<br />
The community is located at the opposite end of the ordination than the Stenochlaena tenuifolia (herb)<br />
– Peddiea africana (shrub) Swamp Forest community (Figure 31). From the ordination it is evident<br />
that the reléves are structurally homogenous with an equally well-developed herb layer and tree<br />
canopy. The reléves are all orientated in the pristine direction (even SW-2), and they are all wet to<br />
very wet in a clearly expressed gradient (Figure 31). This community is strongly associated with<br />
riverine habitats, situated directly on riverbanks. The only noticeable anthropogenic disturbance that<br />
does occur in this type of ecosystem is the selective harvesting of plants for medicinal purposes. But<br />
at none of the investigated sites was this practice ever perceived as taking place in an unsustainable<br />
manner. Species group AG characterizes the community (Excel table 2). The most plainly visible<br />
species, which dominates the community, is the tree Ficus trichopoda that characteristically seems to<br />
be fixed to the bodies of flowing water. This species also possesses the highest significant indicator<br />
54
species value (61.3, with p-value = 0.001) and is joined by two other species with significant indicator<br />
species values: the unknown white Asteraceae weed and the woody liana Dalbergia armata (Excel<br />
table 2). Other important diagnostic species include: Bersama lucens (tree and shrub) and the lianas<br />
Ipomoea mauritiana, Asparagus falcatus, and Petopentia natalensis. Epiphytic ferns that grow in the<br />
liana layer are Microsorium puncta<strong>tum</strong> and Polypodium lycopodioides. Scleria angusta, though not a<br />
diagnostic species to the community, is also very common (Excel table 2). As in the case of the Ficus<br />
trichopoda (tree) – Ipomoea mauritiana (liana) Swamp Forest community described in the previous<br />
section, the lianas are very dominant in this community. This indicates a low disturbance level, which<br />
is also reflected by the ‘pristine’ vector in the ordination (Figure 31). The community has a total of 59<br />
species, with an average of 19 species per reléve (Excel table 2).<br />
A dendogram, which is the graphical representation of the Cluster Analysis of the relevant reléves,<br />
illustrates how the five different vegetation communities are related to one another in terms of their<br />
shared species composition (Figure 32). It is evident from it that community 4 is distinctly different<br />
from the other communities as it is separated at the very first level of division (Figure 32). It is<br />
understandable from the classification table, which illustrates that the Ficus trichopoda (tree) –<br />
Ipomoea mauritiana (liana) Swamp Forest community’s characteristic species group AG shares few<br />
species with the other communities, while in turn the characteristic species groups of the other<br />
communities are poorly represented in community 4 (Excel table 2).<br />
2.3.4 Peat Swamp Forest Bird communities in pristine and disturbed sites<br />
68 species have been identified in all plots. Table 2 is summarizing the results. Most species (total and<br />
average) could be found in disturbed and converted sites, although at converted sites, species numbers<br />
did vary very much (standard deviation 47%). Pristine sites showed to be poor in species (38% below<br />
the average of all categories). Relative diversity is highest in recovering and converted sites.<br />
Table 2. Bird species indexes regarding the PSF categories<br />
Total number of<br />
species<br />
Average number<br />
of species per plot<br />
Pristine PSF<br />
Recovering PSF<br />
Disturbed PSF<br />
along margin,<br />
central part natural<br />
PSF totally<br />
converted<br />
18 28 31 37<br />
6.7 (n=3) 8.3 (n=9) 12.5 (n=4) 10 (n=6)<br />
Standard deviation 0.58 2.1 2.4 4.7<br />
Total species<br />
number/ average<br />
species number<br />
2.7 3.4 2.4 3.7<br />
The ordination of the bird data did not result in a characteristic pattern of various groups. The<br />
distribution of the plots in the ordination is mainly determined by the species assemblages that vary<br />
very much even within the same category. This variation of the species assemblages causes a pattern,<br />
in which the plots of all categories are scattered all over the ordination graph.<br />
Just six species were only found in pristine site plots: Palm-nut Vulture (Gyphierax angolensis),<br />
55
African Palm Swift (Cypsiurus parvus), Yellow-streaked Greenbul (Phyllastrephus flavostriatus),<br />
Narina Trogon (Apaloderma narina), Half-collared Kingfisher (Alcedo semitorquata), and Chin-spot<br />
Batis (Batis molitor). The latter is considered to be a PSF visitor from adjacent Sand Forests. Palmnut<br />
Vulture and African Palm Swift are depending on Raphia Palms (Raphia australis) for foraging<br />
(Vulture) and breeding (Swift). Yellow-streaked Bulbul and Narina Trogon are depending on pristine<br />
forests and can also be found in adjacent Sand Forests. The Half-collared Kingfisher is a bird of wood<br />
or forest fringed, clear streams and is not necessarily depending on PSF. Most of the 18 species found<br />
in pristine sites can also be found in disturbed PSF types and even in other habitats like Sand Forest.<br />
On disturbed sites they are joined by species like Waxbills and Kingfishers that prefer forest margins<br />
and open landscapes. There were no species found to indicate pristine PSF. Nevertheless there are<br />
species that occur on disturbed sites but that would disappear when all forest would be destroyed<br />
because they are depending in some way on pristine forests. These would include species like Whiteeared<br />
Barbet (Stactolaema leucotis), Narina Trogon (Apaloderma narina), Trumpeter (Ceratogymna<br />
bucinator) and Crowned Hornbill (Tockus alboterminatus). On disturbed sites they can typically be<br />
found foraging on fruiting trees like Ficus trichopoda. Nevertheless they are depending on nesting<br />
holes in old trees that they only can find in old forest structures. Thus they are considered to be<br />
threatened in areas undergoing forest clearing, such as southern Mozambique (Parker 1999).<br />
Table 9 in the appendix of this chapter gives an overview about the species found during the<br />
investigation period in PSF sites.<br />
2.3.5 Functioning of CPSF in the landscape<br />
Before the interference of man, all the sampled swamp forest sites were pristine swamp forests,<br />
growing on peat with a characteristic vegetation composition. Without the external influences of<br />
humans, which are especially effective in changing the structural organization of peat swamp forest,<br />
the existing communities’ species composition were probably depended upon the nature of their<br />
hydrological regime. As hydrology was the main non-anthropogenic factor that consistently correlated<br />
with reléve and species orientation in both the ordinations (Figures 28-32). Hydrology can be related<br />
to distance of the communities from streams and rivers. These bodies of flowing water do not only<br />
cause a directly proportional relationship between wetness and distance as the accessibility to water<br />
via rooting systems decreases with distance away from the streams and rivers. But they also act as a<br />
force in shaping the topography of the peat swamp forest environment. This result in slopes on both<br />
sides of stream and rivers that may be gradual or steep and which indirectly result in drier conditions<br />
away from the water bodies as the slopes drain more easier. Ficus trichopoda trees typically grows<br />
adjacent to the streams while other tree species such as Syzygium corda<strong>tum</strong>, Voacanga thouarsii, and<br />
Bridelia micrantha dominated in drier conditions, but also cover a wide gradient of conditions in<br />
between, especially Voacanga thouarsii and also other species such as the sedge Scleria angusta.<br />
Other typical herbaceous species such as Cyperus textilis, Stenochlaena tenuifolia, and Nephrolepis<br />
bisserrata seem to different in dominance also depending on the hydrology, with Stenochlaena<br />
tenuifolia, and especially Nephrolepis bisserrata preferring drier conditions, while Cyperus textilis are<br />
located in wetter environments.<br />
A great deal of the differences in species composition of the communities must however be<br />
contributed to the influence of man. Clearing and cutting, burning and gardening practices inside the<br />
peat swamp forest have directly led to a changed vegetation composition, in a much greater extend<br />
than any natural acting environmental factor. As mentioned earlier, tree canopy cover in particular is<br />
56
influenced by human activities that thin them out in most cases through tree loss, although sometimes<br />
some of them are purposefully left in place to generate shade for more comfortable working<br />
conditions (community 13 in Excel table 1). Especially were farming with Colocasia esculenta is<br />
undertaken, as this requires less sunlight and can grow in both waterlogged and relative dry<br />
conditions, in full sunlight or in the shade. They requiring only the clearing of the herb and shrub<br />
layer for creating space for cultivation, this includes some of the trees whose dead trunks are then<br />
used to construct fences to keep out the ever-troublesome Bush Pigs (Potamochoerus pocrus). These<br />
problematic pests have developed an affinity for crop species, especially Colocasia esculenta, much<br />
to the dismay of the local farmers.<br />
To conserve and protect pristine peat swamp forest ecosystems and their functioning, human impacts<br />
will have to be regulated, or at least wisely utilized in such a way as to minimize their effect<br />
especially on the decomposition of swamp forest peat. Vegetation species change is one thing but peat<br />
loss is quite another. The peat in swamp forest ecosystems is the essentia l element for ensuring the<br />
normal functioning of surrounding terrestrial and aquatic ecosystems to which swamp forests are<br />
mutually linked. All the water that gets collected in the KLS catchment travel at one time or the other<br />
through streams and rivers that bisect peat swamp forest ecosystems. It is here where the peat plays a<br />
crucial role in filtering particles and adsorbing certain positively charged ions from the water by<br />
means of the slight negative charge present on the long polymer organic chains of the peat. Peat also<br />
changes the water chemistry in other ways, by releasing certain organic compounds such as humic<br />
and fluvic acids into the water, which gives it a characteristic brownish-black colour. This change of<br />
colour is so prominent in lake Amanzimnyama whose name literally means black water. The total<br />
effect of the peat is enhance, because water does not merely flow over the peat surface, but through it<br />
as well, causing the water to be in contact with a much larger surface area of peat (Clymo 1983). It is<br />
therefore not the mere presence of peat that is important but also the amount and volume, not only for<br />
changing and treating the water, but also for retaining water before it’s released. Peat act as a sponge<br />
and therefore helps in supplying water in times of scarcity, which is important both for the<br />
surrounding natural ecosystem and also for humans depending on clean drinking water and irrigation<br />
water for crops. The peat and swamp forest vegetation also acts as a buffer to help prevent the<br />
enormous amounts of surrounding silica sand from being deposited in the lake system, which would<br />
theoretically be able to eventually fill it up completely.<br />
The change in water chemistry that leave peat swamp forests, effects both fish, water birds, aquatic<br />
vegetation, and all other living organisms with which it will be in contact. It results in a nutrient poor<br />
aquatic ecosystem with very clean water that limits plant growth, having a direct influence on the rest<br />
of the aquatic ecosystem and for those terrestrial organisms that depend on them. If peat swamp forest<br />
were therefore to become drastically reduced or disappear all together the effect would be far<br />
reaching, stretching way beyond the peat swamp forests ecosystems themselves. Having said this, the<br />
peat soils still provide the only real viable habitat for agricultural purposes due to its water<br />
retainability and moderate fertility. Making it the only hope for many desperate subsistence farmers.<br />
The management focus should therefore not be the total exclusion of peat swamp forest for gardening,<br />
but rather to implement wise use management practices that would ensure the long-term sustainability<br />
of this vital ecosystem. Key areas of focus should be on the education of the community, teaching<br />
them to follow certain guidelines that would benefit both them and the swamp forest. This would<br />
include advice on where, why and how to go about draining an area in order to prevent certain areas<br />
57
from laying unnecessary dry and thereby accelerating peat decomposition. Implying that uncultivated<br />
areas must be kept wet for as long and often as possible, ditches should not be too deep, nor dissect<br />
the whole cultivation are, but be limited only to areas where the saturation is of such a nature that crop<br />
species such as Musa paradisiaca can not survive. Total draining is not essential, but only for the top<br />
few centimetres of saturated peat soils. Commercial cultivation for large profits instead of subsistence<br />
farming for maintaining a more basic livelihood, must be strongly discouraged at all times. Not only<br />
will it result in a much more rapid depletion of peat, but due to commercial farming requiring a<br />
greater size, it would also prevent several other subsistence farmers from occupying a small space of<br />
land. The main focus should be orientated towards the preservation of the peat, due to the fact that it<br />
performs several essential functions and accumulates at such a slow rate that in essence it cannot be<br />
considered as a renewable resource. All the sites visited where gardening has been taking place for a<br />
long period of time, were at locations where the slopes where moderate and the peat quite wet<br />
throughout, ensuring the long-term survival of this precious resource. Precious not only to the<br />
surrounding environment, but also to the people that so heavily depend upon them.<br />
2.5 Annex Chapter 2<br />
Table 3. Nivellement transects<br />
position on<br />
transect [m]<br />
Relative height<br />
(highest point = 0)<br />
Matitimani transect<br />
0,0 -1,90<br />
16,9 -3,35<br />
23,7 -3,75<br />
33,4 -3,60<br />
51,6 -3,20<br />
64,3 -3,30<br />
71,5 -3,15<br />
83,3 -3,00<br />
96,9 -1,90<br />
109,9 0,00<br />
Nkanini transect<br />
0,0 -3,34<br />
1,0 -4,89<br />
12,6 -5,05<br />
28,4 -4,89<br />
47,1 -4,69<br />
68,2 -4,26<br />
58
88,8 -3,63<br />
112,2 -3,07<br />
133,8 -2,67<br />
156,3 -2,20<br />
176,9 -1,40<br />
188,4 0,00<br />
Syadla transect<br />
0,0 0,00<br />
4,4 -0,70<br />
9,4 -1,06<br />
12,0 -1,13<br />
25,5 -1,22<br />
42,1 -1,29<br />
59,6 -1,39<br />
79,6 -0,69<br />
94,2 -0,88<br />
97,9 river<br />
Tswamanzi transect<br />
0,0 0,00<br />
5,6 -0,93<br />
15,0 -0,94<br />
25,0 -0,74<br />
35,0 -0,67<br />
45,1 -1,26<br />
55,0 -1,11<br />
65,0 -1,02<br />
75,0 -0,93<br />
78,0 -0,41<br />
Mvelabusha transect<br />
0,0 -1,57<br />
10,0 -1,62<br />
20,0 -1,58<br />
30,0 -1,56<br />
40,0 -1,37<br />
50,0 -1,15<br />
60,0 -0,87<br />
70,0 -0,87<br />
80,0 -0,78<br />
90,0 -0,68<br />
100,0 -0,61<br />
59
110,0 -0,56<br />
120,0 -0,25<br />
130,0 -0,10<br />
140,0 0,00<br />
150,0 -0,03<br />
160,0 -0,01<br />
170,0 -0,21<br />
Cele transect<br />
0,0 -0,52<br />
10,0 -0,96<br />
20,0 -1,30<br />
30,0 -1,24<br />
40,0 -1,21<br />
50,0 -1,08<br />
60,0 -1,05<br />
70,0 -0,87<br />
80,0 -0,79<br />
90,0 -0,58<br />
100,0 -0,35<br />
110,0 -0,29<br />
120,0 -0,18<br />
130,0 -0,33<br />
140,0 -0,48<br />
150,0 -0,64<br />
160,0 -0,61<br />
170,0 -0,61<br />
180,0 -0,18<br />
190,0 0,00<br />
Table 4. Water parameter transects<br />
Nr.<br />
Position on transect<br />
[m]<br />
Relative position of<br />
water Table<br />
regarding to surface<br />
level [m]<br />
ph<br />
Conductivity<br />
[µS/cm]<br />
Temp [°C]<br />
Matitimani transect<br />
1.1 15,0 -0,54 4,90 270 19,4<br />
1.2 17,0 -0,10 5,97 180 18,9<br />
1.3 27,0 -0,03 5,40 140 18,6<br />
1.4 35,0 -0,04 6,56 180 18,7<br />
1.5 51,0 -0,10 5,66 130 18,8<br />
60
1.6 64,0 -0,07 5,73 140 18,6<br />
1.7 71,5 -0,10 6,29 150 18,6<br />
1.8 87,0 -0,01 6,52 211 18,1<br />
Nkanini transect<br />
2.1 3,3 0,00 6,32 300 20,5<br />
2.2 32,7 0,00 6,70 300 20,3<br />
2.3 54,1 0,00 6,85 390 19,9<br />
2.4 68,2 -0,18 6,65 400 19,7<br />
2.5 114,5 0,05 5,72 390 20,7<br />
2.6 165,9 -0,48 6,36 240 21,4<br />
Syadla Transect<br />
3.1 4,3 -0,21 6,58 372 19,7<br />
3.2 12,0 -0,10 6,75 422 19,7<br />
3.3 25,5 -0,06 6,60 392 19,8<br />
3.4 42,1 -0,27 6,70 385 21,1<br />
3.5 59,6 0,00 6,80 363 18,8<br />
3.6 91,6 -0,05 5,95 650 18,6<br />
river 100,0 6,92 248 18,8<br />
Tswamanzi transect<br />
4.1 5,8 -0,10 5,74 234 20,3<br />
4.2 20,0 -0,05 6,93 413 18,8<br />
4.3 37,0 -0,01 6,71 346 19,1<br />
4.4 59,0 -0,06 6,25 316 19,8<br />
4.5 68,0 -0,04 5,95 323 19,2<br />
4.6 72,0 -0,04 5,45 555<br />
4.7 78,0<br />
river 6,93 272 19,3<br />
Mvelabusha transect<br />
5.1 6,0 -0,10 6,40 305 19,2<br />
5.2 20,0 -0,11 5,98 367 18,8<br />
5.3 40,0 -0,01 5,41 339 19,7<br />
5.4 60,0 -0,24 5,77 166 19,7<br />
5.5 80,0 -0,32 6,06 108 19,3<br />
5.6 100,0 -0,14 5,57 234 19,9<br />
5.7 120,0 -0,32 5,34 240 19,6<br />
5.8 150,0 -0,62 5,80 137 19,6<br />
5.9 170,0 0,00 5,22 430 20,2<br />
Cele transect<br />
61
6.1 10,0 -0,18 5,73 162 20,8<br />
6.2 30,0 -0,06 5,85 157 19,6<br />
6.3 60,0 0,00 5,64 225 18,5<br />
6.4 90,0 0,00 5,38 219 18,3<br />
6.5 115,0 0,00 5,68 294 18,8<br />
6.6 140,0 -0,03 5,70 225 18,9<br />
6.7 160,0 0,00 6,29 351 19,0<br />
6.8 180,0 -0,19 6,48 625 18,5<br />
river 168,0 0,00 6,22 215 18,3<br />
Table 5. The ten-point von Post humification scale (after von Past and Granlund 1926)<br />
Table 6. List of investigated plots<br />
Number in Figure 6<br />
Site name<br />
Abbreviation<br />
Gardening<br />
Recently disturbed (fire/ gardening)<br />
Long-time recovering<br />
Pristine<br />
Coordinates South<br />
Coordinates East<br />
1 Cele CE-1 x 26° 52' 07" 32° 46' 03"<br />
1 Cele CE-2 x 26° 52' 14" 32° 46' 06"<br />
1 Cele CE-3 x 26° 52' 30" 32° 46' 17"<br />
2 KuMashayinyoni KM-1 x 26° 58' 26" 32° 46' 23"<br />
2 KuMashayinyoni KM-2 x 26° 58' 04" 32° 45' 54"<br />
62
3 Kusifungwe KUSIF-1 x 26° 56' 06" 32° 50' 35"<br />
3 Kusifungwe KUSIF-2 x 26° 56' 14" 32° 50' 26"<br />
4 Kwazibi KW-1 x 27° 06' 44" 32° 45' 56"<br />
4 Kwazibi KW-2 x 27° 06' 46" 32° 45' 56"<br />
5 Matitimani MA-1 x 26° 57' 38" 32° 49' 01"<br />
5 Matitimani MA-2 x 26° 57' 35" 32° 49' 03"<br />
6 Malangeni MAL-1 x 27° 04' 40" 32° 46' 56"<br />
6 Malangeni MAL-2 x 27° 04' 40" 32° 46' 57"<br />
6 Malangeni MAL-3 x 27° 04' 31" 32° 46' 59"<br />
7 Mazambane MAZ-1 x 26° 56' 46" 32° 49' 50"<br />
8 Nkanini NK-1 x 26° 56' 46" 32° 49' 50"<br />
8 Nkanini NK-2 x 26° 57' 05" 32° 46' 38"<br />
8 Nkanini NK-3 x 26° 56' 50" 32° 46' 37"<br />
8 Nkanini NK-4 x 26° 56' 47" 32° 46' 34"<br />
9 Raphia RA-1 x 27° 01' 20" 32° 48' 34"<br />
9 Raphia RA-2 x 27° 01' 26" 32° 48' 50"<br />
9 Raphia RA-3 x 27° 01' 37" 32° 49' 05"<br />
10 Mvelabusha SF-1-1 x 27° 07' 38" 32° 42' 03"<br />
10 Mvelabusha SF-1-2 x 27° 07' 36" 32° 42' 04"<br />
11 Mvelabusha SF-2-1 x 27° 07' 50" 32° 43' 05"<br />
11 Mvelabusha SF-2-2 x<br />
12 Swamanzi SW-1 x 26° 58' 08" 32° 48' 44"<br />
12 Swamanzi SW-2 x 26° 57' 59" 32° 48' 08"<br />
12 Swamanzi SW-3 x 26° 58' 09" 32° 48' 26"<br />
13 Syadla SY-1 x 27° 03' 21" 32° 48' 06"<br />
13 Syadla SY-2 x 27° 03' 21" 32° 48' 06"<br />
13 Syadla SY-3 x 27° 03' 30" 32° 48' 03"<br />
13 Syadla SYD-1 x 27° 03' 27" 32° 48' 20"<br />
13 Syadla SYD-2 x 27° 03' 27" 32° 48' 20"<br />
13 Syadla SYD-3 x 27° 03' 25" 32° 48' 23"<br />
15<br />
15<br />
15<br />
Syadla (Fish Owl<br />
Site)<br />
Syadla (Fish Owl<br />
Site)<br />
Syadla (Fish Owl<br />
Site)<br />
May 6 10 9 10<br />
FOS-1<br />
FOS-2<br />
FOS-3<br />
63<br />
x<br />
x<br />
x<br />
27° 02' 45" 32° 48' 43"<br />
16 iManguze MANG-1 x 26° 59' 29" 32° 44' 01"<br />
1 Cele Trans-CE-1 x 26° 52' 16" 32° 46' 09"<br />
1 Cele Trans-CE-2 x<br />
1 Cele Trans-CE-3 x<br />
1 Cele Trans-CE-4 x
1 Cele Trans-CE-5 x<br />
1 Cele Trans-CE-6 x 26° 52' 16" 32° 46' 09"<br />
5<br />
5<br />
5<br />
5<br />
Matitimani<br />
Matitimani<br />
Matitimani<br />
Matitimani<br />
Trans-MAT-<br />
1<br />
Trans-MAT-<br />
2<br />
Trans-MAT-<br />
3<br />
Trans-MAT-<br />
4<br />
x<br />
x<br />
x<br />
x<br />
26° 57' 39" 32° 49' 02"<br />
26° 57' 40" 32° 48' 58"<br />
8 Nkanini Trans-NK-1 x 26° 57' 05" 32° 46' 40"<br />
8 Nkanini Trans-NK-2 x<br />
8 Nkanini Trans-NK-3 x<br />
8 Nkanini Trans-NK-5 x 26° 57' 05" 32° 46' 33"<br />
10 Mvelabusha Trans-SF2-1 x 27° 07' 53" 32° 43' 06"<br />
10 Mvelabusha Trans-SF2-2 x<br />
10 Mvelabusha Trans-SF2-3 x<br />
10 Mvelabusha Trans-SF2-4 x<br />
10 Mvelabusha Trans-SF2-5 x<br />
14<br />
14<br />
14<br />
14<br />
12<br />
12<br />
12<br />
Syadla<br />
Syadla<br />
Syadla<br />
Syadla<br />
Tswamanzi<br />
Tswamanzi<br />
Tswamanzi<br />
Trans-<br />
SYAD-2-1<br />
Trans-<br />
SYAD-2-2<br />
Trans-<br />
SYAD-2-3<br />
Trans-<br />
SYAD-2-4<br />
Trans-TSW-<br />
1<br />
Trans-TSW-<br />
2<br />
Trans-TSW-<br />
3<br />
x<br />
x<br />
September 3 7 9 11<br />
Total 9 17 18 21<br />
Plot number<br />
total<br />
x<br />
65<br />
x<br />
x<br />
x<br />
x<br />
27° 03' 27" 32° 48' 18"<br />
27° 03' 29" 32° 48' 20"<br />
26° 58' 08" 32° 48' 14"<br />
64
Table 7. Complete list of plant species found at all investigated sites (143 species in total).<br />
Nomenclature followed was generally that of Ward and Weisser (1991) except for some recent name<br />
changes.<br />
Agera<strong>tum</strong> houstonianum Eriosema squarrosum Pereskia aculeata<br />
Albizia adianthifolia Erythrina lysistemon Persicaria hydropiper<br />
Allophylus cf dregeanus Erythroxylum emargina<strong>tum</strong> Persicaria spec.<br />
Allophylus melanocarpus Ficus sur Petopentia natalensis<br />
Ananas comosus Ficus trichopoda Phaulopsis imbricata<br />
Aneilema aequinoctiale Fuirena umbellata Phoenix reclinata<br />
Anthericum spec. Gomphocarpus physocarpus Phragmites australis<br />
Antidesma venosum Halleria lucida Podocarpus falcatus<br />
Apodytes dimidiata Helichrysum aureonitens Polypodium lycopodioides<br />
Arundo donax Helichrysum tongense Psilo<strong>tum</strong> nudum<br />
Asparagus falcatus Hewittia malabarica Psychotria capensis<br />
Asystasia gangetica Hibiscus surattensis Pteridium aquelinum<br />
Bersama lucens Hibiscus tiliaceus Pycreus nitidus<br />
Bidens pilosa Hibiscus trionum Pycreus polystachyos<br />
Brachylaena discolor Hydrocotyle bonariensis Rapanea melanophloeos<br />
Bridelia micrantha Ilex mitis Raphia australis<br />
Burchellia bubalina Imperata cylindrica Rauvolfia caffra<br />
Casearia gladiiformis Ingofera spec. Rhipsalis baccifera<br />
Cassonia arenicola Ipomoea batatas Rhoicissus rhomboidea<br />
Cassonia sphaerocephala Ipomoea mauritiana Rhus chirindensis<br />
Cassytha spec. Isoglossa spec. Rhus nebulosa<br />
Cavacoa aurea Keetia gueinzii Rhus pyroides<br />
Centella asiatica Kraussia floribunda Rhynchospora corymbosa<br />
Chlorophy<strong>tum</strong> krookianum Lactuca dregeana Rubus rigidus<br />
Cirsium spec. Leersia hexandra Saccharum officinale<br />
Cissampelos torulosa Lepidium spec. Sacciolepis curvata<br />
Cladium mariscus Ludwigia octovalvis Schefflera umbellifera<br />
Clematis brachiata cf Ludwigia spec. Scleria angusta<br />
Colocasia esculenta Lulube plant Scolopia stolzii<br />
Commelina benghalensis/<br />
Commelina erecta<br />
Lycopersicon esculen<strong>tum</strong><br />
65<br />
Senecio deltoideus<br />
Conyza canadensis Lygodium microphyllum Senecio polyanthemoides<br />
Crassocephalum crepidiodes Macaranga capensis Setaria megaphylla<br />
Crassocephalum picridiformis Mangifera indica Smilax anceps<br />
Crocosmia aurea Manihot esculenta Sonchus oleraceus cf<br />
Cucumis zeyheri Melanthera scandens Stenochlaena tenuifolia<br />
Cyperus alternifolius Microsorium puncta<strong>tum</strong> Syzygium corda<strong>tum</strong><br />
Cyperus dives Mikania natalensis Syzygium guineense<br />
Cyperus papyrus Mimusops obovata Tabernaemontana ventricosa
Cyperus pectinatus Morella serrata Tacazzea apiculata<br />
Cyperus prolifer Musa spp. Tarenna pavettoides<br />
Cyperus sphaerospermus Neonotonia wightii Thelypteris interrupta<br />
Dalbergia armata Nephrolepis biserrata Trema orientalis<br />
Desmodium adscendens Oldenlandia cephalotes Trichopteryx dregaena<br />
Desmodium salicifolium Oplismenus hirtellus Triumfetta pentandra<br />
Digitaria eriantha Panicum brevifolium Typha capensis<br />
Dissotis canescens Panicum parvifolium Urera trinervis cf<br />
Dracaena mannii Paspalum urvillei Voacanga thouarsii<br />
Erigeron cf daggera Peddiea africana Zehneria scabra<br />
Boldly written = endemic or near-endemic to the Maputaland Centre (according to Van Wyk 1996)<br />
Table 8. Abbreviations for plant names used in the text and tables.<br />
Species Abbreviation Species Abbreviation<br />
Agera<strong>tum</strong> houstonianum Age hou Kraussia floribunda Kra flo<br />
Albizia adianthifolia Alb adi Lactuca dregeana Lac drg<br />
Allophylus dregeanus All dre Leersia hexandra Lee hex<br />
Allophylus cf melanocarpus All mel Lepidium spec. Lep spe<br />
Ananas comosus Ana com Ludwigia octovalvis Lud oct<br />
Aneilema aequinoctiale Ane aeq Lycopersicon esculen<strong>tum</strong> Lyc esc<br />
Anthericum spec. Ant spe Lygodium microphyllum Lig mic<br />
Antidesma venosum Ant ven Macaranga capensis Mac cap<br />
Apodytes dimidiata Apo dim Mangifera indica Man ind<br />
Asparagus falcatus Asp fal Manihot esculenta Man esc<br />
Asystasia gangetica Asy gan Melanthera scandens Mel sca<br />
Bersama lucens cf Ber luc Microsorium puncta<strong>tum</strong> Mic pun<br />
Bidens pilosa Bid pil Mikania natalensis Mik nat<br />
big leafed climber/ Tacazzea<br />
apiculata<br />
big lea Mimusops obovata Mim obo<br />
Boere pumpkin Boe pum Musa spp. Mus spp<br />
Brachylaena discolor Bra dis Myrica serrata Myr ser<br />
Bridelia micrantha Bri mic Neonotonia wightii Neon wig<br />
Burchellia bubalina Bur bub Nephrolepis biserrata Nep bis<br />
Casearia gladiiformis Cas glad Oldenlandia cephalotes Old cep<br />
Cassonia arenicola Cas are Oplismenus hirtellus Opl hir<br />
Cassonia sphaerocephala Cas sph Panicum brevifolium Pan bre<br />
Cassytha spec. Cas spe Panicum parvifolium Pan par<br />
Cavacoa aurea Cav aur Paspalum urvillei Pas urv<br />
Centella asiatica Cen asi Peddiea africana Ped afr<br />
Chlorophy<strong>tum</strong> krookianum Chl kro Pereskia aculeata Per acu<br />
Cirsium spec. Cir spe Persicaria hydropiper Per hyd<br />
Cissampelos torulosa Cis tor Petopentia natalensis Pet nat<br />
Cladium mariscus Cla mar Phaulopsis imbricata Pha imb<br />
66
Clematis brachiata Cle bra Phoenix reclinata Pho rec<br />
Colocasia esculenta Col esc Phragmites australis Phr aus<br />
Commelina benghalensis/<br />
Commelina erecta<br />
Com ben/ Com ere<br />
Podocarpus falcatus<br />
Pod fal<br />
Conyza canadensis Con can Polypodium lycopodioides Pol lyc<br />
Crassocephalum crepidiodes Cra cre Psilo<strong>tum</strong> nudum Psi nud<br />
Crassocephalum picridiformis Cra pic Psychotria capensis Psy cap<br />
Crocosmia aurea Cro aur Pteridium aquilinum Pte aqu<br />
Cucumis zeyheri Cuc zey Pycreus nitidus Pyc nit<br />
Cyperus alternifolius Cyp alt Pycreus polystachyos Pyc pol<br />
Cyperus dives Cyp div Rapanea melanophloeos Rap mel<br />
Cyperus papyrus Cyp pap Raphia australis Rap aus<br />
Cyperus pectinatus Cyp pec Rauvolfia caffra Rau caf<br />
Cyperus prolifer Cyp pro Rhipsalis baccifera Rhi bac<br />
Cyperus sphaerospermus Cyp sph Rhoicissus rhomboidea Rho rho<br />
Delbergia armata Del arm Rhus cf nebulosa Rhu neb<br />
Desmodium adscendens Des ads Rhus chirindensis Rhu chi<br />
Desmodium salicifolium Des sal Rhus pyroides Rhu pyr<br />
Digitaria eriantha Dig eri Rhynchospora corymbosa Rhy cor<br />
Dissotis canescens Dis can Rubus rigidus Rub rig<br />
Dracaena mannii Dra man Saccharum officinale Sac off<br />
Erigeron cf daggera Eri dag Sacciolepis curvata Sac cur<br />
Eriosema squarrosum Eri sq Schefflera umbellifera Sch umb<br />
Erythrina lysistemon Ery ly Scleria angusta Scl ang<br />
Erythroxylum emargina<strong>tum</strong> Ery em Scolopia stolzii Sco stol<br />
Ficus sur<br />
Fic su<br />
Senecio deltoideus/ Mikania<br />
natalensis<br />
Se/Mik<br />
Ficus trichopoda Fic tr Senecio polyanthemoides Sen pol<br />
Fuirena umbellata Fui umb Setaria megaphylla Set meg<br />
Gomphocarpus physocarpus Gom phy Smilax anceps Smi anc<br />
Halleria lucida Hal luc Sonchus oleraceus cf Son ole<br />
Helichrysum aureonitens Hel aur Stenochlaena tenuifolia Ste ten<br />
Helichrysum tongense Hel ton Syzygium corda<strong>tum</strong> Syz cor<br />
Hewittia malabarica Hew mal Syzygium guineense Syz gui<br />
Hibiscus surattensis Hib sur Tabernaemontana ventricosa Tab ven<br />
Hibiscus tiliaceus Hib til Tarenna pavettoides Tar pav<br />
Hibiscus trionum Hib tri Thelypteris interrupta The int<br />
Hydrocotyle bonariensis Hyd bon Typha capensis Typ cap<br />
Ilex mitis Ile mit Trema orientalis Tre ori<br />
Ingofera spec. Ing spe Trichopteryx dregaena Tri der<br />
Ipomoea batatas Ipo bat Triumfetta pentandra Tri pen<br />
Ipomoea mauritiana Ipo mau Urera trinervis cf Ure tri<br />
67
Isoglossa spec. Iso spe Voacanga thouarsii Voa tho<br />
Keetia gueinzii Kee gue Zehneria scabra Zeh sca<br />
Kraussia floribunda<br />
Kra flo<br />
Table 9. Bird species found in PSF during the investigation periods; red data status taken from Barnes<br />
et al. (2000); the list is supplemented with data of Taylor (2004, unpubl.) whom did an ornithological<br />
survey on PSF birds in the St. Lucia wetland park in December 2003<br />
Status: A: found regularly inside PSF; B: found occasionally inside PSF; C: generally only along PSF margin<br />
Abundance: c = common; u = uncommon; l = localised; lc= locally common<br />
Species Status Abundance Red data status<br />
Green-backed Heron C u<br />
Long-tailed Cormorant C c<br />
African Darter C u<br />
Grey Heron C u<br />
Black-headed Heron C u<br />
Purple Heron C c<br />
Goliath Heron C lc<br />
Great Egret C c<br />
Little Egret C c<br />
Cattle Egret C c<br />
Squacco Heron C l<br />
Green-backed Heron C u<br />
Woolly-necked Stork B u Near-threatened<br />
Hamerkop C lc<br />
Hadeda Ibis B c<br />
Palm-nut Vulture A c<br />
African Fish Eagle B c<br />
African Crowned Eagle B l Near-threatened<br />
Long-crested Eagle C lc<br />
Southern Banded Snake Eagle C u Valnurable<br />
Ayres' Hawk Eagle B l Near-threatened<br />
Gymnogene C u<br />
Yellow-billed Kite C c<br />
Cuckoo Hawk C u<br />
Steppe Buzzard C c<br />
Lizard Buzzard C lc<br />
Black Sparrowhawk C u<br />
Shikra C u<br />
Gabar Goshawk C u<br />
Little Sparrowhawk C u<br />
African Goshawk C u<br />
Crested Guineafowl C u<br />
68
Natal Francolin C u<br />
Crested Francolin C c<br />
Coqui Francolin C c<br />
African Finfoot C u Vulnerable<br />
Red-knobbed Coot C c<br />
Common Moorhen C c<br />
African Purple Swamphen C l<br />
Black Crake C c<br />
African Jacana C c<br />
Lesser Jacana C u<br />
African Rail C l<br />
Red-chested Flufftail C c<br />
Green Sandpiper C u<br />
Water Thick-Knee C u<br />
Lemon Dove B u<br />
Red-eyed Dove A c<br />
Cape Turtle Dove B c<br />
Laughing Dove B c<br />
African Green Pigeon A lc<br />
Emerald-spotted Wood Dove B c<br />
Tambourine Dove B c<br />
Brown-headed Parrot C u<br />
Purple-crested Turaco A u; l<br />
Livingstone's Turaco A c<br />
Red-chested Cuckoo A c<br />
Klaas's Cuckoo B c<br />
Emerald Cuckoo B u<br />
Dideric Cuckoo C c<br />
Burchell's Coucal C c<br />
Green Malkoha B u<br />
Pel's Fishing Owl A u Vulnerable<br />
African Wood Owl C c<br />
Swamp Nightjar C l Vulnerable<br />
African Palm Swift B l<br />
Narina Trogon A c<br />
Speckled Mousebird C c<br />
Giant Kingfisher C c<br />
Pied Kingfisher C c<br />
Half-collared Kingfisher A lc Near-threatened<br />
Malachite Kingfisher C c<br />
African Pygmy Kingfisher C u<br />
Brown-hooded Kingfisher B c<br />
69
Striped Kingfisher C u<br />
Little Bee-Eater C u to c<br />
Blue-cheeked Bee-eater C u<br />
Broad-billed Roller C u<br />
Trumpeter Hornbill A c<br />
Crowned Hornbill A c<br />
Red-billed Wood Hoopoe A c<br />
Greater Honeyguide C u<br />
Scaly-throated Honeyguide A c<br />
Lesser Honeyguide A c<br />
Brown-backed Honeybird B u<br />
Black-collared Barbet C c<br />
White-eared Barbet A c<br />
Crested Barbet C u<br />
Yellow-rumped Tinkerbird A c<br />
Golden-tailed Woodpecker A c to u<br />
Black Saw Wing C c<br />
European Swallow C c<br />
Red-breasted Swallow C u<br />
Lesser Striped Swallow C c<br />
House Martin C u<br />
Grey-rumped Swallow C u<br />
Brown-throated Martin C u<br />
Black Cuckooshrike A c to u<br />
Fork-tailed Drongo C c<br />
Square-tailed Drongo A c<br />
Black-headed Oriole A c<br />
Southern Black Tit C c<br />
Dark-capped Bulbul A c<br />
Terrestrial Brownbulbul B c<br />
Yellow-streaked Greenbul A lc<br />
Sombre Greenbul A c<br />
Yellow-bellied Greenbul A c<br />
Eastern Nicator B c<br />
Kurrichane Thrush C u<br />
Red-capped Robin-Chat A c<br />
White-browed Robin-Chat C u<br />
Brown Scrub-Robin B c<br />
White-browed Scrub-Robin C u<br />
Willow Warbler C c<br />
Lesser Swamp Warbler C lc<br />
Little Rush Warbler B c<br />
70
Broad-tailed Warbler C u Near-threatened<br />
Dark-capped Yellow Warbler C u<br />
Green-backed Camaroptera A c<br />
Yellow-breasted Apalis B c<br />
Rudd's Apalis B c Near-threatened<br />
Neddicky C c<br />
Tawny-flanked Prinia C c<br />
Black-throated Wattle-eye A u Near-threatened<br />
Ashy Flycatcher B u<br />
Dusky Flycatcher B c<br />
Grey Tit-Flycatcher C c<br />
Blue-mantled Crested Flycatcher B lc<br />
African Paradise Flycatcher A c<br />
Cape White-eye A c<br />
African Yellow White-Eye A c<br />
Chin-spot Batis B u<br />
Woodward's Batis B c Near-threatened<br />
Southern Boubou A c<br />
Black-crowned Tchagra C c<br />
Brown-crowned Tchagra C u<br />
Grey-headed Bush Shrike B u<br />
Gorgeous Bush Shrike B lc<br />
Olive Bush Shrike C u<br />
Fiscal Shrike C c<br />
Black-backed Puffback B c<br />
Black-bellied Starling A c<br />
Eastern Olive Sunbird A c<br />
Purple-banded Sunbird A c<br />
Collared Sunbird B c to u<br />
Scarlet-chested Sunbird C u<br />
Yellow-throated Petronia C lc<br />
Thick-billed Weaver B u<br />
Dark-backed Weaver A c<br />
Southern brown-throated Weaver C lc<br />
Lesser Masked Weaver C lc<br />
Spectacled Weaver C c<br />
Southern Red Bishop C lc<br />
Fan-tailed Widowbird C c<br />
Pin-tailed Wydah C u<br />
Red-billed Firefinch C u to lc<br />
Common Waxbill C c<br />
Grey Waxbill C c<br />
71
Blue Waxbill C c<br />
Bronze Manakin C c<br />
Red-backed Manakin C c<br />
Yellow-fronted Canary C c<br />
Total number of species: 162 (35 category A species)<br />
Table 10. Occurrence of bird specie s on point counts; numbers are representing individuals<br />
CE-1<br />
CE-2<br />
CE-T<br />
KM-1<br />
KUS-1<br />
KUS-2<br />
KW<br />
MAL<br />
MAT cult<br />
MAT-T<br />
MVE<br />
NK-1<br />
NK-4<br />
NK-T<br />
RA-2<br />
SF-1<br />
SF-2<br />
SW-1<br />
SW-2<br />
SY (1/2)<br />
SYD<br />
TSW-T<br />
African Palm Swift 0 0 0 0 0 0 0 0 0 0 0 0 0 0 1 0 0 0 0 0 0 0<br />
African Green<br />
Pigeon<br />
0 0 0 0 0 0 0 0 0 0 0 0 0 2 0 0 0 0 0 0 0 0<br />
African Paradise<br />
Flycatcher<br />
1 0 0 0 0 1 0 0 0 0 0 2 0 0 1 0 0 0 1 0 2 0<br />
African Yellow<br />
White-eye<br />
2 0 0 0 0 0 0 2 0 0 0 2 0 0 0 2 0 0 0 5 0 0<br />
Ashy Flycatcher 0 0 0 0 0 0 0 0 0 0 0 0 0 0 0 0 0 0 0 3 0 0<br />
Ayre's Hawk Eagle 0 0 0 1 0 0 0 0 0 0 0 0 0 0 0 0 0 0 0 0 0 0<br />
Black-backed<br />
Puffback<br />
0 0 0 0 0 0 0 1 0 0 2 0 0 0 0 0 0 0 0 1 3 0<br />
Black<br />
Cuckooshrike<br />
0 0 0 0 0 0 0 0 0 0 0 0 0 0 0 0 0 0 0 0 1 0<br />
Black Crake 0 0 0 0 0 0 0 0 0 0 0 0 0 2 0 0 0 0 0 0 0 0<br />
Black-bellied<br />
Starling<br />
0 0 2 0 2 0 0 0 0 0 0 0 0 2 0 0 1 0 0 3 0 0<br />
Black-crowned<br />
Tchagra<br />
0 0 0 1 0 0 0 0 0 0 0 0 0 0 0 0 0 0 0 0 0 0<br />
Black-shouldered<br />
Kite<br />
0 0 0 0 0 0 0 0 2 0 0 0 0 0 0 0 0 0 0 0 0 0<br />
Blue Waxbill 0 0 0 0 0 0 0 3 0 0 0 0 0 0 0 0 0 0 0 0 0 0<br />
Brown-headed<br />
Parrot<br />
0 0 0 0 0 0 0 0 0 0 0 1 0 0 0 0 0 0 0 0 0 0<br />
Bronze Manakin 0 3 10 10 0 0 8 0 0 0 0 0 0 0 0 0 0 0 0 0 0 0<br />
Burchell's Coucal 0 0 0 0 0 0 0 0 0 0 0 0 0 3 0 0 0 0 0 0 0 0<br />
Cape White-eye 0 0 0 0 0 0 0 0 0 0 0 0 0 0 0 0 0 0 0 0 12 0<br />
Chin-spot Batis 0 0 0 0 0 0 0 0 0 0 0 0 0 0 0 0 0 2 0 0 0 0<br />
Collared Sunbird 0 1 2 0 0 0 0 0 0 0 0 0 0 0 0 0 0 0 0 0 0 0<br />
Common Waxbill 0 0 0 0 0 0 0 0 8 0 0 0 0 2 0 0 0 0 0 0 0 0<br />
Crested Barbet 0 0 0 0 0 0 0 0 0 0 0 0 0 1 0 0 0 0 0 0 0 0<br />
Crested<br />
Guineafowl<br />
0 0 0 1 0 0 0 0 0 0 0 0 0 0 0 0 0 0 0 0 0 0<br />
Crowned Hornbill 0 0 0 0 0 0 0 0 0 0 0 0 2 0 0 0 0 0 0 0 0 0<br />
72
Dark-backed<br />
Weaver<br />
0 1 0 0 0 0 0 2 0 5 2 0 0 0 0 0 0 0 0 3 4 0<br />
Dark-capped<br />
Bulbul<br />
0 6 0 4 3 0 5 2 2 0 2 0 3 3 3 15 1 0 0 3 0 0<br />
Dark-capped<br />
Yellow Warbler<br />
0 0 0 0 0 0 0 0 2 0 0 0 0 0 0 0 0 0 0 0 0 0<br />
Dusky Flycatcher 0 0 0 1 0 0 0 2 0 0 0 0 0 0 1 0 0 0 0 0 0 0<br />
Eastern Olive<br />
Sunbird<br />
4 1 2 2 5 2 1 4 0 1 2 2 2 0 0 1 2 2 1 2 1 0<br />
Emerald-spotted<br />
Wood Dove<br />
0 0 1 0 0 0 0 0 0 0 0 0 1 0 0 0 0 0 0 0 0 0<br />
Gorgeous Bush<br />
Shrike<br />
0 0 0 0 0 0 0 0 0 0 0 0 0 0 0 0 1 1 0 0 0 0<br />
Golden-rumped<br />
Tinkerbird<br />
0 0 0 0 0 1 1 2 0 1 1 0 0 0 0 0 1 0 0 0 4 1<br />
Golden-tailed<br />
Woodpecker<br />
0 0 0 0 0 0 0 0 0 0 0 0 0 1 0 0 0 0 0 0 0 1<br />
Green-backed<br />
Camaroptera<br />
0 0 2 0 0 1 2 0 0 1 0 0 0 0 0 0 1 1 0 0 2 1<br />
Grey Waxbill 0 0 0 0 0 0 2 0 0 0 0 0 0 0 0 0 0 0 0 0 0 0<br />
Half-collared<br />
Kingfisher<br />
0 0 0 0 0 0 0 0 0 0 0 0 0 0 0 0 0 0 0 0 1 1<br />
Hadeda Ibis 0 0 0 0 0 0 0 0 0 0 0 0 0 3 0 0 0 0 0 0 0 0<br />
Kurrichane Thrush 0 0 0 1 0 0 0 0 0 0 0 0 0 0 0 0 0 0 0 0 0 0<br />
Lesser Honeyguide 0 0 0 0 1 0 0 0 0 0 0 0 1 0 0 0 0 0 0 0 0 0<br />
Lesser Masked<br />
Weaver<br />
0 5 0 0 0 0 1 0 0 0 0 0 0 0 0 0 0 0 0 0 0 0<br />
Little Rush Warbler 0 0 4 0 0 0 0 0 1 1 0 1 2 2 0 2 0 0 0 0 0 0<br />
Little Egret 0 0 0 0 0 0 0 0 0 0 0 0 0 1 0 0 0 0 0 0 0 0<br />
Livingstone's<br />
Turaco<br />
0 0 0 0 0 0 0 1 0 0 0 0 0 0 0 0 0 0 0 0 0 0<br />
Long-crested Eagle 0 0 0 1 0 0 0 0 0 0 0 0 0 0 0 0 0 0 0 0 0 0<br />
Narina Trogon 0 0 0 0 0 0 0 0 0 0 1 0 0 0 0 0 0 0 0 0 0 1<br />
Palm-nut Vulture 0 0 0 0 0 0 0 0 0 0 0 0 0 0 5 0 0 0 0 0 0 0<br />
Pin-tailed Wydah 0 0 0 0 0 0 2 0 0 0 0 0 0 0 0 0 0 0 0 0 0 0<br />
Purple-backed<br />
Sunbird<br />
1 0 0 0 0 0 0 0 1 0 0 0 0 1 0 0 0 0 0 0 0 0<br />
Purple-crested<br />
Turaco<br />
0 0 0 0 0 0 0 0 0 0 0 0 1 0 0 0 0 0 0 0 0 0<br />
Red-backed<br />
Manakin<br />
0 0 0 0 0 0 12 0 0 0 0 0 0 10 0 0 0 0 0 0 0 0<br />
Red-billed Woodhoopoe<br />
2 0 0 0 0 0 0 0 0 0 0 0 0 0 0 4 0 0 0 0 0 0<br />
73
Red-capped Robin<br />
Chat<br />
0 0 0 0 1 0 0 0 0 0 0 0 0 0 0 0 0 0 1 0 0 0<br />
Red-eyed Dove 0 0 0 0 0 0 0 0 0 0 0 0 0 2 0 2 0 0 0 0 0 0<br />
Southern Black Tit 0 2 2 0 0 0 0 0 0 0 0 0 0 2 0 2 0 0 0 0 0 0<br />
Southern Brownthroated<br />
Weaver<br />
0 0 0 0 0 0 0 0 0 0 0 0 0 0 2 0 0 0 0 0 0 0<br />
Sombre Greenbul 0 0 0 0 1 1 1 1 0 0 0 0 0 0 0 0 0 2 1 0 0 0<br />
Southern Boubou 2 0 2 0 2 2 0 0 0 1 1 0 0 0 0 0 1 0 0 0 0 0<br />
Square-tailed<br />
Drongo<br />
0 0 0 0 0 1 1 2 0 1 2 1 1 0 0 1 1 2 0 2 5 2<br />
Striped Kingfisher 0 0 0 0 0 0 0 0 0 0 0 0 0 2 0 0 0 0 0 0 0 0<br />
Tawny-flanked<br />
Prinia<br />
0 0 0 0 0 0 2 0 0 0 0 0 0 2 0 0 0 0 0 0 0 0<br />
Thick-billed<br />
Weaver<br />
0 0 0 0 0 0 0 2 0 0 0 0 0 0 0 0 0 0 0 0 0 0<br />
Trumpeter Hornbill 0 0 1 0 0 0 0 0 0 0 0 0 0 1 0 0 2 0 0 2 3 0<br />
White-eared Barbet 1 0 2 0 4 0 2 8 2 1 0 4 2 4 0 1 1 0 0 0 10 0<br />
Yellow-bellied<br />
Greenbul<br />
Yellow-breasted<br />
Apalis<br />
Yellow-fronted<br />
Canary<br />
Yellow-streaked<br />
Greenbul<br />
0 0 0 0 0 0 0 2 0 0 0 0 0 0 0 0 0 1 0 0 0 0<br />
0 0 0 0 2 0 0 0 0 2 0 0 2 0 0 2 0 0 0 0 1 0<br />
0 0 0 0 0 0 2 0 0 0 0 0 0 0 0 0 0 0 0 0 0 0<br />
0 0 0 0 0 0 0 0 0 0 0 0 0 0 0 0 0 0 0 0 0 1<br />
PSF totally transformed to gardens<br />
Recovering PSF<br />
Disturbed PSF along margin, central part natural<br />
Pristine PSF<br />
74
Table 11. Plates Chapter 2<br />
Aim and goals of the field study<br />
a: project participants visiting a gardening site<br />
during the May workshop (from left to right): Dr.<br />
Donovan Kotze, Peat-Louis Grundling, Prof. George<br />
Bredenkamp, Prof Fred Ellery, Dr. Jan Sliva (front),<br />
Retief Grobler and Japhet Ngubane<br />
b: vegetation ecology field staff (left to right):<br />
Patrick Tembe, Christoph Moning, Retief Grobler,<br />
Dr. Jan Sliva and Senso Hobe<br />
c: Awareness improvement; Patrick Tembe (right)<br />
explains the project to a local chief at Cele<br />
Study area and physical environment<br />
75
d: monotypic stand of the endemic Raphia australis<br />
palm<br />
e: Maputaland is dominated by sandy, infertile soils<br />
(after a fire in a grassland the sandy soil can clearly<br />
be seen)<br />
Investigation methods<br />
f: peat coring equipment (from bottom to top):<br />
Russian peat corer, Clay corer and extension rods<br />
g: plastic pipes for hydrological investigations<br />
h: estimating the vegetation cover: tree canopy at<br />
Mvelabusha transect<br />
i: cut transect marked with danger tape at<br />
Mvelabusha transect<br />
76
j: peat coring with the Russian peat corer k: levelling board<br />
l: doing a nivellement in the swamp forest<br />
(Matitimani transect)<br />
Peat swamp forest ecology<br />
m: deep drain ditches accelerate peat decomposition;<br />
here near Manguze<br />
77
Regeneration potential of peat swamp forests<br />
n: Raphia australis seedlings on a disturbed site o: dry old recovering swamp forest at Mvelabusha<br />
p: recently disturbed swamp forest at Syadla transect q: Gardening site at Syadla transect: many of the<br />
forest trees are still remaining and support a high<br />
recovering potential<br />
r: pristine swamp forest at Tswamanzi transect s: Banana plantation at Syadla transect: one of the<br />
biggest in the area<br />
78
t: a recently disturbed site at Nkanini transect;<br />
Cyperus textilis and Typha capensis dominate the<br />
site<br />
Some important species<br />
u: Ficus trichopoda v: Ficus trichopoda typical growth form<br />
w: Tarenna parvettoides x: Stenochlaena tenuifolia<br />
79
y: Keetia gueinzii z: Nephrolepis biserrata<br />
aa: Morella serrata<br />
ab: Peddiea africana<br />
ac: Rauvolfia caffra<br />
ad: Rhoicissus rhomboidea<br />
80
ae: Rapanea melanophloeos<br />
af: Bridelia micrantha<br />
ag: Syzygium corda<strong>tum</strong> fresh leafs<br />
ah: Voacanga thouarsii (left) and Bridelia micrantha<br />
(right)<br />
ai: the Palm-nut Vulture is confined to stands of<br />
Raphia palms; both species has its distribution<br />
stronghold in southern Africa in the Kosi Bay area<br />
81
3. ORNITHOLOGICAL SURVEYS OF SWAMP FOREST IN THE<br />
GREATER ST LUCIA WETLAND PARK, AND AN ASSESSMENT OF<br />
THE TOURISM POTENTIAL OF THIS HABITAT (PT)<br />
3.1 SURVEY AREAS AND VISITS<br />
All surveys were made within the Greater St Lucia Wetland Park. The Mfabeni wetland (see Taylor &<br />
Grundling 2003) lies immediately south of Lake Bhangazi (South), beginning at approximately<br />
28°07’N, 32°31’E. It is bordered by swamp forest on its western side, and this swamp forest extends<br />
in patches south to Lake St Lucia, at about 28°13’S, 32°20’E. Surveys of the wetland and swamp<br />
forest were made from December 3 to 5 and December 14-16 2003, during a period of severe drought<br />
in the region. Additional survey visits were made to the Mfabeni wetland in November-December<br />
2002, when the area was less dry, and in July 2003.<br />
As part of a nationwide ornithological survey of wetland birds and their habitats (Taylor 1997), visits<br />
were made to wetlands in the Ozabeni section of the wetland park in December 1995 and January<br />
1996, when above-average rainfall was recorded in the region. During these wetland surveys, note<br />
were also made of birds in adjacent patches of swamp forest, particularly along the Mbazwana stream<br />
(approximately 27°34’S 32°34,E). The Ozabeni swamp forest patches were also visited briefly in July<br />
1999.<br />
3.2 RESULTS - BIRDS<br />
3.2.1 Birds associated with swamp forest<br />
The following bird species were recorded during the surveys.<br />
No. = ‘Roberts’ Number (Maclean 1993)<br />
Area: OZ = Ozabeni, MF = Mfabeni<br />
Status: PM = Palaearctic migrant (nonbreeding birds present during the austral summer); IAM = intra-African<br />
migrant, present and breeding during austral summer.<br />
No. Species Area Status<br />
074 Green-backed Heron Butorides striatus OZ Occasional at forested streams<br />
081 Hamerkop Scopus umbretta MF Resident; one active nest found<br />
094 Hadeda Ibis Bostrychia hagedash MF, OZ Widespread and common<br />
126 Yellow-billed Kite Milvus migrans MF, OZ IAM, widespread and common<br />
128 Cuckoo Hawk Aviceda cuculoides OZ Occasional at forest edge<br />
139 Long-crested Eagle Lophaetus occipitalis MF, OZ Sparse but regular<br />
141 Crowned Eagle Stephanoaetus coronatus MF, OZ Occasionally seen over forest<br />
144 Southern Banded Snake Eagle Circaetus fasciolatus MF Resident but scarce<br />
148 African Fish Eagle Haliaetus vocifer MF ,OZ Often perches in large trees<br />
149 Steppe Buzzard Buteo buteo MF, OZ PM, common in summer<br />
82
154 Lizard Buzzard Kaupifalco monogrammicus OZ 1 at forest edge, July 1999<br />
157 Little Sparrowhawk Accipiter minullus MF Occasional at forest edges<br />
161 Gabar Goshawk Micronisus gabar OZ 1 at forest edge, July 1999<br />
169 Gymnogene Polyboroides typus MF, OZ Regular, singles and pairs<br />
265 Green Sandpiper Tringa ochropus OZ PM, rare; 1 at forested river, Jan 1996<br />
298 Water Dikkop Burhinus vermiculatus MF Occasional at forest edge<br />
352 Red-eyed Dove Streptopelia semitorquata MF, OZ Common throughout<br />
356 Namaqua Dove Oena capensis MF Vagrant; 1 drank at stream, Dec 2003<br />
359 Tambourine Dove Turtur tympanistria MF, OZ Common throughout<br />
361 Green Pigeon Treron calva MF, OZ Often feeds in forest trees<br />
370 Livingstone’s Loerie Tauraco livingstonii MF, OZ Regular in small numbers<br />
371 Purple-crested Loerie Tauraco porphyreolophus MF, OZ Regular in small numbers<br />
377 Red-chested Cuckoo Cuculus solitarius MF, OZ IAM, common<br />
384 Emerald Cuckoo Chrysococcyx cupreus MF, OZ Uncommon resident/IAM<br />
385 Klaas’s Cuckoo Chrysococcyx klaas MF, OZ Common resident/IAM<br />
386 Didric Cuckoo Chrysococcyx caprius MF, OZ Common IAM (and resident?)<br />
391 Burchell’s Coucal Centropus burchelli MF, OZ A few in secondary growth<br />
394 Wood Owl Strix woodfordii OZ Jul 1999 only; probably overlooked<br />
403 Pel’s Fishing Owl Scotopelia peli OZ, (MF) 1 pair OZ; presence suspected MF<br />
424 Speckled Mousebird Colius striatus MF, OZ Often at forest edges<br />
427 Narina Trogon Apaloderma narina OZ Resident, uncommon; probably at MF<br />
430 Half-collared Kingfisher Alcedo semitorquata MF, OZ Scarce resident on rivers<br />
432 Pygmy Kingfisher Ispidina picta MF, OZ Occasional at forest edge<br />
435 Brown-hooded Kingfisher Halcyon albiventris MF, OZ Frequently seen at forest edges<br />
440 Blue-cheeked Bee-eater Merops persicus MF, OZ PM; frequent, forages over forest<br />
450 Broad-billed Roller Eurystomus glaucurus MF, OZ IAM; sparse, usually in dead trees<br />
455 Trumpeter Hornbill Bycanistes bucinator MF, OZ Common throughout<br />
460 Crowned Hornbill Tockus alboterminatus MF, OZ Common throughout<br />
464 Black-collared Barbet Lybius torquatus MF, OZ Frequent (more often in open areas)<br />
466 White-eared Barbet Stactolaema leucotis MF, OZ Common<br />
471 Golden-rumped Tinkerbarbet Pogoniulus bilineatus MF, OZ Common throughout<br />
475 Scaly-throated Honeyguide Indicator variegatus OZ Very occasional<br />
476 Lesser Honeyguide Indicator minor MF, OZ Fairly common throughout<br />
518 European Swallow Hirundo rustica MF, OZ PM; abundant over all habitats<br />
524 Red-breasted Swallow Hirundo semirufa MF IAM; small numbers feed over forest<br />
527 Lesser Striped Swallow Hirundo abyssinica MF, OZ Feeds over forest; fewer at OZ<br />
530 House Martin Delichon urbica MF, OZ PM; occasional over forest<br />
531 Grey-rumped Swallow Pseudohirundo griseopyga OZ Occasional over forest<br />
533 Brown-throated Martin Riparia paludicola MF Occasional over forest<br />
536 Black saw-wing Swallow Psalidoprocne holomelas MF, OZ Quite common at forest edges<br />
541 Fork-tailed Drongo Dicrurus adsimilis MF, OZ Occasional at forest edges<br />
542 Square-tailed Drongo Dicrurus ludwigii MF, OZ Common in all forests<br />
545 Black-headed Oriole Oriolus larvatus MF, OZ Small numbers frequently seen<br />
568 Black-eyed Bulbul Pycnonotus barbatus MF, OZ Abundant throughout<br />
572 Sombre Bulbul Andropadus importunus MF, OZ Common throughout<br />
83
574 Yellow-bellied Bulbul Chlorocichla flaviventris MF, OZ Abundant throughout<br />
600 Natal Robin Cossypha natalensis MF, OZ Frequent to common<br />
643 Willow Warbler Phylloscopus trochilus MF, OZ PM; occasional at forest edges<br />
648 Yellow-breasted Apalis Apalis flavida MF, OZ Common throughout<br />
649 Rudd’s Apalis Apalis ruddi MF, OZ Frequent to locally common<br />
657 Bleating Warbler Camaroptera brachyura MF, OZ Common throughout<br />
690 Dusky Flycatcher Muscicapa adusta OZ, MF Occasional at forest edge<br />
691 Bluegrey Flycatcher Muscicapa caerulescens OZ Occasional<br />
693 Fantailed Flycatcher Myioparus plumbeus OZ Uncommon; seen Dec 1995<br />
704 Woodward’s Batis Batis fratrum MF, OZ Occasional (most are in dry forest)<br />
705 Wattle-eyed Flycatcher Platysteira peltata OZ, (MF?) Small numbers OZ, probably also MF<br />
708 Blue-mantled Flycatcher Trochocercus albonotatus OZ, MF Sparse to locally frequent<br />
710 Paradise Flycatcher Terpsiphone viridis MF, OZ Common throughout<br />
732 Fiscal Shrike Lanius collaris MF, OZ Occasional at forest edges<br />
736 Southern Boubou Laniarius ferrugineus MF, OZ Commonest in secondary growth<br />
740 Puffback Dryoscopus cubla MF, OZ Very common throughout<br />
768 Black-bellied Starling Lamprotornis corruscus MF, OZ Common to abundant in flocks<br />
780 Purple-banded Sunbird Nectarinia bifasciata MF, OZ Occasional at forest edge<br />
790 Olive Sunbird Nectarinia olivacea MF, OZ Frequent to locally common<br />
791 Scarlet-chested Sunbird Nectarinia senegalensis MF, OZ Sometimes seen at forest edge<br />
793 Collared Sunbird Anthreptes collaris MF, OZ Frequent, especially at forest edges<br />
796 Cape White-eye Zosterops pallidus MF, OZ Frequent<br />
797 Yellow White-eye Zosterops senegalensis MF, OZ ?frequent (hard to separate from 796)<br />
807 Thick-billed Weaver Amblyospiza albifrons MF, OZ Often feeds in forest and at edges<br />
808 Forest Weaver Ploceus bicolor MF, OZ Frequent to common<br />
810 Spectacled Weaver Ploceus ocularis MF, OZ Frequent to common<br />
811 Spotted-backed Weaver Ploceus cucullatus MF, OZ Frequent to common<br />
Total: 82 species recorded<br />
3.2.2 Selected bird species of vegetated wetlands adjacent to swamp forest<br />
These species are listed because of their scarcity or their interest from a birding aspect.<br />
No. Species Area Status<br />
065 Purple Heron Ardea purpurea MF, OZ Infrequent, solitary<br />
210 African Rail Rallus caerulescens MF, OZ Rarely seen; commoner than supposed<br />
213 Black Crake Amaurornis flavirostris OZ,MF Widespread but rarely seen<br />
215 Baillon’s Crake Porzana pusilla OZ, MF Uncommon, rarely seen<br />
217 Red-chested Flufftail Sarothrura rufa MF, OZ Common but rarely seen<br />
222 White-winged Flufftail Sarothrura ayresi MF Critically endangered (Barnes 2000)<br />
223 Purple Gallinule Porphrio porphyrio OZ Localised<br />
84
286 Ethiopian Snipe Gallinago nigripennis MF, OZ Not uncommon; status uncertain<br />
407 Natal Nightjar Careimulgus natalensis MF, OZ Grassland; common; SA range very<br />
small<br />
820 Cuckoo Finch Anomalospiza imberbis MF Apparently rare; 1 on 15 Dec 2003<br />
3.2.3 Recorded and [possible] bird species at Ozabeni (Robson & Horner 1996)<br />
No. Species Status<br />
[147 Palm-nut Vulture Gypohierax angolensis Possibly a very scarce visitor; needs Raphia australis<br />
palms]<br />
158 Black Sparrowhawk Accipiter melanoleucus Occurs sparsely in swamp forest<br />
160 African Goshawk Accipiter tachiro Occurs in “all wooded habitats”<br />
[204 Crested Guineafowl Guttera pucherani Normally in dry forest only]<br />
[229 African Finfoot Podica senegalensis Rare along forested rivers (Sodwana Bay only)]<br />
350 Rameron Pigeon Columba arquatrix Uncommon winter visitor to riverine forest<br />
[378 Black Cuckoo Cuculus clamosus Dune forest only]<br />
387 Green Coucal Ceuthmochares aereus Dune forest, extending into swamp forest<br />
438 European Bee-eater Merops apiaster PM; irregular, forages over forest and woodland<br />
469 Red-fronted Tinkerbarbet Pogoniulus pusillus Occurs in all woodland<br />
483 Golden-tailed Woodpecker Campethera abingoni May occur in all forest<br />
538 Black Cuckoo-shrike Campephaga flava Occurs irregularly in forest and woodland habitats<br />
[540 Grey Cuckoo-shrike Coracina caesia Rare; dune forest only]<br />
554 Southern Black Tit Parus niger A woodland species, possibly also at forest edge<br />
[569 Terrestrial Bulbul Phyllastrephus terrestris Dry forest; needs undergrowth or thickets]<br />
[575 Yellow-spotted Nicator Nicator chloris Dry forest and thickets]<br />
[616 Brown Robin Erythropygia signata Edges of dry forest only]<br />
[747 Gorgeous Bush Shrike Telophorus quadricolor Dune forest and dense woodland/thickets]<br />
[750 Olive Bush Shrike Telophorus olivaceus Dune forest and thickly-wooded areas]<br />
[835 Green Twinspot Mandingoa nitidula Dune forest only]<br />
[848 Grey Waxbill Estrilda perreini Dune forest, scrub and thickets only]<br />
858 Red-backed Manikin Spermestes bicolor Dune forest and mois t thickets<br />
Of these 21 species, only 9 are likely to occur in swamp forest.<br />
3.2.4 Additional possible bird species<br />
Information from Cyrus & Robson (1980), Harrison et al. (1997) and KZNNCS (2000).<br />
No. Species Status<br />
076 Black-crowned Night Heron Nycticorax nycticorax Possible in riverine forest<br />
105 African Black Duck Anas sparsa Possible on rivers<br />
129 Bat Hawk Machieramphus alcinus Rarely recorded in the area (Cyrus & Robson 1980)<br />
85
204 Crested Guineafowl Guttera pucherani Normally in dry forest only<br />
421 Palm Swift Cypsiurus parvus Infrequent visitor over floodplain woodland<br />
474 Greater Honeyguide Indicator indicator Infrequent; usually in open woodland<br />
789 Grey Sunbird Nectarinia veroxii Dune forest and scrub; may enter swamp forest<br />
3.3 RESULTS - MAMMALS<br />
During the December 2003 surveys, notes were also made on the mammals seen in and adjacent to the<br />
swamp forest patches at Mfabeni. Within the forest, fresh tracks, wallows and other signs of White<br />
Rhinoceros Ceratotherium simium, Hippopotamus Hippopotamus amphibius and Buffalo Syncerus<br />
caffer were found, and all three species were seen in within the forest or in grassland immediately<br />
adjacent to the forest. It is possible that, because of the drought conditions and the lack of water in the<br />
area, these animals used the swamp forest and its streams more extensively than they normally would,<br />
but they all probably use the forest regularly, especially when lying up during the heat of the day.<br />
Other mammals recorded in the swamp forest were Thick-tailed Bushbaby Otolemur crassicaudatus,<br />
Samango Monkey Circopithecus mitis, Vervet Monkey Circopithecus aethiops, Red Duiker and<br />
various bat species, including a fruit-bat (possibly Wahlberg’s Epauletted Fruit-bat Epomophorus<br />
wahlbergi). At the forest edge Bushbuck Tragelaphus scriptus, Common Reedbuck Redunca<br />
arundinum and Common Waterbuck Kobus ellipsiprymnus were regularly seen. Blue Duiker<br />
Philantomba monticola and Red Squirrel Paraxerus palliatus occurred in dry forest immediately<br />
adjacent to a large patch of swamp forest, while Leopard Panthera pardus and Large-spotted Genet<br />
Genetta tigrina were also seen in this dry forest. Water Mongoose Atilax paludinosus occurred in<br />
marshy areas adjacent to swamp forest. Bush pig Potamochoerus porcus occurs in the swamp forest<br />
but was not seen.<br />
3.4 CONCLUSIONS<br />
The surveys, although brief and not covering the entire year, indicate that a good variety of bird<br />
species occurs in Maputaland swamp forests. The 82 species recorded include some of great interest<br />
to birders because the birds may be difficult to see in view of their scarcity or their restricted<br />
distribution locally or nationally. Such species include Southern Banded Snake Eagle, Pel’s Fishing<br />
Owl, Half-collared Kingfisher, Narina Trogon, Blue-grey Flycatcher, Fan-tailed Flycatcher, Wattleeyed<br />
Flycatcher and Woodward’s Batis.<br />
The number and variety of bird species are indicative of the richness of this forest habitat and,<br />
although swamp forest does not contain all the bird species found in drier forest types in Maputaland,<br />
it has sufficient species to give it considerable potential for organized birding tours and guided walks.<br />
Furthermore, there are interesting mammal species to be found in the habitat, although care has to be<br />
taken with the larger and more dangerous mammals - which is why guided walks are advisable within<br />
the forest habitat. However, much can also be seen by walking outside the forest patches, though<br />
adjacent grassland and short-vegetated wetland areas, when the variety of butterflies and flowers can<br />
also be appreciated. Walking within the swamp forest itself is an experience not to be missed,<br />
especially when the trees are large and of impressive growth form, and a swamp forest component<br />
would be a very valuable addition to any birding, or any general wildlife/natural history trail or tour.<br />
86
The wetlands adjacent to the Maputaland swamp forests are also often very impressive, in terms of<br />
their wetland vegetation types, flowers and insects, as well as the number and variety of birds that<br />
occur there (e.g. see Taylor 1997). It is not practical to give a full list of wetland-associated birds in<br />
this <strong>report</strong>, but the very short list provided shows some of the “specialties” of these wetlands.<br />
Important species include the critically endangered White-winged Flufftail, which occurs regularly at<br />
only 10 sites in southern Africa and was discovered at Mfabeni only in late 2002 (Taylor & Grundling<br />
2003). In addition, the Natal Nightjar, which has a conservation status of Vulnerable (Barnes 2000),<br />
occurs in South Africa only on the coastal plain of northern KZN, where it is locally common in moist<br />
grassland.<br />
4. Distribution, mapping and evaluation of CPSF (FE, PLG)<br />
4.1 Introduction<br />
Peat accumulates in Maputaland on the southern portion of the Mozambique Coastal Plain (MCP) in<br />
different geomorphological and wetland ecological settings ranging from interdune swamp forest and<br />
reed/sedge mires to an inland delta (the Mkuze Delta) and coastal lake-related peatlands (Grundling,<br />
et al, 1998).<br />
Maputaland peatlands vary in size from a few hectares up to thousands of hectares wetland (Figures<br />
34-37 in the appendix of this section) and approximately 266 peatlands occur within the Mozambique<br />
coastal plain in Maputaland. Peat thickness varies from 0.5 to 10 m (appendix of this section). The<br />
Mkuze Swamp, about 8 800 ha in size, is the largest wetland containing peat with a maximum<br />
thickness of 6 m and the Mfabeni peatland has the thickest peat profile with a maximum thickness of<br />
10 m (appendix of this section).<br />
During the investigation most of the wetlands in the study area were covered and close to 2 000 sites<br />
were visited. The individual Maputaland peatlands are described in table form in Appendix y. CPSF<br />
were found to be associated with open ended interdune systems. These systems would typically<br />
incorporated flowing water linked to coastal lakes, floodplains or the Indian Ocean.<br />
4.2 Methods used for inventory, mapping and evaluation<br />
Available map sources<br />
Evaluation and classification of satellite data<br />
Production of inventory maps<br />
On a regional scale, peatlands were identified and delineated with the aid of 1:50 000 maps and aerial<br />
photographs. These sites were then verified infield. A regional map was then compiled using the<br />
South African National Land Cover 2000 (NLC 2000) wetland data set with existing peatland maps<br />
of the region. The existing peatland maps are based on 1: 50 000 field maps and are hosted in the<br />
Peatland Eco-regional database housed at the Department of Agriculture, South Africa. A range of 1:<br />
100 000 – 1: 250 000 maps from regional peatland and wetland related <strong>report</strong>s were used to<br />
supplement the mapping data.<br />
87
The NLC2000 developed a 1:50,000 scale land-cover dataset, which includes large, easily discernable<br />
wetland features. An “advanced” wetland modeling process being run within the NLC2000 project<br />
aims to provide additional, more detailed wetland information. This “advanced” wetland data is<br />
derived from a combination of satellite image analysis and spatial terrain model analysis, and goes<br />
beyond the scope of the standard land-cover mapping product (Landmann 2003). Wetland features<br />
will typically occur in landscape zones associated with specific hydrological and terrain<br />
characteristics, e.g. riparian, pans, marshes, hill slope seeps etc. Multi-season satellite imagery is used<br />
to emphasis the wet/ dry season vegetation response differences between wetlands and the<br />
surrounding non-wetland vegetation communities. Advanced terrain modeling processes are used to<br />
identify those areas in the landscape that could potentially contain wetlands, irrespective of the<br />
associated land-cover characteristics. The products of the satellite image analysis and the terrain<br />
modeling are combined to generate a detailed map dataset showing the likely occurrence of small<br />
wetland features in a given environment. This advanced wetland dataset is then incorporated into the<br />
original NLC2000 Land-cover dataset to proved end-users with a detailed inventory of both current<br />
land-cover / use and associated wetland feature occurrence (Landmann 2003).<br />
The advanced wetland modeling is not intended to provide a definitive wetland inventory with<br />
accurate boundary delineations, but rather a reliable indication of wetland occurrence and location<br />
within a given catchment. Mapped wetland boundaries will be strongly influenced by local vegetation<br />
response and condition at the time of satellite overpass, and the associated local rainfall patterns<br />
The mapping process assumes that 90% of vegetated wetlands will have a grass-type cover, and that<br />
these grass-covered areas are identified successfully in the initial land-cover mapping process as part<br />
of the natural grassland category. If errors occurred in the initial natural vegetation mapping, then<br />
these will be carried over into the satellite image analysis component of the advanced wetland<br />
modeling<br />
Peat was cored in field with the aid of a Russian Peat Sampler. This device allows the collection of<br />
samples from the top to the bottom of the peat bed. Samples are then placed into labeled 120 ml<br />
plastic bottles and sealed with airtight caps. For each peatland the main surface floral species and the<br />
maximum thickness of the peat at each sample site are recorded. C 14 age dating and pollen analyses<br />
were carried out on selected samples Landmann, 2003).<br />
4.3 Results<br />
The MCP hosts the most extensive wetlands and best developed peat deposits in South Africa .It has a<br />
high bio-diversity with a dominant proportion of endemic species (Taylor, 1991) and is situated<br />
mostly within the Coastal Bushveld/Grassland Biome of Southern Africa (Low and Rebelo, 1996).<br />
The wetlands containing the peat have formed within valleys of a palaeo-dune landscape (Hobday,<br />
1979) and are the result of a very shallow water table. The peatlands and enclosing wetlands are<br />
groundwater fed. Perched aquifers within the sand dunes are a prominent source of water for the<br />
wetlands. The peatlands of Maputaland are dominated by ground water and surface water inflow and<br />
can thus be classified as fens.<br />
The peat deposits of Maputaland are controlled by:<br />
88
? low energy conditions, the result of a low topography (generally less than 50 m above mean<br />
sea level).<br />
? high rainfall (+800 mm pa) resulting in a copious perennial water supply and a consequent<br />
oversupply of biomass.<br />
? the topography of the underlying Pleistocene KwaMbonambi dunes. The dune topography<br />
results in elongated interdune valleys, usually orientated parallel to the present coastline. In<br />
these valleys peat deposits may form.<br />
The highest concentration of swamp forests thus occur in the high rainfall areas of 900 – 1000 mm pa<br />
plus, just inland of, and along the eastern coastal dune corridor , but important exceptions<br />
occur towards the west such as the degraded swamp forests at Mseleni on the western edge of<br />
Lake Sibaya (Grundling, 1994) or the tributaries of the northwards flowing Futi (Mkuzi-<br />
North) stream, where the rainfall varies between 600 – 800 mm pa. The contribution of<br />
coastal lakes and geohydromorphic features in the Maputaland landscape in the control of the<br />
distribution of the CPSF must not be under estimated and needs to further investigated.<br />
It has become evident during this study that more than 90 % of the CPSF’s are related to open ended<br />
interdune coastal lake related systems.<br />
4.3.1 Geomorphological settings of interdune peatlands<br />
The costal interdune valleys are associated with coastal lakes linked to either drowned and closed<br />
river mouths (Hobday and Orme, 1979) or to a lesser extent floodplains.<br />
Four different geomorphological settings are distinguished by Grundling et al, (2000) and Grundling<br />
(2002) for interdune valleys hosting peatlands in Maputaland:<br />
?? Isolated interdune valley peatlands<br />
Isolated interdune valley peatlands are most common in northern Maputaland and are usually<br />
covered by reeds and sedges.<br />
?? Interdune valley peatlands linked to coastal lakes as a result of the closure of drowned river<br />
mouths<br />
These peatlands are the most common type of peatland and are restricted to the Maputaland area.<br />
They are covered by reeds and sedges and/or swamp forests (Fig. 3).<br />
?? Interdune valley peatlands linked to coastal lakes on floodplains<br />
This type of peatland is restricted to the floodplains of the major rivers in the area, the Mkuze and<br />
Umfolozi Rivers, and are covered by papyrus, reeds and sedge. Some swamp forests do occur in<br />
these settings.<br />
?? Interdune valley peatlands linked to streams<br />
The distribution of this type of peatland is uncommon in Maputaland and are usually covered by<br />
swamp forests and/or reeds and sedges.<br />
89
The distribution of the swamp forest within the MCP are thus imprinted on the distribution of coastal<br />
lakes, floodplains and estuaries. The smaller coastal lakes are distributed along the coastline behind<br />
the main coastal dune corridor with larger systems such as Kosi Bay, Lake Sibaya and St Lucia<br />
extending a few kilometers inland.<br />
Barringtonia dominated swamp forests<br />
It has been noted extensively through the whole study area that swamp forests or riverine forest that<br />
are dominated by Barringtonia racemosa do not contain peat. Only some organic, sandy clay or dark<br />
clay material is present. The Barringtonia racemosa only dominates parts of swamp forest peatlands<br />
where there is concentrated surface water flow. Thus the presence of Barringtonia racemosa indicates<br />
relatively high-energy flow zones within the peatland, typical for a clastic dominated swamp forest<br />
wetland, not amenable to peat accumulation. Under these conditions the heavy seed pod of<br />
Barringtonia racemosa can be transported. However, all organic material that may have accumulated<br />
is flushed out of the system at the same time. The presence of Barringtonia racemosa is thus<br />
regarded to be an indicator for portions of a wetland with low peat potential (Grundling, et al, 2000).<br />
4.4 Tendencies/ scenarios (e.g. the future of CPSF areas, presumed the damage<br />
continues in the same extent; and the consequences)<br />
Swamp forests are targeted for a number of practical reasons for cultivation:<br />
??Drainage due to the drainage associated with the setting of the CPSF.<br />
The peatlands associated with closed interdune basin are difficult to drain and thus difficult to<br />
cultivate. Since most CPSF are related to drainage lines (even those open ended interdune systems)<br />
and are therefore drained much easier.<br />
??Source of nutrients<br />
The reworked dune sands comprising most of Maputaland are very nutrient poor, even more so than<br />
the peat occurring in the area. Only 15% of the reed/papyrus and sedge dominated peatland contain<br />
significant peat, while most swamp forests contain a relative thick (0.5 m) build up of organic<br />
significant peat layers, with 30 % comprising significant peat layers of 0.8m and thicker (Grundling,<br />
et al, 1998). Higher oxidation rates within swamp forest peats might contribute to this relative high<br />
sources of nutrients in comparison with other types of peatlands in Maputaland.<br />
??Water<br />
Evidence of abandoned raised garden beds (described as fossil gardens by Grundling, 1996) in<br />
seasonal wetlands on Maputaland highlights the unpredictable inundation of wetlands across<br />
Maputaland based on variable rainfall patterns. Local groundwater tables vary as much as 3 m within<br />
season based on rainfall events (Kyle, pers. Comm.) if and when it rains. The stable water sources<br />
associated with swamp forests are thus another important consideration when selecting cultivation<br />
plots.<br />
The extent of swamp forest cultivation various from north to south and east to west across<br />
Maputaland. Evidence suggests that swamp forests are more heavily cultivated in South Africa than in<br />
Mozambique. Probably as a result of the civil war in Mozambique that could have resulted in<br />
restricted access to the swamp forests in the southern part of Mozambique and lower population<br />
densities in that country. Swamp forest cultivation in South Africa seems as much to be a traditional<br />
activity as it is a result of increasing population pressures. Grundling (1996) describes as system of<br />
90
otation and rest evident in the peatlands of Maputaland, based on traditional cultivation practices.<br />
However, the current intensive cultivation practices are situated close to local development nodes<br />
(e.g. Manguzi/Kwangwanase and Mseleni). These villages are nowadays linked with greater towns<br />
and urban areas through and effective roadnet work, and thus to outside markets creating larger<br />
demand for produce cultivated amongst other in CPSF’s.<br />
Rainfall patterns dictate the distribution of the population in Maputaland and most communities were<br />
located on the fertile floodplains of the Pongola, Mkuze and other rivers in the western parts of<br />
Maputaland or close to the higher rainfall areas along the eastern coastal dune corridor. The higher<br />
population densities associated with the higher rainfall thus also related in more pressures on the<br />
swamp forests with lesser impacts on swamp forests more inland. However, the highest concentration<br />
of CPSF is also associated with the higher eastern rainfall areas.<br />
4.5 Outlook for further work<br />
??Study the relationship and significance of CPSF distribution linked to interdune valleys and coastal<br />
lakes.<br />
??Future trends in swamp forest cultivation could be established by predicting population dynamics in<br />
Maputaland.<br />
??Significance in the pattern (distribution, cultivation etc) of abandoned raised cultivated beds and<br />
population distribution/ and/or current CPSF distribution.<br />
??Study and zone commercial forestry and related practises.<br />
Other:<br />
??Alternative cultivation practices outside CPSF (intensive trench gardening linked with rainwater<br />
harvesting and water harvesting from CPSF).<br />
??Investigate and develop CPSF and other wetland rehabilitation options:<br />
??CEPA options<br />
??Blocking of Drains<br />
??Rewet degraded CPSF’s, and other peatlands/ wetlands<br />
??Upgrade road crossings<br />
??Landcare adjacent to CPSF (eg. Stabilise steep valley slopes)<br />
??Cultivate and replant swamp forest species)<br />
??Landscape abandoned raised cultivated beds<br />
4.7 Generation of a map of Peat Swamp Forest distribution in Maputaland using<br />
remote sensing data (FE)<br />
4.7.1 Introduction<br />
The Swamp Forests of Maputaland have not been well studied, although several recent<br />
studies have been carried out in South Africa by researchers at the Universities KwaZulu-<br />
Natal (Schoultz 2000, Goge 2003) and Pretoria (Venter 2003). As far as we are aware, no<br />
similar studies have been conducted in Mozambique.<br />
91
Based on these studies a picture of the character of Pristine Swamp Forests in the South<br />
African part of Maputaland is emerging, but there is little understanding of environmental<br />
factors that fundamentally affect their distribution, with the exception that they typically<br />
occur on peatlands. Despite this general observation, our understanding of their distribution is<br />
poor, as many peatlands exist that do not support Swamp Forest, and in many cases, a single<br />
large peatland may support forested as well as herbaceous vegetation types, with no clear<br />
indication of environmental heterogeneity at the boundary of these strikingly different<br />
vegetation types.<br />
An important feature of the studies on Swamp Forests that have been conducted in<br />
Maputaland to date, is that they have focussed upon Swamp Forest in conservation areas and<br />
which are in a pristine or semi-pristine state. However, it has become clear recently that<br />
outside of conservation areas, as well as within some conservation areas that have not yet<br />
been studied, Swamp Forests have been modified by humans for subsistence and – in some<br />
cases – for more formal (semi-commercial) agriculture. This practice has arisen for many<br />
reasons, but particularly since the conversion of Swamp Forest to agricultural land offers the<br />
only situation in the landscape that is sufficiently fertile for crop production. It must be<br />
remembered that the peatlands of Maputaland occur on the coastal plain on the east coast of<br />
Africa, which comprises reworked marine sediments that produce extremely infertile soils.<br />
A second important feature of studies on Swamp Forests in Maputaland, is that their<br />
distribution has not been mapped to any appreciable extent. Schoultz (2000) and Venter<br />
(2003) have mapped Swamp Forest for localised areas, namely the Mbazwane and Mfabeni<br />
Peatlands respectively (Figure 33).<br />
The present mapping exercise therefore represents the first attempt to map the Swamp Forests<br />
of Maputaland as a whole, including the area from Lake St Lucia in the south as far as<br />
Maputo Bay in the north (Figure 33).<br />
4.7.2 Methods used for inventory, mapping and evaluation<br />
Details of available imagery<br />
Two Landsat 7 ETM+ satellite images were obtained covering the study area as follows:<br />
?? Lake St Lucia northwards as far as Lake Piti in southern Mozambique (26° 37’ S).<br />
This image was taken on 11 August 2001<br />
?? Maputo Bay southwards as far the southern end of the Kosi Lake system in northern<br />
KwaZulu-Natal in South Africa (27° 02’ S). This image was taken on 17 October<br />
2002<br />
Each image comprised 7 bands, ranging from the visible through to the thermal infra-red<br />
portion of the electromagnetic spectrum.<br />
Image processing and classification of satellite data<br />
The two images were orthometrically rectified and projected to the Universal Transverse<br />
Mercator (UTM) Projection, Zone 36S. From this point onwards, identical techniques were<br />
92
applied to both images.<br />
A supervised classification was attempted using data from reference sites of known location<br />
and vegetation cover. Such field-based data can be used as “training sites” to determine the<br />
spectral characteristics (“signature”) of individual pixels in the satellite image, forming the<br />
basis for mapping other pixels in the image with similar spectral characteristics. Provided<br />
sufficient pixels of the pre-determined land cover classes are used, the supervised<br />
classification will identify all pixels of similar spectral character. This approach failed<br />
completely as the <strong>final</strong> output covered many forested vegetation types including Dune Forest<br />
and Sand Forest – both of which are terrestrial (non-wetland) forest types. The reason that<br />
this approach failed may have been due to the small number and limited spatial coverage of<br />
the training sites.<br />
In view of the lack of success of the supervised classification approach, an unsupervised<br />
classification approach was used in which a multivariate statistical cluster analysis was<br />
performed on the spectral data alone, differentiating land cover (including vegetation) types<br />
on the basis of pixel spectral characteristics alone. The initial classification produced 10<br />
spectral classes, of which 3 were identified as being associated with forest vegetation alone<br />
(Swamp Forest as well as terrestrial forest types). All pixels in these 3 classes were extracted<br />
from the image and a further unsupervised classification was performed based on the spectral<br />
data alone. This produced 9 land cover classes, of which one class represented Pristine<br />
Swamp Forest together with Pristine Dune, Mangrove and Sand Forest, while another<br />
depicted Disturbed Swamp Forest. In order to improve mapping accuracy, all areas of Coastal<br />
Forest, Mangrove Forest and Sand Forest were manually removed from the image using<br />
masking techniques. The Dune and Sand Forest masking technique was based primarily on an<br />
understanding of the fact that Dune and Sand Forests occur at higher elevation than Swamp<br />
Forest, such that elevation became the primary criterion for applying the mask. Mangrove<br />
Forests require regular inundation by sea water and hence the area of the tidal zone was used<br />
as the criterion for masking these forests.<br />
Production of inventory maps<br />
Maps of Swamp Forest were produced for Mozambique and South Africa from the satellite<br />
imagery as an overlay on a true colour composite image for the two countries. The seasonal<br />
differences in the timing of these images accounts for differences in their general appearance,<br />
but the accuracy of the mapping is considered reasonable, although it has not been tested<br />
formally.<br />
Detection of vegetation change<br />
Vertical black and white aerial photography of a portion of the study area, taken in 1942, was<br />
scanned using a conventional computer scanner. Photographs were overlaid onto the 2002<br />
satellite imagery available from this study. The aerial photographs were orthometrically<br />
rectified using features of known location visible in both images, and the boundaries of these<br />
was mapped using on-screen digitising, to create polygons. The polygons of Swamp Forest in<br />
1942 were superimposed onto the satellite image map of Pristine Swamp Forest in 2002, for<br />
93
comparison. Areas were calculated for comparable patches using available software in the<br />
GIS in which the digitising had been carried out!<br />
4.7.3 Results<br />
Classification of Swamp Forest<br />
Swamp Forest vegetation was classified using an unsupervised classification approach, and it<br />
was only possible to distinguish two classes of Swamp Forest vegetation:<br />
?? Pristine Swamp Forest<br />
?? Disturbed Swamp Forest<br />
The category of Pristine Swamp Forest includes all Swamp Forest that has not been disturbed<br />
by humans for cultivation. The category of Disturbed Swamp Forest includes all Swamp<br />
Forest that has been disturbed for purposes of cultivation, but based on the spectral data, it<br />
was not possible to identify the nature or extent of disturbance within the Swamp Forests.<br />
This is unfortunate, but in order to achieve this one needs a large amount of local data on land<br />
cover and land use at the time of the satellite imagery.<br />
Nevertheless, as a first attempt at mapping Swamp Forest at a regional scale, the mapping is<br />
considered to be reasonably accurate, although ground-truthing is necessary in order to<br />
statistically test accuracy. At this stage, the map is considered to be within 80-90% accurate,<br />
based on a large body of student research in the area, as well as personal experience of the<br />
area by several of the researchers in the present study.<br />
Regional scale pattern of Swamp Forest distribution<br />
The distribution of Disturbed and Pristine Swamp Forest in South Africa and Mozambique is<br />
depicted in Figure 34 (South Africa) and Figure 35 (Mozambique) at a scale of approximately<br />
1:600 000 and 1:400 000 respectively. Being a GIS product, maps can be produced at any<br />
scale, although a scale of between 1:20 000 and 1:600 000 is best as at finer scales than 1:20<br />
000, individual pixels become clearly visible and interpretation difficult. Swamp Forest<br />
occupies a narrow band of low-lying terrain immediately to the west of the coastal dune<br />
cordon on the coastal plain, where it occupies basins that are frequently associated with<br />
coastal lakess. The Swamp Forests occur in landscape positions where the land surface (of<br />
minerogenic material) occurs below the groundwater rest level. These areas are therefore<br />
permanently flooded, creating conditions that lead to the accumulation of peat. Peat<br />
comprises organic material (as opposed to minerogenic material), upon which the Swamp<br />
Forests are situated. The distribution of Swamp Forest is therefore strongly linked with<br />
elevation and groundwater rest conditions, which are largely a product of the<br />
geomorphological history of the coastal plain and current groundwater conditions, which in<br />
turn are governed largely by interactions between local rainfall, groundwater flow<br />
characteristics and sea level.<br />
Local scale pattern of Swamp Forest distribution<br />
Within the region as a whole, it is clear that at the local scale, Swamp Forest either occupies<br />
entire peat basins, or alternatively occurs on the western margin of large peatlands. This<br />
94
latter pattern can be seen in the case of the Mfabeni Swamp on the Eastern Shores of Lake St<br />
Lucia as well as the wetlands of the Mbazwane Stream to the north of St Lucia (Figure 34).<br />
The more localised distribution of Swamp Forest is more difficult to explain as there are<br />
many wetlands in a similar hydrogeomorphic position in the study area that are not forested.<br />
The systematic occurrence of Swamp Forest on the western edge of peatlands, often<br />
immediately east of a steep ancient coastal dune, led Schoultz (2000) to hypothesise that<br />
Swamp Forest is situated in areas that are protected from hot, dry winds that occur during<br />
winter (“berg winds”). Berg winds blow across the coastal plain from the west and dry out<br />
vegetation sufficiently to sustain fire. In areas where these winds blow, vegetation is<br />
susceptible to burning. Swamp Forest that occurs on the western edge of large peatlands<br />
immediately to the east of an ancient dune, is protected from the direct effects of these winds,<br />
which may account for their localised distribution on the coastal plain. Alternative<br />
hypotheses have been proposed, including that they occur in areas where there is groundwater<br />
flow across the landscape (Venter 2003).<br />
Current status of CPSF in Maputaland<br />
Based on the present study, approximately 94.0 km 2 of Swamp Forest was present in the<br />
study area at the time of the satellite imagery, with 52.8 km 2 (56%) being Pristine and 41.2<br />
km 2 (44%) being Disturbed (Table 12). South Africa supports a much greater area of Swamp<br />
Forest (56.9 km 2 ; 61% of the total) than Mozambique (37.1 km 2 ; 39% of the total). Despite<br />
this situation, about 50% of South Africa’s Swamp Forest was disturbed while only about<br />
33% of Mozambique’s Swamp Forest was disturbed. Thus, the area of Pristine Swamp Forest<br />
in South Africa and Mozambique are fairly similar.<br />
Table 12: Estimates of the areas of Disturbed and Pristine Swamp Forest for the entire study area as well as for<br />
For South Africa and Mozambique.<br />
Whole Area South Africa Mozambique<br />
Disturbed Pristine Disturbed Pristine Disturbed Pristine<br />
Number of pixels 45833 58655 31686 31593 14147 27062<br />
Area (m 2 ) 41249700 52789500 28517400 28433700 12732300 24355800<br />
Area (km 2 ) 41.2 52.8 28.5 28.4 12.7 24.4<br />
Within both South Africa and Mozambique, disturbance of Swamp Forest is typically in close<br />
proximity of human settlements, and it takes place from the forest margin into the forest.<br />
These forest margin habitats (ecotones) are likely to be extremely rich and productive areas<br />
biologically. At this stage our knowledge of these systems is poor, and it is difficult to say<br />
what the implications of this peripheral invasion of Swamp Forest are – except possibly that<br />
Swamp Forest margins may have species that are dependant upon them, including species<br />
that might be rare or endangered.<br />
Extent of the former Pristine CPSF area<br />
An analysis of case study areas has revealed that Swamp Forest has experienced both<br />
expansion and reduction in the South African section of the coastal plain. In areas within<br />
close proximity to commercial forestry, Swamp Forest has experienced remarkable expansion<br />
95
– presumably as a consequence of fire exclusion to protect commercial plantations. This is<br />
clearly illustrated in the case of the Swamp Forest north of Lake Sibaya (Manzengwenya<br />
Forest), where a herbaceous peatland with scattered and isolated patches of Swamp Forest<br />
totalling 93.2 ha expanded into a single extensive area of Swamp Forest of 238.6 ha over the<br />
period of approximately 60 years from 1942 to 2002 (Figure 36). This probably occurred as a<br />
result of the introduction of commercial forestry in this area in the 1950's, which was<br />
associated with the exclusion of fire.<br />
In contrast to this, a large area of Swamp Forest (Malangeni Forest) south of the<br />
southernmost lake in the Kosi Bay system (Lake aManzimnyama) has contracted as a<br />
consequence of human activity. An extensive area of Swamp Forest has been reduced in size<br />
from 969.4 ha to 790.9 ha over the period from 1942 to 2002 (Figure 37). Our sense is that<br />
this has been primarily to support agricultural activities by local people, but this needs to be<br />
examined more carefully, which can be achieved by systematic analyses of aerial<br />
photography as well as interviews with local people who have resided in the area for a long<br />
time.<br />
Different degrees of disturbance and damage<br />
It is not possible at this stage to comment on different degrees of disturbance or damage, as<br />
this could not be detected in the current satellite imagery for one or more of the following<br />
reasons:<br />
?? The spectral characteristics of various classes of Disturbed Swamp Forest are not<br />
sufficiently heterogeneous to enable detection;<br />
?? The spectral data of Landsat ETM may not be appropriate to differentiate various<br />
classes of Disturbed Swamp Forest;<br />
?? The pixel size (30m x 30m) of Landsat ETM may be too great to detect disturbance<br />
that is spatially heterogeneous at a very fine scale – especially when one considers<br />
edge effects of individual pixels.<br />
Classes of disturbance and their extent within the project area<br />
Based on our inability to detect different classes of disturbance, it is not possible to describe<br />
their distribution or extent in the study area.<br />
3.7.4 An assessment of trend<br />
Given the contrasting processes of change with respect to Swamp Forest in Maputaland, it is<br />
difficult without further investigation to <strong>report</strong> accurately on their current status and trend. In<br />
any given landscape, vegetation processes lead to vegetation degradation or succession.<br />
However, due to prolonged civil war in Mozambique where people moved into cities for<br />
protection, the situation in rural Mozambique is likely to represent a situation of limited<br />
human-induced disturbance, which we can consider reasonably natural. In Mozambique the<br />
ratio of Disturbed to Pristine Swamp Forest is something like 33% Disturbed to 67% Pristine.<br />
However, the values in South Africa are 50% Disturbed to 50% Pristine. This dramatic<br />
contrast between the situation in South Africa and Mozambique suggests that accelerated loss<br />
of Swamp Forest is taking place in South Africa compared to Mozambique, and since this is<br />
96
an extremely rare vegetation type in South Africa (Venter 2003), this is cause for concern –<br />
possibly alarm!<br />
3.7.5 Outlook for further work<br />
This study is ongoing and there will be additional attempts to verify the present maps with<br />
the situation on the ground. Further investigation into the rates and cause/s of vegetation<br />
change are also planned.<br />
For the result maps see next section.<br />
4.6 Annex Chapter 4<br />
4.6.1 Characterisation of individual peatlands of Maputaland<br />
97
LEGEND TO APPENDIX<br />
Table 13. This table describes the individual peatlands of Maputaland:<br />
Utilisation<br />
Peatlands form the basis for the following activities:<br />
· Source of water (W)<br />
· Subsistence farming (G),<br />
· Source of biomass, e.g. reeds used as building material,<br />
· Fodder for animals,<br />
· Plantations (PL), and<br />
· Conservation and tourism activities<br />
Vegetation<br />
The main vegetation types covering peatlands are mentioned.<br />
Vegetation Type<br />
Vegetation Type<br />
R Phragmites Reeds G Grasses<br />
P Papyrus SF Swamp Forest (e.g. Syzygium corda<strong>tum</strong>, Ficus<br />
species)<br />
B Bullrush (Typha capensis) RF Riparian Forest<br />
S Sedges V Ferns<br />
Basin factor<br />
A factor given to take the shape of a basin into account, when estimating the volume (m 3 ) of<br />
a peatland based on the area and one or a restricted number of peat thickness. For example:<br />
an interdune basin with very steep slopes will have a smaller factor (1/2) than a shallow basin<br />
with shallow slopes (3/4):<br />
Basin Shape<br />
Peat -<br />
Basin<br />
Factor<br />
Formula:<br />
A x t x BF = m 3<br />
A = area; t = thickness<br />
Deep Basin:<br />
Basin with very steep, high angle basin<br />
slopes/dunes<br />
Medium Depth Basin:<br />
Basin with steep, high angle basin slopes/dunes<br />
Shallow Basin:<br />
Basin with shallow angle basin slopes/dunes<br />
Very Shallow Basin:<br />
Relative height and angle of basin slope/<br />
Dunes meaningless in terms of the extent of<br />
the width of the basin<br />
1/2 A x t x 1/2 = 1/2 m 3<br />
2/3 A x t x 2/3 = 2/3 m 3<br />
3/4 A x t x 3/4 = 3/4 m 3<br />
1 A x t x 1 = 1m 3<br />
98
Ash Content<br />
The ash content of peatlands were classified as:<br />
· Low, with an ash content of less than 15 %,<br />
· Medium, with an ash content of between 16 - 30 %,<br />
· High, with an ash content of between 31 - 50 %, and<br />
· Inorganic, with an ash content of mores than 51 %.<br />
“N/A” indicates that the ash content is not available.<br />
Peat resources<br />
Peatland thickness is based on mostly one sample site per peatland. The peatland area and<br />
peat volume is based on the wetland area in which the peat occurs. The symbol # refers to<br />
for example: # 570 - The area or volume of a part of a peatland that forms part of the total<br />
peatland area or volume of (for example) peatland number 570.<br />
Peatlands with unknown thickness (about 5 % of the total) in the Tewati Wilderness area<br />
and Dukuduku were not taken into account in the inferred resource estimation. This<br />
study was executed on a regional scale. Small deposits of peat in the bigger wetlands<br />
could also have been overlooked.<br />
99
Table 14. Peatland Characterisation<br />
Peatland<br />
Name/No<br />
Muzi-Oos<br />
31<br />
Position<br />
S26°55'54"<br />
E32°36'05"<br />
Maximum<br />
Known Age<br />
(BP)<br />
Peat<br />
Thickness<br />
(m)<br />
0.80<br />
Wetland<br />
Utilisation<br />
Gardens,<br />
Water<br />
Vegatation<br />
Cover<br />
Are<br />
a<br />
(ha)<br />
Basin<br />
Factor<br />
Volume<br />
(m 3 )<br />
X 1000<br />
R/S #570 3/4 #570<br />
Ash<br />
Content<br />
(%)<br />
Highmedium<br />
Elevation (a.s.l)<br />
(m)<br />
45<br />
Comments<br />
Muzi-Oos<br />
564<br />
S26°55'24"<br />
E32°36'05"<br />
Org<br />
Sand<br />
Gardens,<br />
water<br />
R/S - - - High 40<br />
Organic<br />
Sand<br />
Muzi-Oos<br />
50<br />
S26°54'50"<br />
E32°36'<br />
3.50<br />
Biomass,<br />
gardens,<br />
R/S 90 3/4 1 957.5 4 200 ± 50 N/A 40<br />
Muzi-Oos<br />
Drif 54<br />
S26°53'30"<br />
E32°35'45"<br />
Sand<br />
Gardens,<br />
Water<br />
R/S - - - High 30 Sand<br />
Muzi-Oos<br />
569<br />
S26°56'00"<br />
E32°35'45"<br />
1.40<br />
Gardens,<br />
water<br />
G/S 45<br />
Muzi-Oos<br />
104<br />
S26°53'11"<br />
E32°36'02"<br />
2.70<br />
Biomass,<br />
water<br />
R/S 8 2/3 144 High 30<br />
Muzi-Oos<br />
570<br />
S26°56'03"<br />
E32°35'57"<br />
1.00<br />
Gardens,<br />
water<br />
R/S 30 3/4 225 N/A 45<br />
Muzi-Oos<br />
572<br />
S26°56'26"<br />
E32°36'09"<br />
2.00<br />
Gardens,<br />
water<br />
R/S 60 2/3 720 N/A 50<br />
Peatland<br />
Name/No<br />
Position<br />
Peat<br />
Thickness<br />
(m)<br />
Wetland<br />
cover<br />
Area<br />
(ha)<br />
Basin<br />
Utilisation<br />
Vegatation<br />
Factor<br />
Volume<br />
(m 3 )<br />
X 1000<br />
Maximum<br />
Known Age<br />
(BP)<br />
Ash<br />
Content<br />
(%)<br />
Elevation (a.s.l)<br />
(m)<br />
Comments<br />
100
Muzi-Oos<br />
573<br />
Muzi-Oos<br />
574<br />
MUZI-OOS<br />
TOTAL<br />
Muzi-Oos-<br />
Trib. 568<br />
Muzi-Noord<br />
106<br />
Muzi-Noord<br />
108<br />
Muzi-Noord<br />
193<br />
Muzi-Wes<br />
119<br />
Lukwakwani<br />
85<br />
Mloli<br />
183<br />
Mloli<br />
182<br />
Mloli-Oos 180<br />
Gazini<br />
171<br />
S26°56'47"<br />
Gardens,<br />
1.50<br />
E32°36'28"<br />
Water<br />
R/S #572 2/3 #572 N/A 50<br />
S26°57'<br />
Gardens,<br />
1.90<br />
E32°36'30"<br />
Water<br />
R/S #572 2/3 #572 N/A 50<br />
3 046.5<br />
S26°55'55"<br />
E32°35'08"<br />
0.70 Water R/S 1 3/4 0.525 N/A 45<br />
S26°52'52"<br />
Gardens,<br />
1.70<br />
E32°36'21"<br />
water<br />
R/S 14 1 238 N/A 30<br />
S26°52'16"<br />
Gardens,<br />
1.20<br />
E32°37'04"<br />
water<br />
R/S 20 3/4 180 Medium 30<br />
S26°52'09"<br />
Gardens,<br />
High-medium-high<br />
2.30<br />
R/S 26 3/4 448<br />
E32°37'41"<br />
water<br />
30<br />
S27°01'55"<br />
Gardens,<br />
3.20<br />
E32°29'45"<br />
water<br />
R/S 3 2/3 64 High 30<br />
S27°04'30"<br />
Gardens,<br />
1.85<br />
E32°31'05"<br />
water<br />
G/S 5 3/4 69 N/A 55<br />
S26°54'01"<br />
Gardens,<br />
2.10<br />
E32°37'29"<br />
water<br />
SF 8 3/4 111 N/A 30<br />
S26°53'48"<br />
Gardens,<br />
1.60<br />
E32°37'28"<br />
water<br />
SF #183 3/4 #183 N/A 30<br />
S26°54'07"<br />
Gardens,<br />
1.80<br />
E32°37'51"<br />
water<br />
SF 8 3/4 111 N/A 40<br />
S26°52'30"<br />
Gardens,<br />
2.00<br />
E32°38'36"<br />
water<br />
SF 10 3/4 150 N/A 45<br />
Cele S26°52'11" 0.40 Gardens, SF #293 3/4 #293 N/A 35<br />
Organic<br />
Sand/Clay<br />
101
279 E32°46'14" water<br />
Cele<br />
293<br />
Cele<br />
281<br />
Cele<br />
280<br />
Ndlovu<br />
294<br />
KuNkanini<br />
222<br />
Enkathweni<br />
Wes 250<br />
Enkathweni<br />
Oos 261<br />
Sileza<br />
461<br />
Majiji(58) 346<br />
Ntombeni (16)<br />
477<br />
Ntombeni (16)<br />
388<br />
Ntombeni (16)<br />
375<br />
Mahashe 478<br />
S26°52'23"<br />
Gardens,<br />
0.70<br />
E32°46'25"<br />
water<br />
SF 15 3/4 79 N/A 35<br />
S26°52'18"<br />
Gardens,<br />
Sand<br />
E32°46'33<br />
water<br />
SF - - - High 35 Sand<br />
S26°51'52"<br />
Gardens,<br />
1.00<br />
E32°46'52<br />
water<br />
SF #293 - #293 Medium 35<br />
S26°52'23"<br />
Gardens,<br />
2.00<br />
E32°45'45"<br />
water<br />
SF 5 3/4 75 N/A 40<br />
S26°56'58"<br />
Gardens,<br />
0.80<br />
E32°46'41"<br />
water<br />
SF 8 2/3 43 N/A 20<br />
S27°00'07"<br />
Gardens,<br />
1.80<br />
E32°45'29"<br />
water<br />
SF 4 2/3 48 Medium 30<br />
S27°00'34"<br />
Gardens,<br />
1.60<br />
E32°46'30"<br />
water<br />
SF 3 3/4 36 N/A 30<br />
S27°07'41"<br />
E32°34'55"<br />
1.30 Water R/S 7.5 3/4 73 N/A 75<br />
S27°08'06"<br />
Gardens,<br />
Lowmedium<br />
3.40<br />
S/G 4 2/3 85 2 140 ± 70<br />
E32°40'<br />
water<br />
70<br />
S27°06'04"<br />
E32°39'18"<br />
0.50 Water S/G 6 3/4 22 N/A 70<br />
S27°06'10"<br />
Organic<br />
0.50 Water S/G 73 1 - High 70<br />
E32°39'20"<br />
Sand<br />
S27°06'22"<br />
Organic<br />
0.20 Water S/G #388 1 - High 70<br />
E32°39'23"<br />
Sand<br />
S27°05'51"<br />
2.60 Water S/G/P 15 2/3 260 Low-high 70<br />
E32°39'43"<br />
102
Mvelabusha<br />
Noord 484<br />
Mvelabusha<br />
Noord 485<br />
Siyadla<br />
486<br />
Siyadla<br />
503<br />
Siyadla<br />
495<br />
Mvelabusha<br />
Sentr 366<br />
Mvelabusha<br />
Sentr 393<br />
Mvelabusha<br />
West 397<br />
Mvelabusha<br />
West 398<br />
Vasi-Noord<br />
425<br />
Vasi<br />
424<br />
Vasi<br />
423<br />
Vasi<br />
422<br />
S27°05'30"<br />
Gardens,<br />
0.80<br />
E32°41'50"<br />
water<br />
SF 31 2/3 207 N/A 55<br />
S27°06'58"<br />
Gardens,<br />
1.20<br />
E32°42'33"<br />
water<br />
SF #484 2/3 #484 High 55<br />
S27°07'15"<br />
Gardens,<br />
1.20<br />
E32°42'<br />
water<br />
SF 4.5 1 54 N/A 40<br />
S27°05'18"<br />
Gardens,<br />
1.00<br />
E32°44'34"<br />
water<br />
SF 63 1/2 347 N/A 35<br />
S27°07'55"<br />
Gardens,<br />
Medium-<br />
1.20<br />
SF #503 1/2 #503<br />
E32°44'07"<br />
water<br />
High<br />
35<br />
S27°07'58"<br />
Gardens,<br />
Name: Manzengwenya<br />
2.30<br />
SF 12 1 276 Low 45<br />
E32°42'05"<br />
water<br />
S27°08'52"<br />
Gardens,<br />
0.50<br />
E32°42'41"<br />
water<br />
SF 20 1 100 N/A 50<br />
S27°08'41"<br />
Organic<br />
0.80 Gardens G/S 12 1 96 N/A 45<br />
E32°43'23"<br />
Sand<br />
S27°09'32"<br />
Gardens,<br />
1.20<br />
E32°43'20"<br />
water<br />
SF 6 1 72 N/A 50<br />
S27°10'35"<br />
Plantation<br />
3.40<br />
E32°42'59"<br />
G/S 4.9 2/3 111 Low 55<br />
S27°11'22"<br />
Plantation<br />
SF?<br />
high<br />
G/S<br />
Medium-<br />
3.40<br />
#422 2/3 #422<br />
E32°42'05"<br />
55<br />
S27°11'22"<br />
Planta- G/S<br />
Ash: see<br />
1.50<br />
#422 2/3 #422 # 424-1 55<br />
E32°42'15"<br />
tion<br />
424-3<br />
S27°11'22"<br />
Planta-<br />
Mediumhigh<br />
2.50<br />
G/S 210 2/3 3 453<br />
55<br />
E32°42'20"<br />
tion<br />
Vasi S27°11'56" 3.80 Gardens, G/S/R #422 2/3 #422 # 424-1 55 Ash: see<br />
103
1231 E32°41'51" water SF? 424-1<br />
S27°14'33"<br />
Gardens,<br />
0.60<br />
E32°41'01"<br />
water<br />
SF #637 1/2 #637 High 35<br />
S27°27'45"<br />
Gardens,<br />
0.50<br />
E32°24'50"<br />
water<br />
R/S - - - High 50 Organic sand<br />
S27°34'15"<br />
Gardens,<br />
Organic<br />
0.85<br />
R/S 240 2/3 1 360 High 20<br />
E32°24'37"<br />
Biomass<br />
Sand<br />
S27°07'40"<br />
E32°34'58"<br />
1.30 Gardens G 70<br />
KuMzingwane<br />
446<br />
Tsongwe-<br />
Muzi 1676<br />
Muzi-Suid<br />
1275<br />
SILEZA<br />
Sileza<br />
461<br />
Sileza<br />
554<br />
Sileza<br />
555<br />
TEMBE<br />
ELEPHANT<br />
PARK<br />
Muzi-Wes<br />
79<br />
Muzi-Wes<br />
76<br />
Muzi-Wes<br />
117<br />
Muzi-Wes<br />
118<br />
S27°07'43"<br />
Conservation<br />
3.00<br />
E32°36'<br />
G/S 7.5 3/4 169 N/A 70<br />
S27°08'50"<br />
Conservation<br />
0.50<br />
E32°35'55"<br />
G/S - - - N/A 70 Organic Sand<br />
Biomass,<br />
S26°53'07"<br />
Mediumhigh<br />
3.10 Conservation<br />
R/S 18 2/3 372<br />
E32°35'<br />
35<br />
S26°54'35"<br />
E32°33'15"<br />
2.00 Biomass R/S 82.5 2/3 110 High 35<br />
S26°58'25"<br />
2.80 Biomass R/S 106 2/3 1979 Medium 30<br />
E32°30'47"<br />
S26°59'59"<br />
Ash: see<br />
3.50 Biomass R/S 80 2/3 1867 N/A 30<br />
E32°30'08"<br />
# 117<br />
Muzi-Wes S27°01' 1.85 Biomass R/S 18 2/3 153 High 50<br />
104
116 E32°29'57"<br />
MUZI-WES<br />
TOTAL<br />
4 481<br />
MAPUTA<br />
LAND<br />
COASTAL<br />
RESERVE<br />
KuKalwe<br />
317<br />
KuKalwe<br />
318<br />
Ngweve<br />
319<br />
Kosibaai<br />
288<br />
Kosibaai<br />
289<br />
Kosibaai<br />
287<br />
Mtando<br />
321<br />
Apiesdraai<br />
462<br />
Matitimane<br />
244<br />
S26°52'45"<br />
Gardens,<br />
Low-<br />
3.60<br />
SF 11 1/2 217<br />
E32°50'30"<br />
water,<br />
medium<br />
5<br />
S26°53'19"<br />
Gardens,<br />
4.30<br />
E32°50'33"<br />
water<br />
SF #317 1/2 #317 4 640 ± 60 Medium 5<br />
S26°53'<br />
Gardens,<br />
4.70<br />
E32°51'23"<br />
water<br />
SF? 3 1/2 70 High 10<br />
S26°53'25"<br />
Conservation<br />
0.50<br />
E32°51'53"<br />
SF - - - High 15 Organic Sand<br />
S26°52'30"<br />
Conservation<br />
1.50<br />
E32°52'40"<br />
R/S 7 1/2 52 N/A 15<br />
S26°53'50"<br />
Conservation<br />
0.50<br />
E32°51'50"<br />
S/G - - - High 15 Organic Sand<br />
S26°56'48"<br />
Conservation<br />
0.50<br />
E32°50'23"<br />
SF 8 1 40 N/A 10<br />
S26°57'13"<br />
1.00 Water SF 4 3/4 30 High 20<br />
E32°49'45"<br />
S26°57'10"<br />
Gardens,<br />
6.10<br />
SF 26 2/3 832 N/A 15<br />
E32°48'56"<br />
Water<br />
Matitimane S26°57'30" 3.50 Gardens, SF #244 3/4 #244 N/A 15<br />
105
233 E32°49'00" Water<br />
Swamanzitrib.228<br />
Swamanzitrib.236<br />
Swamanzitrib.240<br />
Swamanzi<br />
241<br />
Raffia Woud<br />
327<br />
Emyutshini-O<br />
332<br />
Emyutshini-W<br />
331<br />
KuShengeza<br />
518<br />
KuShengeza<br />
521<br />
Siyadla<br />
522<br />
Umphimbini-<br />
N.wes 590<br />
Umphimbiniwes<br />
589<br />
Umphimbini<br />
562<br />
S26°57'35"<br />
Gardens,<br />
0.40<br />
E32°47'55"<br />
Water<br />
S26°57'48"<br />
Conservation<br />
3.25<br />
E32°48'<br />
S26°58'03"<br />
Conservation<br />
1.50<br />
E32°48'05"<br />
S26°58'10"<br />
Conservation<br />
1.65<br />
E32°48'10"<br />
S27°00'10"<br />
1.30 Biomass<br />
E32°48'40"<br />
S27°00'44"<br />
Gardens,<br />
4.90<br />
E32°47'25"<br />
water<br />
S27°00'49"<br />
Gardens,<br />
1.50<br />
E32°47'19"<br />
water<br />
S27°01'25"<br />
Gardens,<br />
0.90<br />
E32°47'<br />
water<br />
S27°03'07"<br />
Gardens,<br />
1.10<br />
E32°46'54"<br />
water<br />
S27°04'53"<br />
Conservation<br />
0.65<br />
E32°47'12"<br />
S27°04'43"<br />
Conservation<br />
2.50<br />
E32°48'15"<br />
S27°05'10"<br />
Gardens,<br />
0.70<br />
E32°48'5"<br />
water<br />
S27°04'42"<br />
Conservation<br />
0.70<br />
E32°48'28"<br />
SF #240 1/2 #240 N/A 15<br />
SF #240 1/2 #240 N/A 15<br />
SF 5 1/2 43 N/A 15<br />
SF 3.5 2/3 38 N/A 15<br />
Raffia<br />
Palms<br />
20 3/4 195 Low 5<br />
SF 12 2/3 392 Medium 15<br />
S/G 2 3/4 23 N/A 30<br />
R/S 8 3/4 54 Medium 30<br />
S/G 8 3/4 66 High 30<br />
SF 3.5 2/3 15<br />
Medium-<br />
High<br />
15<br />
R/S 1 3/4 19 N/A 15<br />
S/G - - - High 15<br />
R/S 5 1/2 17 High 15<br />
Organic<br />
Sand<br />
106
S27°04'55"<br />
Conservation<br />
1.00<br />
E32°48'27"<br />
R/S #562 2/3 #562 Medium 15<br />
S27°05'37"<br />
Conservation<br />
1.70<br />
E32°48'30"<br />
R/S 0.3 2/3 5 N/A 15<br />
S27°05'47"<br />
Conservation<br />
0.80<br />
E32°48'30"<br />
R/S #562 2/3 #562 High 15<br />
S27°05'50"<br />
Gardens,<br />
0.90<br />
E32°48'29"<br />
water<br />
R/S #562 2/3 #562 High 15<br />
S27°06'45"<br />
Conservation<br />
1.20<br />
E32°48'05"<br />
R/S 0.25 1/2 2 N/A 15<br />
S27°04'20"<br />
Conser-<br />
0.25<br />
E32°45'15"<br />
vation<br />
R/S 15<br />
24<br />
Umphi.<br />
561<br />
Umphi.<br />
559<br />
Umphi.<br />
560<br />
Umphi.<br />
557<br />
Umphi.<br />
556<br />
Umphi.<br />
591<br />
UMPHIMBI-<br />
NI TOTAL<br />
Umphimbini<br />
S.Oos 588<br />
Usilahla<br />
592<br />
Usilahla<br />
593<br />
Nlangu Mire<br />
Complex-<br />
NMC:<br />
583<br />
NMC:<br />
587<br />
S27°06'16"<br />
Conservation<br />
3.50<br />
E32°48'20"<br />
R/S 8 2/3 187 N/A 15<br />
S27°04'47"<br />
E32°48'56"<br />
2.00 Gardens S/G 2 3/4 30 High 10<br />
S27°04'55"<br />
Gardens,<br />
Low-<br />
5.30<br />
S/G 3 1/2 79<br />
E32°49'33"<br />
water<br />
high<br />
10<br />
S27°05'40"<br />
Conservation<br />
6.30+<br />
E32°49'12"<br />
R/S 15 2/3 630 N/A 15<br />
S27°05'50"<br />
Conservation<br />
5.20<br />
E32°48'46"<br />
R/S 2.5 1/2 65 Medium 15<br />
NMC: S27°06' 2.70 Conser- R/S 6 2/3 108 Medium 15<br />
Organic<br />
Sand<br />
Organic<br />
Sand<br />
107
584 E32°49' vation<br />
NMC:<br />
581<br />
NMC:<br />
586<br />
NMC:<br />
579<br />
NMC:<br />
578<br />
NMC:<br />
577<br />
NMC:<br />
Nhlangu 575<br />
NMC<br />
TOTAL<br />
KuWzndini<br />
526<br />
Ngxabano-<br />
Noord 537<br />
Ngxabano-<br />
Suid 536<br />
Sibayi<br />
Mabibi<br />
648<br />
Mabibi<br />
656<br />
S27°05'55"<br />
Conservation<br />
2.35<br />
E32°49'24"<br />
R/S 7 1/2 82 Medium 15<br />
S27°06'10"<br />
Conservation<br />
1.00<br />
E32°49'32"<br />
R/S 1.5 2/3 10 N/A 15<br />
S27°06'20"<br />
Conservation<br />
4.20<br />
E32°49'34"<br />
R/S 2 2/3 57 Medium 15<br />
S27°06'22"<br />
Conservation<br />
1.50<br />
E32°49'40"<br />
R/S 4 2/3 40 N/A 15<br />
S27°06'35"<br />
Conservation<br />
6.25<br />
E32°49'32"<br />
R/S 16 1/2 500 N/A 15<br />
Biomass,<br />
S27°06'40"<br />
Mediumhigh<br />
8.65+ Conservation<br />
R/S 40 1/2 1 730 7 000 ± 80<br />
E32°49'05"<br />
15<br />
3 222<br />
S27°07'35"<br />
Gardens, R/S<br />
Lowmedium<br />
2.80<br />
16 2/3 299<br />
E32°47'<br />
water SF<br />
15 Clayey?<br />
S27°09'15"<br />
2.40 Water S/G 8 1/2 96 N/A 30<br />
E32°47'15"<br />
S27°10'<br />
Gardens,<br />
1.70<br />
S/G 8.5 2/3 96 N/A 30<br />
E32°46'38"<br />
Water<br />
S27°19'16"<br />
Mediumhigh<br />
3.20 Gardens S/P 15 2/3 320<br />
15<br />
E32°43'43"<br />
S27°19'14"<br />
Gardens,<br />
Organic<br />
1.00<br />
R/S 36 3/4 270 High 15<br />
E32°44'05"<br />
water<br />
Sand<br />
108
S27°18'50"<br />
Gardens,<br />
1.90<br />
E32°43'55"<br />
water<br />
S/G 2 2/3 25 N/A 15<br />
S27°18'15"<br />
Conservation<br />
0.90<br />
E32°44'30"<br />
S/G 2.5 2/3 15 N/A 10<br />
S27°18'55"<br />
Conservation<br />
0.50<br />
E32°42'<br />
S/P 5 3/4 19 N/A 30<br />
S27°18'40"<br />
Conservation<br />
0.60<br />
E32°42'30"<br />
S/G 0.25 3/4 1 N/A 30<br />
S27°18'40"<br />
R/S/P<br />
2.50 Gardens<br />
E32°42'20"<br />
SF<br />
6 2/3 100 High 30<br />
Mabibi<br />
651<br />
Mabibi<br />
653<br />
Mabibi-wes<br />
643<br />
Mab-w.<br />
644<br />
Mab-w.<br />
642<br />
Mab-w. 641<br />
KwaMjiji<br />
639<br />
KwaMji.<br />
638<br />
KwaMji.<br />
636<br />
KuMzingwane<br />
637<br />
KwaNsukumbili<br />
635<br />
KwaNsu.<br />
713<br />
KwaNsu.<br />
634<br />
S27°18'05"<br />
Gardens,<br />
1.40<br />
E32°42'<br />
Water<br />
S/G 1.3 1/2 87 N/A 35<br />
S27°17'10"<br />
E32°41'05"<br />
0.80 Gardens R/S 1 3/4 6 N/A 20<br />
S27°16'30"<br />
E32°41'08"<br />
1.60 Gardens R/S/P 8 1/2 64 High 20<br />
S27°15'35"<br />
E32°41'50"<br />
1.00 Gardens R/S 13 2/3 87 N/A 40<br />
S27°16'05"<br />
Gardens,<br />
2.50<br />
E32°40'55"<br />
water<br />
SF 46 1/2 575 N/A 35<br />
S27°16'27"<br />
Garden, R/S/P<br />
1.60<br />
10 2/3 107 High 20<br />
E32°40'48"<br />
water SF<br />
S27°16'27"<br />
Conservation<br />
1.80<br />
P/B 1.5 2/3 18 N/A 15<br />
E32°40'48"<br />
S27°16'20"<br />
R/S/P<br />
2.90 Gardens<br />
10 2/3 193 High 15<br />
E32°40'03"<br />
SF<br />
Velindlovu S27°16'05" 5.30 Gardens P 45 1/2 1 192 2 820 ± 45 High 20<br />
109
628 E32°39'05"<br />
KwaSonto<br />
624<br />
S27°16'15"<br />
E32°38'40"<br />
KwaSonto S27°17'20"<br />
629 E32°38'58"<br />
KwaSonto S27°17'50"<br />
712 E32°39'30"<br />
KwaSonto S27°19'20"<br />
617 E32°38'40"<br />
KwaSonto S27°18'05"<br />
612 E32°37'35"<br />
KwaSonto S27°19'08"<br />
711 E32°37'<br />
KwaSonto S27°19'02"<br />
611 E32°36'04"<br />
KwaSonto S27°19'13"<br />
600 E32°35'38"<br />
Mseleni S27°20'45"<br />
599 E32°34'05"<br />
Mseleni S27°20'47"<br />
597 E32°33'50"<br />
Mseleni S27°21'06"<br />
Sib-34 E32°32'50"<br />
Mseleni S27°22'<br />
709 E32°34'04"<br />
Mseleni S27°21'42"<br />
708 E32°34'30"<br />
0.70<br />
Gardens,<br />
Organic<br />
R/S 3.5 2/3 16 High 30<br />
water<br />
Sand<br />
1.00<br />
Conservation<br />
P 3 3/4 22 N/A 30<br />
2.00<br />
Conservation<br />
P 3 2/3 40 High 20 Clayey<br />
1.20<br />
Conservation<br />
Sand<br />
Organic<br />
P 1.5 2/3 12 High 30<br />
2.70 Gardens P/R/S 30 1/2 405 High 30<br />
2.15<br />
Conservation<br />
B 2 2/3 29 High 20<br />
0.90<br />
Gardens,<br />
water<br />
B/S/P 10 1/2 45 N/A 30<br />
2.60 Gardens<br />
R/B<br />
SF<br />
30 1/2 390 High 30<br />
2.20 Garden R/S 10 2/3 147 High 20<br />
2.10 Gardens<br />
P/R<br />
SF<br />
10 1/2 105 N/A 35<br />
1.50<br />
Gardens, SF,<br />
water P/R/S<br />
100 3/4 1 125 770 ± 50 High 15<br />
0.60<br />
Conservation<br />
Sand<br />
Organic<br />
B - - - High 30<br />
1.00<br />
Conservation<br />
S/B/P 2.5 3/4 19 N/A 20<br />
110
Mseleni<br />
710<br />
Mseleni<br />
707<br />
KwaMboma<br />
706<br />
KwaMboma<br />
705<br />
KwaMboma<br />
Sib-46<br />
KwaMboma<br />
702<br />
KwaMboma<br />
701<br />
Mpini<br />
Sib-51<br />
KuSibayi<br />
714<br />
KuSibayi<br />
Sib-53<br />
KuSibayi<br />
Sib-55<br />
KuSibayi<br />
Sib-56<br />
KuSibayi<br />
Sib-59<br />
S27°21'30"<br />
Conservation<br />
0.50<br />
E32°35'<br />
S/G - - - High 20<br />
S27°21'50"<br />
E32°35'10"<br />
4.50 Gardens P/R/S 2.5 1/2 56 High 20<br />
S27°21'30"<br />
Conservation<br />
1.20<br />
E32°36'35"<br />
S/B/P 3 2/3 24 N/A 20<br />
S27°21'20"<br />
Conservation<br />
B<br />
R/P/S/<br />
0.80<br />
E32°36'50"<br />
4 3/4 24 N/A 20<br />
S27°22'30"<br />
Conservation<br />
5.50<br />
E32°37'30"<br />
P/R/S 15 1/2 412 4 120 ± 60 High 25<br />
S27°22'20"<br />
Conservation<br />
2.45<br />
E32°38'49"<br />
P 7.5 2/3 122 N/A 20<br />
S27°22'15"<br />
Conservation<br />
0.50<br />
E32°39'30"<br />
P - - - High 15<br />
S27°24'05"<br />
Conservation<br />
1.20<br />
E32°39'05"<br />
SF 20 2/3 160 High 25<br />
S27°23'07"<br />
Conservation<br />
High<br />
Medium-<br />
4.20<br />
P 4 2/3 112<br />
E32°40'09"<br />
15<br />
S27°23'56"<br />
Conservation<br />
0.50<br />
E32°40'45"<br />
R/S 1 3/4 4 Medium 15<br />
S27°23'55"<br />
Conser-<br />
1.00<br />
E32°41'05"<br />
vation<br />
20<br />
S27°23'48"<br />
Conservation<br />
1.80<br />
E32°41'20"<br />
P/S 7 2/3 84 High 15<br />
S27°25'14"<br />
Gardens, P/R/S<br />
1.40<br />
E32°41'05"<br />
water<br />
5 2/3 47 # Sib-60 20<br />
KuSibayi S27°25'25" 1.00 Gardens P/R/S 4 2/3 27 High 20<br />
Organic<br />
Sand<br />
Organic<br />
Sand<br />
Ash:<br />
# Sib 60<br />
111
Sib-60<br />
E32°41'02"<br />
Shazibe<br />
Sib-67<br />
S27°29'08"<br />
E32°40'08"<br />
1.60 Water R/S 1 2/3 11 High 15<br />
Shazibe<br />
Sib-68<br />
S27°29'30"<br />
E32°40'04"<br />
1.20 Gardens P/R/S 10 2/3 80 Medium 15<br />
Shazibe<br />
805<br />
S27°30'48"<br />
E32°39'50"<br />
2.85 Water SF 150 1/3 1 425 Low 15<br />
Siphudwini<br />
1008<br />
S27°30'59"<br />
E32°38'00"<br />
0.70 Gardens S/R #1008 1/2 #1008 High 15<br />
Organic<br />
Sand<br />
Siphudwini<br />
1010<br />
S27°32'08"<br />
E32°37'31"<br />
1.60<br />
SF/S/<br />
V/P<br />
37.5 1/2 412<br />
Conservation<br />
Lowmedium<br />
15<br />
Siphudwini<br />
1011<br />
S27°32'03"<br />
E32°37'38"<br />
3.25 Gardens SF #1008 1/2 #1008 Low 15<br />
Siphudwini<br />
1012<br />
S27°31'51"<br />
E32°38'22"<br />
2.10 Gardens SF #1008 1/2 #1008<br />
Mediumhigh<br />
15<br />
GREATER<br />
ST LUCIA<br />
WETLAND<br />
PARK<br />
Water,<br />
Biomass<br />
Siphudwini<br />
S27°33'45"<br />
E32°38'12"<br />
2.10<br />
Conservation<br />
SF/S #1008 1/2 #1008 Medium 30<br />
749<br />
Mgobezeleni-<br />
Oos 785<br />
S27°32'25"<br />
E32°39'38"<br />
2.40 Gardens SF 16 1/2 152 1 100 ± 40<br />
Lowmedium<br />
10<br />
Mgobezeleni-<br />
Noord 801<br />
S27°31'13"<br />
E32°39'55"<br />
0.40<br />
Water,<br />
Biomass,<br />
G/S 7.5 3/4 22.5 Medium 10<br />
112
Mgobezeleni-<br />
Wes 1050<br />
Sodwana<br />
803<br />
Sodwana<br />
802<br />
Sodwana<br />
784<br />
Sodwana<br />
783<br />
Mbazwana<br />
Sib-70<br />
Mbazwana<br />
808<br />
Mbazwana<br />
816<br />
Mbazwana<br />
1044<br />
Mkuze<br />
Swamp 886<br />
Mkuze<br />
Swamp 887<br />
Mkuze<br />
Swamp 888<br />
Gardens<br />
Water,<br />
S27°32'05"<br />
1.50 Biomass,<br />
E32°38'55"<br />
Gardens<br />
G/S 37.5 1/2 281 Low 10<br />
S27°31'01"<br />
Conservation<br />
1.50<br />
E32°40'02"<br />
SF #784 2/3 784 Low 10<br />
S27°31'07"<br />
Conservation<br />
1.00<br />
E32°40'06"<br />
SF #784 2/3 #784 Medium 10<br />
S27°32'06"<br />
Conservatiomedium<br />
Low-<br />
1.85<br />
SF/S/R 70 2/3 910<br />
E32°40'15"<br />
10<br />
S27°32'35"<br />
Conservation<br />
0.70<br />
E32°40'25"<br />
SF/S/R #784 2/3 # 784 Medium 10<br />
S27°29'45"<br />
Gardens,<br />
1.35<br />
E32°34'55"<br />
water,<br />
SF 70 2/3 630 Medium 50<br />
S27°33'42"<br />
Conservation<br />
2.10<br />
E32°35'17"<br />
SF 45 2/3 630 Low 20<br />
S27°36'44"<br />
Conservation<br />
1.10<br />
E32°33'22"<br />
SF 70 2/3 513 High 15<br />
S27°34'15"<br />
E32°33'28"<br />
4.25 Gardens SF 25 1/2 531 Medium 30<br />
S27°38'01"<br />
Conservation<br />
3.00<br />
E32°32'38"<br />
R/P/S 200 3/4 4 500 Low 10<br />
S27°37'59"<br />
Conservation<br />
1.80<br />
E32°32'33"<br />
P/R/S #886 3/4 #886 # 886 10<br />
S27°37'57"<br />
Conservation<br />
2.80<br />
R/P/S #886 3/4 #886 # 886 10<br />
E32°32'33"<br />
Mkuze S27°37'58" 2.60 Conser- R/P/S #886 3/4 #886 # 886 10<br />
113
Swamp 889 E32°32'30" vation<br />
Mkuze<br />
Swamp 890<br />
Mkuze<br />
Swamp 899<br />
Mkuze<br />
Swamp 900<br />
Mkuze<br />
Swamp 901<br />
Mkuze<br />
Swamp 902<br />
Mkuze<br />
Swamp 903<br />
Mkuze<br />
Swamp 904<br />
Mkuze<br />
Swamp 905<br />
Mkuze<br />
Swamp 906<br />
Mkuze<br />
Swamp 907<br />
Mkuze<br />
Swamp 908<br />
Mkuze<br />
Swamp 989<br />
Mkuze<br />
Swamp 991<br />
R/P/V 664.5 3/4 2 940<br />
Lowmedium<br />
10<br />
R/P/V #904 3/4 #904 #904 10<br />
R/P/V #904 3/4 #904 #904 10<br />
R/P/V #904 3/4 #904 #904 10<br />
R/P/V #904 3/4 #904 #904 10<br />
P/R # 992 3/4 # 992 # 992 10<br />
P # 992 3/4 # 992 # 992 10<br />
S27°39'24"<br />
Conservation<br />
4.40<br />
E32°31'52"<br />
S27°39'23"<br />
Conservation<br />
4.60<br />
E32°31'48"<br />
S27°39'23"<br />
Conservation<br />
4.10<br />
E32°31'45"<br />
S27°39'23"<br />
Conservation<br />
3.80<br />
E32°31'43"<br />
S27°41'50"<br />
Conservation<br />
5.50<br />
E32°32'08"<br />
S27°41'50"<br />
Conservation<br />
5.50<br />
E32°32'06"<br />
R/S #886 3/4 #886 # 886 10<br />
P/S #904 3/4 #904 #904 10<br />
B/S/P #904 3/4 #904 #904 10<br />
R/P #904 3/4 #904 #904 10<br />
R/P #904 3/4 #904 #904 10<br />
R/P/V #904 3/4 #904 #904 10<br />
S27°38'02"<br />
Conservation<br />
2.20<br />
E32°32'41"<br />
S27°39'24"<br />
Conservation<br />
4.60<br />
E32°31'48"<br />
S27°39'27"<br />
Conservation<br />
0.70<br />
E32°32'08"<br />
S27°39'25"<br />
Conservation<br />
1.60<br />
E32°32'06"<br />
S27°39'25"<br />
Conservation<br />
2.00<br />
E32°32'02"<br />
S27°39'24"<br />
Conservation<br />
3.80<br />
E32°31'59"<br />
S27°39'25"<br />
Conservation<br />
5.90<br />
E32°31'56"<br />
114
Mkuze S27°41'48"<br />
Conservation<br />
540 - 740<br />
Clay<br />
5.40<br />
P/R 900 3/4 37 125 High 10<br />
Swamp 992 E32°32'05"<br />
Mkuze S27°44'45"<br />
Conservation<br />
130 - 150<br />
Clay<br />
1.30<br />
P/V #1004 3/4 #1004 #1004 10<br />
Swamp 998 E32°32'30"<br />
Mkuze S27°44'44" 1.50 Conservation<br />
150 - 350<br />
Clay<br />
P/V #1004 3/4 #1004 #1004 10<br />
Swamp 999 E32°32'26"<br />
Mkuze S27°44'42"<br />
Conservation<br />
120 - 280<br />
Clay<br />
1.20<br />
P/R/V #1004 3/4 #1004 #1004 10<br />
Swamp 1000 E32°32'22"<br />
Mkuze S27°44'41"<br />
Conservation<br />
170 - 300<br />
Clay<br />
1.70<br />
P/V #1004 3/4 #1004 #1004 10<br />
Swamp 1001 E32°32'19"<br />
Mkuze S27°44'44"<br />
Conservation<br />
170 - 300<br />
Clay<br />
1.70<br />
P/R #1004 3/4 #1004 #1004 10<br />
Swamp 1002 E32°32'15"<br />
Mkuze S27°44'42"<br />
Conservation<br />
170 - 430<br />
Clay<br />
1.70<br />
P/R #1004 3/4 #1004 #1004 10<br />
Swamp 1003 E32°32'14"<br />
Mkuze S27°44'41"<br />
Conservatiohigh<br />
210 - 440<br />
Medium-<br />
Clay<br />
2.10<br />
P 2000 3/4 31 500<br />
10<br />
Swamp 1004 E32°32'11"<br />
Mkuze S27°47'18"<br />
Conservation<br />
70 - 260<br />
Clay<br />
0.70<br />
R/P/V #1017 3/4 # 1017 # 1016 10<br />
Swamp 1014 E32°32'27"<br />
Mkuze S27°47'18" 0.70 Conservation<br />
70 - 260<br />
Clay<br />
R/V/P #1017 3/4 # 1017 # 1016 10<br />
Swamp 1015 E32°32'23"<br />
Mkuze S27°47'22"<br />
Conservation<br />
115 - 250<br />
Clay<br />
1.15<br />
R/P #1017 3/4 # 1017 Medium 10<br />
Swamp 1016 E32°32'18"<br />
Mkuze S27°47'21"<br />
Conservation<br />
S<br />
150 - 240<br />
R/P/V/<br />
Clay<br />
1.50<br />
2000 3/4 22 500 # 1016 10<br />
Swamp 1017 E32°32'10"<br />
Mkuze S27°47'22"<br />
Conservation<br />
90 - 250<br />
Clay<br />
0.90<br />
P/V/S # 1017 3/4 # 1017 # 1016 10<br />
Swamp 1018 E32°32'03"<br />
Mkuze S27°47'25" 0.70 Conser- V/P # 1017 3/4 # 1017 # 1016 10 Clay<br />
115
Swamp 1019 E32°31'56" vation 70 - 200<br />
Mkuze<br />
Swamp 1020<br />
Mkuze<br />
Swamp 1037<br />
Mkuze<br />
Swamp 1038<br />
Mkuze<br />
Swamp 1039<br />
Mkuze<br />
Swamp 1040<br />
Ozabeni<br />
729<br />
Ozabeni<br />
764<br />
Ozabeni<br />
807<br />
Ozabeni<br />
838<br />
Ozabeni<br />
844<br />
Ozabeni<br />
846<br />
Ozabeni<br />
866<br />
Ozabeni<br />
871<br />
S27°47'30"<br />
Conservation<br />
70 - 200<br />
Clay<br />
0.70<br />
R/S # 1017 3/4 # 1017 # 1016 10<br />
E32°31'45"<br />
S27°50'11"<br />
Conservation<br />
150 - 240<br />
Clay<br />
0.40<br />
P # 1038 3/4 # 1038 # 1038 10<br />
E32°30'50"<br />
S27°50'11"<br />
Conservation<br />
90 - 250<br />
Clay<br />
1.00<br />
P/S 1500 3/4 11 250 N/A 10<br />
E32°30'46"<br />
S27°50'09"<br />
Conservation<br />
60 - 100<br />
Clay<br />
0.60<br />
P/S # 1038 3/4 # 1038 N/A 10<br />
E32°30'43"<br />
S27°50'08"<br />
Conservation<br />
50 - 150<br />
Clay<br />
0.50<br />
P/S # 1038 3/4 # 1038 # 1038 10<br />
E32°30'40"<br />
S27°34'57"<br />
Conser-<br />
0.50<br />
S 0.8 40 25<br />
E32°35'53"<br />
vation<br />
S27°35'12"<br />
Conservation<br />
0.50<br />
E32°37'50"<br />
R/S 140 3/4 690 Low 30<br />
S27°33'84"<br />
Conservation<br />
0.80<br />
E32°35'48"<br />
G/S 1 3/4 6 High 25 Organic sand<br />
S27°40'55"<br />
Conservation<br />
Sand<br />
Organic<br />
0.60<br />
S 5.6 3/4 34 High 25<br />
E32°34'25"<br />
S27°39'22"<br />
Conservation<br />
1.10<br />
E32°34'24"<br />
S 9 3/4 74 High 25<br />
S27°38'49"<br />
Conservation<br />
1.30<br />
E32°34'23"<br />
S 2 3/4 20 High 25<br />
S27°36'07"<br />
Conservation<br />
1.00<br />
E32°36'03"<br />
S 1 3/4 7.5 High 25<br />
S27°37'04"<br />
Conservation<br />
0.75<br />
E32°35'43"<br />
S 1 3/4 4 Medium 25<br />
116
Ozabeni<br />
872<br />
Ozabeni<br />
880<br />
Ozabeni<br />
883<br />
Ozabeni<br />
884<br />
Bangazi-N<br />
1199<br />
Bangazi-N<br />
780<br />
Bangazi-N<br />
781<br />
Bangazi-N<br />
1201<br />
Bangazi-N<br />
1202<br />
Bangazi-N<br />
1203<br />
Bangazi-N<br />
1204<br />
Bangazi-N<br />
1205<br />
Bangazi-N<br />
1206<br />
S27°36'46"<br />
Conservation<br />
1.70<br />
E32°36'21"<br />
S 1.5 3/4 19 N/A 25<br />
S27°37'46"<br />
Conservatiohigh<br />
Medium-<br />
1.35<br />
G/S 2 2/3 18<br />
E32°33'28"<br />
10<br />
S27°38'27"<br />
Conservation<br />
0.80<br />
E32°32'48"<br />
S/SF 1.3 2/3 7 Medium 10<br />
S27°38'15"<br />
Conservation<br />
1.30<br />
E32°32'51"<br />
G/S/SF 1.2 2/3 10 High 10 Organic Sand<br />
S27°39'30"<br />
Conservatiomedium<br />
High-<br />
4.75<br />
R/S 1.5 2/3 47<br />
E32°37'38"<br />
15<br />
S27°37'55"<br />
Conservation<br />
0.80<br />
E32°37'28"<br />
S 4.5 2/3 24 High 20<br />
S27°38'05"<br />
Gardens,<br />
2.00<br />
E32°37'45"<br />
water<br />
SF 4 2/3 53 Medium 20<br />
S27°37'53"<br />
Conservation<br />
0.80<br />
E32°37'45"<br />
R/S 5 2/3 27 N/A 10<br />
S27°37'52"<br />
Conservation<br />
3.20<br />
E32°37'42"<br />
SF 3.5 2/3 84 N/A 10<br />
S27°37'49"<br />
Conservation<br />
2.30<br />
E32°37'40"<br />
SF #1202 2/3 #1202 N/A 10<br />
S27°38'42"<br />
Gardens,<br />
0.80<br />
E32°37'00"<br />
water<br />
S/R 0.5 2/3 3 N/A 15<br />
S27°38'41"<br />
Gardens,<br />
Organic<br />
2.10<br />
SF 7.5 2/3 105 High 20<br />
E32°36'55"<br />
water<br />
Sand<br />
S27°38'40"<br />
Gardens,<br />
2.40<br />
E32°37'32"<br />
water<br />
S/R 6.2 2/3 100 N/A 10<br />
Bangazi-N S27°38'54" 1.50 Gardens, S/R 7.5 2/3 75 N/A 15<br />
117
1207 E32°37'19" water<br />
Bangazi-N<br />
1208<br />
Bangazi-N<br />
1193<br />
Bangazi-N<br />
1194<br />
Bangazi-N<br />
1195<br />
Bangazi-N<br />
1196<br />
Bangazi-N<br />
1197<br />
Bangazi-N<br />
1199<br />
Manzibomvu<br />
1049<br />
Manzibomvu<br />
1055<br />
Manzibomvu<br />
1056<br />
Manzibomvu<br />
1057<br />
Manzibomvu<br />
1059<br />
Manzibomvu<br />
1060<br />
S27°38'49"<br />
Gardens,<br />
1.70<br />
E32°37'11"<br />
water<br />
S/R 0.3 2/3 3 N/A 15<br />
S27°38'52"<br />
Gardens,<br />
1.40<br />
E32°36'13"<br />
water<br />
SF 7 2/3 65 Medium 25<br />
S27°39'21"<br />
Gardens,<br />
Medium-<br />
6.20<br />
SF 10 2/3 413<br />
E32°36'42<br />
water<br />
high<br />
15<br />
S27°39'21"<br />
Gardens,<br />
3.00<br />
E32°37'03"<br />
water<br />
SF 2.5 2/3 50 N/A 15<br />
S27°39'21"<br />
Gardens,<br />
2.20<br />
E32°37'07"<br />
water<br />
SF 2.5 2/3 37 N/A 15<br />
S27°39'22"<br />
Gardens,<br />
1.20<br />
E32°37'14"<br />
water<br />
S/R 2 2/3 16 Medium 15<br />
S27°39'30"<br />
Gardens,<br />
Highmedium<br />
4.75<br />
R/S 2 2/3 63<br />
E32°37'38"<br />
water<br />
15<br />
S27°35'25"<br />
Conservation<br />
2.00<br />
E32°26'37"<br />
R/V 7.5 3/4 112 Medium 30<br />
S27°35'44"<br />
Conservation<br />
0.50<br />
E32°28'25"<br />
S #1056 2/3 #1056 High 30<br />
S27°36'21"<br />
E32°28'25"<br />
1.50 Gardens SF 12.5 2/3 125 High 30<br />
S27°36'43"<br />
E32°28'47"<br />
1.00 Gardens SF/S 12.5 2/3 83 High 25<br />
S27°36'41"<br />
Conservation<br />
0.50<br />
E32°29'42"<br />
S 7.5 2/3 38 High 25<br />
S27°37'40"<br />
Conservation<br />
2.90<br />
E32°30'37"<br />
SF/P 18.7 2/3 363 Medium 15<br />
Organic<br />
Sand<br />
Organic<br />
Sand<br />
Organic<br />
Sand<br />
118
Mdlanzi S27°38'26"<br />
Gardens,<br />
Water<br />
2.70<br />
P 150 2/3 2 700 High 15<br />
1226 E32°28'07"<br />
water<br />
0 - 200 cm<br />
Mdlanzi S27°38'25"<br />
Gardens,<br />
Water<br />
2.70<br />
P 60 2/3 1 500 N/A 15<br />
1262 E32°28'55"<br />
water<br />
0 - 200 cm<br />
Ntshangwe S27°39'12"<br />
Gardens,<br />
Organic<br />
1.00<br />
P 2.5 3/4 19 High 15<br />
1229 E32°29'20"<br />
water<br />
Sand<br />
Mbotsheni S28°01'10"<br />
Conservation<br />
Org. Sand<br />
land<br />
High<br />
Wet/peat-<br />
0.70<br />
R/S 1 3/4 5<br />
10<br />
1235 E32°31'05"<br />
Mosaic<br />
MbotsheCni<br />
Mbotsheni<br />
1238<br />
Kulaleni<br />
1166<br />
Kulaleni<br />
1168<br />
Kulaleni<br />
1169<br />
Kulaleni<br />
1170<br />
KwaDlembe<br />
1157<br />
KwaDlembe<br />
1156<br />
KwaDlembe<br />
1152<br />
S28°01'05" 1.00 Conser-<br />
1236 E32°31'20"<br />
vation<br />
S28°00'59"<br />
Conservation<br />
1.00<br />
E32°31'42"<br />
S28°02'40"<br />
Conser-<br />
1.30<br />
E32°31'15"<br />
vation<br />
S28°02'40"<br />
Conservation<br />
1.00<br />
E32°31'28"<br />
S28°02'49"<br />
Conservation<br />
0.50<br />
E32°31'47"<br />
S28°02'44"<br />
Conservation<br />
1.30<br />
E32°31'49"<br />
S28°04'23"<br />
Conservation<br />
2.25<br />
E32°31'17"<br />
S28°04'40"<br />
Conservation<br />
2.00<br />
E32°31'25"<br />
S28°05'52"<br />
Conservation<br />
1.5O<br />
E32°31'43"<br />
R/S 7.5 3/4 56 N/A 10<br />
Wet/peatland<br />
Mosaic<br />
R/S 7.5 3/4 56 High 10<br />
Wet/peatland<br />
Mosaic<br />
R/S 7.5 3/4 73 Medium 10<br />
Wet/peatland<br />
Mosaic<br />
R/S 7.5 3/4 56 N/A 10<br />
Wet/peatland<br />
Mosaic<br />
P/B/S 7.5 3/4 28<br />
High<br />
Wet/peat-<br />
10<br />
Org. Sand<br />
land Mosaic<br />
R/S 7.5 3/4 73 Medium 10<br />
Wet/peatland<br />
Mosaic<br />
R/S/P 19 2/3 281 Medium 10<br />
Wet/peatland<br />
Mosaic<br />
S/R 0.3 2/3 4 N/A 10<br />
Wet/peatland<br />
Mosaic<br />
High<br />
Wet/peat-<br />
R/S 1 3/4 11<br />
10<br />
Org. Clay<br />
land Mosaic<br />
KwaDlembe S28°06'15" 2.00 Conser- R/S 1 3/4 15 N/A 10 Wet/peat-<br />
119
1150 E32°31'42" vation land Mosaic<br />
Sabhuku<br />
1145<br />
Sabhuku<br />
1129<br />
Bangazi-S<br />
1163<br />
Mfabeni<br />
1113<br />
Mfabeni<br />
1114<br />
Mfabeni<br />
1126<br />
Mfabeni<br />
1125<br />
Mfabeni<br />
1064<br />
Mfabeni<br />
1124<br />
Mfabeni<br />
1123<br />
Nkazana<br />
1108<br />
Nkazana<br />
1066<br />
Nkazana<br />
1068<br />
S28°05'28"<br />
Conservation<br />
Sand<br />
Organic<br />
0.50<br />
SF 7.5 3/4 28 High 10<br />
E32°30'50"<br />
S28°06'39"<br />
Organic<br />
1.30 Garden SF 50 3/4 487 High 10<br />
E32°30'38"<br />
Sand<br />
S28°06'27"<br />
Conservation<br />
Sand<br />
Organic<br />
0.70<br />
R 5.6 2/3 26 High 10<br />
E32°32'27"<br />
S28°07'15"<br />
Conservation<br />
1.50<br />
E32°30'50"<br />
R/S/P 5 2/3 50 Medium 10<br />
S28°07'28"<br />
Conservation<br />
3.25<br />
E32°30'55"<br />
R/S/G 120 2/3 2 600 Medium 10<br />
S28°08'32"<br />
Conservation<br />
0.40<br />
E32°32'05"<br />
S 2.5 2/3 6 N/A 10<br />
S28°09'02"<br />
45 100 +<br />
10.00 Water G/S 700 1/2 35 000<br />
E32°31'30"<br />
4900 - 3000<br />
Low-high 10<br />
S28°10'22"<br />
Conservation<br />
2.00<br />
E32°30'35"<br />
G/S/R 100 2/3 1 333 N/A 10<br />
S28°09'10"<br />
Conservation<br />
V<br />
S/R/P/<br />
1.50<br />
E32°32'18"<br />
2 2/3 20 Medium 10<br />
S28°09'27"<br />
Conservation<br />
Sand<br />
Organic<br />
1.00<br />
S 3.5 2/3 23 High 10<br />
E32°31'54"<br />
S28°08'35"<br />
Conservation<br />
4.60<br />
E32°30'23"<br />
SF 60 2/3 1 840 N/A 10<br />
S28°10'33"<br />
Conservation<br />
4.00<br />
E32°30'02"<br />
SF 160 2/3 4 266 Low-high 10<br />
S28°11'22"<br />
Conservation<br />
Organic<br />
0.50<br />
S 12.5 2/3 41 High 10<br />
E32°29'39"<br />
Sand<br />
120
Nkazana-east<br />
964<br />
S28°12'55"<br />
E32°29'20"<br />
2.40<br />
Conservation<br />
SF 8 2/3 128 High 10<br />
St. Lucia<br />
798<br />
S28°18'25"<br />
E32°26'55"<br />
1.90<br />
Conserv/<br />
plantat.<br />
S 0.6 3/4 5 High 15<br />
St. Lucia<br />
789<br />
S28°19'10"<br />
E32°25'48"<br />
1.20<br />
Conserv/<br />
plantat.<br />
S 8 2/3 101 High 10<br />
St. Lucia<br />
928<br />
S28°21'40"<br />
E32°25'50"<br />
0.40<br />
Conservation<br />
S 1 3/4 3 N/A 10<br />
St. Lucia<br />
1179<br />
S28°21'04"<br />
E32°25'11"<br />
0.50<br />
Conservation<br />
S 1 3/4 4 High 10<br />
Organic<br />
Sand<br />
St. Lucia<br />
1122<br />
E28°22'55<br />
S32°24'50"<br />
0.70<br />
Conservation<br />
SF 3.7 2/3 17 N/A 10<br />
St. Lucia<br />
S28°22'35"<br />
E32°35'30"<br />
5.00<br />
Clay<br />
Conservation<br />
R 10 Clay<br />
St. Lucia<br />
933<br />
S28°23'01"<br />
E32°24'49"<br />
1.80<br />
Conservation<br />
R/S/P 10 2/3 120 High 10<br />
Futululu<br />
1250<br />
S28°23'50"<br />
E32°16'21"<br />
4.75<br />
Conservation<br />
P #1251 1/2 #1251<br />
Mediumhigh<br />
15<br />
Futululu<br />
1251<br />
S28°24'28"<br />
E32°15'55"<br />
6.50<br />
Conservation<br />
P 9 1/2 437 N/A 15<br />
Dukuduku<br />
1182<br />
S28°22'35"<br />
E32°22'22"<br />
1.00<br />
Conservation<br />
SF 5 2/3 33 N/A 30<br />
Nyalazi<br />
959<br />
S28°14'33"<br />
E32°22'52"<br />
1.00<br />
Plantation<br />
SF 3 2/3 20 High 40<br />
Organic<br />
Sand<br />
121
4.6.2 Result maps<br />
Figure 33: LANDSAT 7 ETM+ true colour composite image of study area<br />
122
Figure 34. Distribution of pristine and disturbed Swamp Forest on the northern South African<br />
coastal plain<br />
123
Figure 35. Distribution of pristine and disturbed swamp forest on the southern Mozambique<br />
coastal plain<br />
124
Figure 36: Comparison of swamp forest distribution at the Manzengwenya Forest, South<br />
Africa<br />
125
Figure 37: Comparison of swamp forest distribution at the Malangeni Forest, South Africa<br />
126
5 Socio-economic background and current utilization of the Kosi Bay<br />
swamp forests (DK, JN)<br />
5.1 Socio-economic background<br />
5.1.1 A brief history the Kosi Bay area and utilization of its swamp forests<br />
The Kosi Bay system is likely to have been subject to a long history of human use. Some of the<br />
earliest and most accurate records of Stone Age Homo sapiens in Africa dating 100 000 years B.P.<br />
have been obtained from Border Cave which is located approximately 75 kilometres west of the Kosi<br />
Lake System. These people led a hunter-gatherer existence. More recent inhabitants moved into the<br />
area from further north in Africa during the Iron Age, and records exist of Iron Age settlements in<br />
Maputaland from around 400 AD, with evidence suggesting that slash and burn agriculture was<br />
practiced by these communities. When the first Europeans observed northern Maputaland in the 16 th<br />
centaury it was inhabited by the Thonga people, who practiced widely slash and burn agriculture as<br />
well as relying on the area’s abundant natural resources, notably fish. More recently there has been a<br />
movement into the area of Zulu speaking people and their influence. Today, while the home tongue of<br />
some of the oldest residents is Thonga, for most people it is Zulu.<br />
Although the Kosi Bay Lakes have had semi protected status through government departments from<br />
the early 1950s, firstly through the Department of Forestry, followed by the Natal Parks Board and<br />
then by the KwaZulu Bureau of Natural Resources (KBNR) in 1982, the area remained under the<br />
primary control of local people (Davion 1995). The key structure through which local control was (and<br />
continues to be) exercised is the Tembe Tribal Authority, which is headed by a chief or Inkosi, as well<br />
as by his tribal councillors and Indunas. The Tribal Authority controlled the allocation of land, fish<br />
trap sites and the basic way of life. The local people have for so long occupied Kosi Bay that they<br />
experienced a wholesome people-environment balance through their ecologically-sound, traditional<br />
harvesting practices (Kyle 1987). Kyle (1995) notes that even though people had lived around the<br />
lakes for hundreds of years in relatively high densities (as described by Felgate: 1964) the system was<br />
found by Begg (1978) to be one of the least spoilt in KwaZulu-Natal, and continued to supply<br />
abundant fish and plant resources.<br />
However, from the early 1980s, forces threatening this sound relationship between people and their<br />
natural environment became apparent. Foremost amongst these forces was the rapid population<br />
increase, fuelled, in part, by movement of refugees from southern Mozambique following the outbreak<br />
of the civil war in that country in 1975. Over a 13 year period from 1975 to 1988, the Kosi Bay<br />
population increased by 33% (Davion 1995). Increasingly, the swamp forests (considered as pristine<br />
and environmentally sensitive), which fed into the Kosi Bay lakes, were being destroyed by local<br />
people cultivating bananas and other cash crops in the swamp forests. Conservation officials viewed<br />
this destruction with concern as posing a threat not only to the swamp forests but also to the overall<br />
Kosi Bay lake system, and calls were made for the formal protection of the Kosi Bay swamp forests<br />
(Zakrzewski 1988; Davion 1995).<br />
This ultimately led to the Kosi Bay Nature Reserve being proclaimed by the KwaZulu government in<br />
August 1988. This reserve is calculated to be approximately 11 000 hectares and includes almost all of<br />
127
the Kosi Lake system and the Malangeni Swamp Forest. Following this proclamation, cultivation<br />
within the reserve boundaries was forbidden and people were required to relocate to areas outside the<br />
reserve (AFRA 1990; Davion 1995).<br />
In the initial stages of the proclamation of the nature reserve, the exact amount and type of land that<br />
was demarcated for conservation was not clear to all affected parties, and some locals were not<br />
informed about important decisions such as erecting of game fences in areas of the reserve or the<br />
removal of certain crops within the reserve (AFRA 1990). Aggravating the situation further was the<br />
fact that some of the Indunas refused from the outset to co-operate with the KBNR. The end result,<br />
therefore, was that the proclamation of the Kosi Bay reserve was largely a top-down process and<br />
grassroots input was limited (AFRA 1990; Davion 1995). The proclamation of the reserve culminated<br />
in the removal of locals within the demarcated boundaries. As a result, a Compensation Committee<br />
established around 1989, extended services to try and ensure that people affected by the proclamation<br />
of the Greater Kosi Bay Nature Reserve would be compensated. This committee was represented by<br />
officials of the justice department, KBNR members and several members of the Tembe Tribal<br />
Authority (AFRA 1990).<br />
During the late 1980’s the KBNR estimated that there were approximately 158 homesteads (housing<br />
an average population of 5 person’s per household) that were being affected. Some of these occupant<br />
homesteads voluntarily moved out. Such movement was, to some extent, encouraged by rumours that<br />
the government would be forcibly removing them at a future unspecified date. This movement resulted<br />
in a disruption of the community’s organizational structure, and a feeling of living in an unstable<br />
environment (AFRA 1990; Davion 1995). The people of Kosi Bay were offered compensation in three<br />
forms:<br />
?? Payment for the value of buildings, fruit trees, fields.<br />
?? A relocation allowance for each family.<br />
?? Transport services for relocation were provided free of charge.<br />
Although such compensation seemed to be adequate for some, many of the locals refused such offers,<br />
saying that they did not want the bureau’s compensation and that all they wanted was land (AFRA<br />
1990; Zakrzewski 1988).<br />
The Compensation Committee was seen as a positive tool by the KBNR, as they were responsible for<br />
encouraging relocation and helping those ‘affected’, with the transition to conservation. However, the<br />
removal of people has a serious impact on land and the current flow of benefits, in that people that are<br />
removed from an area ultimately occupy another area that has already been inhabited. This has<br />
resulted in the environment outside the Reserve being placed under greater pressure from activities<br />
such as grazing and cultivation. Locals were angered at the fact that when they lived within the reserve<br />
they were able to cultivate their fields and earn a lot of money from their crops; however, as a result of<br />
relocation their earnings have now become minimal (AFRA 1990; Davion 1995). Presently,<br />
approximately 1 000 people still remain living in the Reserve, on the eastern side of the Kosi Lakes.<br />
The tensions and conflicts created by apartheid and the struggles against this system inevitably<br />
affected natural resource conservation efforts on the ground. This has been all too true in the case of<br />
Kosi Bay.<br />
128
AFRA (1990) and Zakrzewski (1988) draw attention to the tensions that existed between the KwaZulu<br />
government and the Tembe Tribal Authority even before the KBNR was formed. Under the apartheid<br />
system, the KBNR existed as the nature conservation arm of the KwaZulu government, and so by<br />
association they were “off to a bad start”.<br />
With the dismantling of apartheid and the merging of KwaZulu with the rest of Natal, the KBNR<br />
merged with the Natal Parks Board, which had previously been responsible for nature conservation in<br />
those areas of Natal outside of KwaZulu. The merger took several years to complete, with the new<br />
organization initially known as KZN Nature Conservation Services (NCS) then changing its name to<br />
Ezemvelo KZN Wildlife. Despite all these changes, many local people still see the nature conservation<br />
authority in the same generally negative light as before. Overall, the issues surrounding conservation,<br />
conflict and local development remain much the same as they did a decade or so ago (Ridl 2003 Pers<br />
comm. School of Law, University of Natal, Durban).<br />
The local communities at Kosi Bay have erected tourist amenities within the Reserve, which the<br />
government sees as illegal, but to the local communities it is a source of income and survival<br />
(Herringto 2003). To quote again Dr. Scotty from the 2003 50/50 TV programme:<br />
“…on the spectacular Kwa Dapha/ Banga Nek Peninsular between Third Lake and the sea, land is<br />
being cleared at an alarming rate. Members of the community who want to get involved in tourism are<br />
taking the initiative by staking their claims with the local chief before the big investors move in. In the<br />
absence of Environmental Impact Assessments or EIA’s, many illegal developments are also shooting<br />
up as word gets around that this will reinforce their land claims, much to the alarm of KZN<br />
Wildlife…”<br />
Regarding control of swamp forest cultivation in the Reserve, this has been aggravated by the fact that<br />
enforcement has not been consistent. There have been times (particularly during a period after the<br />
1994 elections) when no actions have been taken against people illegally cultivating in the Reserve<br />
and then other times, such as recently, where several people have been arrested and prosecuted for<br />
illegally cultivating in the Reserve. This is likely to lead to even greater resentment than if regulations<br />
were strictly and consistently enforced.<br />
During 2003, there was a march by the locals on the offices of Ezemvelo KZN Wildlife in order to<br />
have their message heard that Nature Conservation and the community are not working coherently. Or<br />
in other words, these people feel that Nature Conservation Authorities are not consulting with them<br />
and as a result the communities want the park authorities to ‘leave their land’. The problem at Kosi<br />
Bay has become so drastic that not only have the locals engaged in protesting, but these people have<br />
resorted to removing fences on the border of the park as well as going within the reserve and chopping<br />
down clumps of swamp forest, they have also threatened and intimidated park staff (Herrington 2003).<br />
Their grievances stem partly from poverty, along with employment expectations that have not been<br />
fulfilled and which were promised through much talked about tourism developments. To quote Dr.<br />
Scotty Kyle (employee of Ezemvelo KZN Wildlife) during a recent 50/50 television broadcast (see<br />
Herrington 2003):<br />
129
“Expectations have been raised in the past few years that tourism/ conservation can bring in a lot of<br />
employment and benefits to the region, but the reality is, that probably, the ecotourism employment<br />
potential of this area is so low, it’s really got no chance of saturating the local market for employment.<br />
We need some alternative outside that can sap up those thousands of people who are hungry, who<br />
need food.”<br />
It is quite evident that they are also frustrated with restrictions placed on them in the interests of<br />
conservation on what they claim is their own land. What it essentially reveals is that these<br />
communities feel that they are getting an inferior deal and the park authorities are taking advantage of<br />
them especially because a great proportion of them are illiterate and uneducated. They feel that they<br />
have a right to utilize ‘their’ land to its full potential and that dealing with the issue of poverty is more<br />
important than that of conservation. So, ultimately, one can say that, what went wrong in Kosi Bay,<br />
was a result of a lack of communication between the development and conservation enterprises with<br />
the Kosi Bay communities (Herrington 2003). To quote again Dr. Scotty from the same 50/50<br />
programme:<br />
“There’s a very difficult problem in the area just now, highlighted by that march a couple of weeks<br />
ago and we obviously need to address serious communication problems, because there’s a lot of<br />
people here who don’t understand what we’re trying to do in this area. What we are paid by the<br />
government to do in this area.”<br />
The complexity of the situation is revealed further in the words of Paul Ngubane, one of the leaders of<br />
the recently held march where written demands were presented to Ezemvelo KZN Wildlife:<br />
“The NCS (Ezemvelo KZN Wildlife) and the march committee kick-started negotiation process,<br />
immediately after the march hence the involvement of the Tembe Tribal Authority and the Greater St<br />
Lucia Wetlands Park Authority. Accordingly certain agreements were reached albeit eclipsed by the<br />
lack of a strategic approach to the resolution of the conflict, from all parties. The negotiations<br />
breakdown was a result of that condition. The parties deadlocked on the technical process, which was<br />
essentially, the refusal by the Government bodies to respond to the committee’s demands in writing<br />
and insisting on talks. The deadlock demonstrated a high degree of lack of confidence of the parties.<br />
The committee regarded the Tribal Authority as an obstacle precisely because of the lack of<br />
confidence and because of its ambiguity on the conservation conflict” (Ngubane 2003).<br />
Clearly, there is dire need for a commonly agreed upon process and structure for resolving the<br />
conflicts and organizational difficulties that exist both between community structures and conservation<br />
bodies as well as within the respective structures themselves. In the Kosi Bay community, for<br />
example, there are different factions, which make finding a common solution more difficult (James<br />
2003. Pers. comm. Greater St Lucia Wetland Park Authority, St Lucia). Without an agreed upon<br />
process and structure from which to work, exercising control over resource use is going to become<br />
increasingly difficult.<br />
130
5.1.2 The socio-economic status of the Kosi Bay Area<br />
Background<br />
The former homeland of KwaZulu is divided into 26 magisterial districts. These districts are further<br />
disaggregated into a number of wards. The Kosi Bay Nature Reserve is located in the Tembe ward,<br />
which is recognized as one of the largest wards in KwaZulu Natal (Davion 1995).<br />
In the early 19 th century many South Africans saw Kosi Bay and surrounding areas as one of the<br />
wealthiest regions in the country. This wealth was seen with regard to natural resources and aesthetic<br />
beauty, despite the fact that it was considered an area of underdevelopment. However, during the 20 th<br />
century, the region’s socio-economic status seemed to have declined dramatically, resulting in parts of<br />
Maputaland being considered as areas of socio-economic crisis. This was due to harsh environmental<br />
conditions and natural disasters in the form of droughts and floods as well as the additional process of<br />
underdevelopment (AFRA 1990).<br />
In the past, migration of locals out of the Kosi Bay area brought with it many negative social and<br />
economic effects. Migrancy divests the region of actively capable people. The decrease in labour has<br />
directly affected agricultural output and has contributed to a transformation from self-sufficiency to a<br />
dependence on migrant income, and over-refined food from trading stores. The most significant effect<br />
of migrancy was the fact that male migration was most common, and as a result of this, family<br />
structures were altered, thus creating female -headed households (AFRA 1990; Zakrzewski 1988).<br />
Studies carried out in the 1970’s and early 1980’s amongst two Kosi Bay communities indicated that<br />
communities were in extreme poverty. The study revealed that all households engaged in cultivation,<br />
however, none were self-sufficient. It was found that during this period households in the Ingwavuma<br />
district were predominantly dependant on migrancy income (Webster 1986). The decline in the South<br />
African economy during the 1980’s led to a high percentage of unemployment. This had a devastating<br />
impact on the people living in the Kosi bay area, so much so that the unemployment rate in the area as<br />
of 1987 was 52% for men and 89% for women.<br />
Present Socio-Economic Status of people in the Kosi Bay area (data source: National Census)<br />
Socio-economic status is taken to refer to a household’s access to productive wealth, information,<br />
knowledge and participation in social organizations. The statistics below, based on data derived from<br />
Statistics South Africa, National Census (1996 and 2001) are for the Tembe Ward, which encompasses<br />
Kosi Bay.<br />
The statistics indicate that the birth rate in the area has decreased from the year 1996 to 2001. The age<br />
group of 15 to 34 is the most prominent in the population.<br />
131
Age<br />
Persons 1996 2001<br />
%<br />
change<br />
0 to 4 1351 1203 -10.95<br />
5 to 14 2756 2877 4.39<br />
15 to 34 3612 3600 -0.33<br />
35 to 64 1632 1755 7.54<br />
Over 65 586 723 23.38<br />
Figure 38. Age classes Maputaland<br />
Although there seems to be a slight increase in completed education levels, especially that of higher<br />
education levels, education levels remain fairly low.<br />
Highest education levels attained by over 20 year olds<br />
Persons 1996 2001<br />
No<br />
schooling<br />
%<br />
change<br />
2211 2295 3.80<br />
Some<br />
primary<br />
Complete<br />
primary<br />
673 792 17.68<br />
253 207 -18.18<br />
Secondary 684 852 24.56<br />
Grade 12 373 492 31.90<br />
Higher 50 186 272.00<br />
Figure 39. Highest education levels attained by over 20 year olds<br />
Although the number of people employed has increased from 1996 to 2001, the number of people<br />
unemployed has also increased during this period. There has been an improvement in the category of<br />
people not economically active.<br />
132
Labour force<br />
Persons 1996 2001<br />
%<br />
change<br />
Employed 665 897 34.89<br />
Unemployed 1384 1449 4.70<br />
Not<br />
economically<br />
active<br />
Total labour<br />
force<br />
3489 3048 -12.64<br />
5538 2346 -57.64<br />
Figure 40. Labor Force<br />
The area has experienced a decline in the agricultural industry from 1996 to 2001. However, there has<br />
been a prominent boom in community-based industries, as well as financial services and the wholesale<br />
industry.<br />
Industry<br />
Persons 1996 2001<br />
%<br />
change<br />
Agriculture/Forestry/Fishing 14 9 -35.71<br />
Community/Social/Personal 276 411 48.91<br />
Construction 22 18 -18.18<br />
Electricity/Gas/Water 0 3 -<br />
Financial/Insurance/Real<br />
Estate/Business<br />
24 48 100.00<br />
Manufacturing 9 9 0.00<br />
Mining/Quarrying 11 9 -18.18<br />
Other - 0 -<br />
Private households 130 102 -21.54<br />
Transport/Storage/Communication 12 30 150.00<br />
Undetermined 130 216 66.15<br />
Wholesale/Retail 50 111 122.00<br />
Figure 41. Industry<br />
From 1996 to 2001 there has been a rapid increase in technical occupations, there has also been an<br />
increase in the number of clerical and service worker positions occupied.<br />
133
Occupation<br />
Persons 1996 2001<br />
%<br />
change<br />
Craft/Trade 78 18 -76.92<br />
Elementary 176 168 -4.55<br />
Legislators/Senior<br />
officials<br />
Unspecified/Not<br />
economically<br />
classified<br />
Plant/Machine<br />
operators<br />
12 36 200.00<br />
- 0 -<br />
21 21 0.00<br />
Professionals 154 51 -66.88<br />
Service workers 70 108 54.29<br />
Agricultural/Fishery 12 6 -50.00<br />
Technicians 35 231 560.00<br />
Undetermined - 255 -<br />
Clerks 33 81 145.45<br />
Figure 42. Occupation<br />
A great proportion of the population does not have an annual household income. Approximately 50%<br />
of the households in the area receive annual incomes in the region of R4801 – R9600.<br />
Annual household income (2001)<br />
Households 2001<br />
None 870<br />
R1 - 4800 246<br />
R4801 - 9600 471<br />
R9601 - 19200 213<br />
R19201 -<br />
38400<br />
R38401 -<br />
76800<br />
R76801 -<br />
153600<br />
R153601 -<br />
307200<br />
195<br />
75<br />
33<br />
6<br />
134
R307201 -<br />
614400<br />
R614401 -<br />
1228800<br />
R1228801 -<br />
2457600<br />
Over<br />
R2457600<br />
0<br />
6<br />
6<br />
0<br />
Figure 43. Annual household income (2001)<br />
From 1996 to 2001 there has been an increase in the number of households that do not have<br />
sanitation facilities. However, some households by the year 2001 were able to obtain flush and<br />
chemical toilets as well as flush septic tanks.<br />
It is evident that there has been a drastic increase in the number of formal dwellings from 1996 to<br />
2001 and there has been a subsequent decrease in traditional dwellings. There has also been a slight<br />
increase in informal dwellings.<br />
Dwelling type<br />
Households 1996 2001<br />
%<br />
change<br />
Formal 543 1395 156.91<br />
Informal 6 84 1,300.00<br />
Traditional 1008 639 -36.61<br />
Other 6 3 -50.00<br />
Total<br />
households<br />
1571 2121 35.01<br />
Figure 44. Dwelling types<br />
135
Sanitation<br />
Households 1996 2001<br />
%<br />
change<br />
Flush toilet 15 132 780.00<br />
Flush septic<br />
tank<br />
Chemical<br />
toilet<br />
- 66 -<br />
- 435 -<br />
VIP - 162 -<br />
Pit latrine 785 300 -61.78<br />
Bucket<br />
latrine<br />
0 3 -<br />
None 773 1029 33.12<br />
Figure 45. Sanitation<br />
5.2 Current and alternative future land-use options in Kosi Bay’s Peat Swamp Forests<br />
5.2.1 Rationale and objectives<br />
The swamp forests associated with Kosi Bay are coming under increasing pressure from local farmers,<br />
as highlighted in 5.1 and 5.3. From an environmental and biodiversity point of view this is seen as a<br />
considerable threat to the swamp forests. How then is this to be addressed? By beginning with the<br />
people who are seen as “the problem”. Simply put, unless we see the situation from the perspective of<br />
the people using the system and understand how they make their particular land-use choices and what<br />
they are “doing on the ground”, we are going to be ill-equipped to promote any conservation or wise<br />
use of Kosi Bay’s swamp forests. An investigation of local people’s utilization of the swamp forests<br />
was therefore undertaken with the following specific objectives.<br />
?? Undertake a field based survey of current utilization of CPSFs within existing cultivated<br />
swamp forest plots (based on a questionnaire survey of farmers and a rapid visual description<br />
of individual agricultural plots)<br />
?? Undertake a qualitative appraisal of the contribution of swamp forest resources to the<br />
livelihoods of local people<br />
?? Examine alternative land-use options to that of CPSF cultivation<br />
?? Recommend best Management Practices and alternatives, with reference to the above research<br />
findings and to established guidelines developed internationally for the wise use of peatlands<br />
Section 5.1 dealing with “Historical background and socio-economic context of the CPSFs of Kosi<br />
Bay” provides the context for this investigation, which is also closely aligned with a later section<br />
dealing with land tenure issues and the operations of major landholders (5.3).<br />
136
5.2.2 Methodology<br />
Eight different swamp forest areas, from Cele and Kukalwe in the north, Mashayinyoni, Nkanini,<br />
Ngozini and Manguze in the central area, to Syadla and Malangeni in the south, were purposively<br />
selective to include a variety of different management and socio-economic contexts. Although areas<br />
inside the Nature Reserve were included, the focus was primarily on areas outside the reserve,<br />
including communities known to be relatively poor and communities known to be “better off”. In each<br />
area, semi-structured interviews were conducted with users encountered within their swamp forest<br />
plots, 33 individual farmers in total. The information gathered during these interviews included:<br />
?? Size of the field<br />
?? Length of time the field has been cultivated<br />
?? Other fields owned by the user<br />
?? Production practices (e.g. use of fallow periods)<br />
?? Types of crops grown and a visual estimate of their cover in the plot<br />
?? Contribution of the food produced in the swamp forest field to the needs of the household<br />
?? Extent of sale of crops produced from the field and types of crops sold<br />
?? Problems encountered in production<br />
?? Natural resources used from the swamp forest (e.g. Raphia palm fronds)<br />
?? Other general issues relating to use and access to swamp forests<br />
Notes were also taken of the biophysical features of the site and the extent of artificial drainage<br />
present in the plots and, based on this, a visual estimate was undertaken of the extent of hydrological<br />
modification of each plot. Two local guides, Patrick Tembe and Senzo Hobe, carried out translation<br />
during the interviews.<br />
Of relevance to exploring alternatives to cultivation of the swamp forests is to understand better the<br />
cultivation that is taking place outside of the swamp forests - what constraints are present, how are<br />
individual farmers addressing these, and what can be done to improve production. While resources did<br />
not allow this to be formally investigated in this study, it was addressed informally through openended<br />
interviews with a few key informant farmers, and Department of Agriculture personnel and by<br />
observations in the field during the course of the survey.<br />
5.2.3 Results of the survey of individual plots<br />
The questionnaire survey<br />
The plots samples were found to vary in size from less than 0.01 ha to 3 ha, but with most plots falling<br />
within 0.1-1.0 ha range (see Figure 46). As would be expected, plots used for household food<br />
production tend to be smaller than those geared primarily for production for the market. Households<br />
vary greatly according to the scale and mode of production. At one end of the scale are those<br />
cultivating less than a 0.1 ha, primarily for home consumption. These farmers tend to be women, often<br />
working on their own. Next are those farmers cultivating medium-sized areas (usually 0.10-0.50 ha<br />
hectares) where, in most cases food produced is for both home consumption and sale. Next are farmers<br />
cultivating 0.51-1.00 ha, where, although production for household consumption is significant,<br />
137
production is generally geared more for sale. Although some of these households employ additional<br />
labour, plots are worked primarily by household members, despite their larger size. Here it is common<br />
to find husband and wife teams working for several full days a week on their plots. Finally, we find a<br />
few larger-scale farmers cultivating more than a hectare, mainly for commercial purposes. Bananas are<br />
the most favoured crop amongst these farmers, who are mainly males using paid labour.<br />
Percentage frequency<br />
60<br />
50<br />
40<br />
30<br />
20<br />
10<br />
0<br />
1.00 ha<br />
Plot size classes (ha)<br />
Figure 46. Size class distribution of cultivated plots (n=33) in the swamp forests of Kosi Bay<br />
The length of time areas have been cultivated varies considerably from some fields that were<br />
established less than two years ago, to areas, which have been cultivated by the same family for<br />
several generations.<br />
Fallowing of croplands is widely practiced particularly on the wetland margins (51% of the farmers<br />
indicating that they practice some form of fallow, although for some farmers this is for only a small<br />
proportion of time relative to the time cultivated). Several farmers indicated that fallowing is not<br />
required in the wetter peat dominated areas because of the high fertility of these areas, while others<br />
indicated that although they understand the benefits of resting the land, they do not have enough land<br />
in which to do so.<br />
The most widely grown crops within swamp forest plots are bananas and madumbes (Colocasia<br />
esculenta) followed by sweet potatoes, cassava and sugar cane (see Table 15). Bananas and madumbes<br />
make up the bulk of the crop cover, followed by sweet potatoes (Figure 47). For the larger scale<br />
producers (see Section 5.3), not included in this survey, bananas would occupy a still larger<br />
proportion.<br />
138
Table 15. Frequency of occurrence of different crop types and natural resources amongst the 33 plots<br />
described<br />
Crop types in cultivated swamp forest<br />
Crop type<br />
Avocados*<br />
Bananas<br />
Beans*<br />
Beatroot*<br />
Cabbage*<br />
Carrots*<br />
Cassava*<br />
Cucurbits<br />
Green pepper*<br />
Ground nuts*<br />
Lettuce<br />
Madumbes<br />
Maize*<br />
Mangoes<br />
Onions*<br />
Pepper*<br />
Spinach<br />
Sugarcane<br />
Sweet potatoes<br />
Tomatoes<br />
Percentage<br />
frequency<br />
3<br />
79<br />
3<br />
6<br />
42<br />
9<br />
64<br />
27<br />
3<br />
9<br />
21<br />
79<br />
27<br />
9<br />
48<br />
3<br />
36<br />
52<br />
70<br />
33<br />
Natural resources obtained from<br />
untransformed swamp forest<br />
Natural resource type<br />
Berries<br />
Fruit, other<br />
Mangoes (naturalized trees)<br />
Medicinal plants<br />
Sedges<br />
Reeds<br />
Wood<br />
Percentage<br />
frequency<br />
3<br />
3<br />
15<br />
6<br />
6<br />
9<br />
48<br />
* These crops are confined almost entirely to wetland margin plots and to the uppermost drier portions<br />
of swamp forest plots, and are largely absent from within the peatland swamp forests.<br />
Onions<br />
cabbages<br />
cassava<br />
madumbes<br />
bananas<br />
sugarcane<br />
sweet potatoes<br />
Figure 47. Proportional cover of the most frequently occurring crops, based on the visual estimate of<br />
cover from the 33 plots<br />
139
Location of the crops within the garden varies according to crop type. Madumbes, in particular,<br />
together with bananas and sometimes sugar cane, occur in the wettest portions of the garden, with the<br />
other crops such as cassava being confined to the drier fringes or on significantly raised beds within<br />
these areas (see table 15). Crops such as onions and maize were notably absent from the wetter areas.<br />
Newly established plots are typically planted to madumbes, followed shortly by bananas. The two will<br />
continue to be grown together but as the bananas become progressively more established over the next<br />
few years, the amount of madumbes grown is reduced, and in some cases phased out entirely within<br />
the plot.<br />
Almost all households <strong>report</strong>ed that their wetland gardens contributed significantly to the household’s<br />
food supply. Although this could not be quantified, many farmers spoke of the critical contribution<br />
that the two primary root crops, madumbes and sweet potatoes make to the household’s food security.<br />
Some mentioned how vital these areas are to providing nourishment especially to the children in the<br />
household. The nutrition value of madumbes is high, with the corms having small starch grains<br />
making them easily digestible and very suitable for infants (Shanley 1966). Madumbes, together with<br />
sweet potatoes, provide an important source of diversity (in terms of dietary elements such as minerals<br />
and trace elements) to local people’s primary staple food, which is maize meal. The swamp forest<br />
plots also provide an important source of green leaf material from cucurbits and spinach, both widely<br />
cultivated in the swamp forest plots.<br />
Of the farmers interviewed, 73% indicated that they sold at least some of their produce. The level to<br />
which these farmers sell their produce varies considerably amongst the farmers. These range from<br />
those focused on household food production (but with some sale of excess taking place) to plots that<br />
are geared primarily for the production of crops for sale. In an area where formal employment<br />
opportunities are very limited, the income derived by medium- and larger-scale swamp forest farmers<br />
may be substantial from the perspective of the individual household. Sale of produce is confined<br />
almost entirely to four crops: bananas (55% of households selling), madumbes (52%), sugar cane<br />
(18%) and sweet potatoes (12%).<br />
Problems encountered by the farmers in the production of their crops included the following.<br />
?? Many farmers (27%) <strong>report</strong>ed damage to crops by Bushpigs in particular and also monkeys,<br />
particularly those with plots in the Reserve or in close proximity of the Reserve.<br />
?? Excessive waterlogging, particularly in the year 2000, was <strong>report</strong>ed by 21% of the farmers.<br />
?? Stealing of produce from the field was cited as a problem by 18% of the farmers.<br />
?? Interference by Ezemvelo KZN Wildlife was <strong>report</strong>ed by all farmers cultivating within the<br />
proclaimed Nature Reserve (i.e. 18% of the interviewed farmers) as a major problem for them.<br />
140
?? Soil fertility was <strong>report</strong>ed by 15% of the farmers, particularly those with fields confined mainly to<br />
the margins. Fertility of the wetter peatland areas was <strong>report</strong>ed to be generally good.<br />
?? Pests, particularly during summer, were cited by 15% of the farmers.<br />
Other less frequently cited problems included: difficulties in marketing of produce, damage by rats,<br />
damage by mole rats, expense of having to buy manure (for wetland margin areas), the difficulty of<br />
clearing forest to establish plots, and health problems of individual farmers, which limits the strength<br />
that they have for working in the fields.<br />
The interviews with individual farmers did not probe deeply into the underlying factors influencing<br />
their cultivating in the swamp forest. However, the following would appear to be some of the<br />
important factors, with their relative importance varying from household to household.<br />
?? Food for the family<br />
?? A source of income<br />
?? A means of “holding/re-gaining claim” to land<br />
?? As a “political statement” (e.g. concerning denied access to land)<br />
?? Social function, where gardens are grouped closely and the individual farmers interact with one<br />
another<br />
The extent of use of natural resources from the forest amongst the farmers interviewed was found to<br />
be relatively low, with the most widely being wood used for building and fencing (see table 15). Much<br />
higher levels of use of the natural vegetation have been recorded for wetlands such as Mbongolwane,<br />
KwaZulu-Natal, where 70% of local people utilize the wetland for sedges or reeds and 36% for<br />
livestock grazing. Thus, the contribution of swamp forest to local people’s livelihoods is primarily<br />
through the conversion of these areas to agricultural fields. The value that the swamp forests have to<br />
local farmers an intact state is fairly limited. It must be noted, however, that the survey did not include<br />
other occupations, notably traditional healers and medicinal plant gatherers, for whom intact swamp<br />
forest may be much more important.<br />
Patterns emerge in the areas sampled in terms of the types of users and their different socio-economic<br />
circumstances in the different areas sampled. In the lower Nkanini area, swamp forest garden plots are<br />
worked primarily by middle-aged to elderly woman. They do so on their own or with varying level of<br />
assistance from other members of the family, usually her daughter/s. They appear to be relatively poor<br />
families, with the main source of income often from a single pension. In the upper Nkanini area,<br />
wetland gardens are held by households that are generally more well off and who employ individuals<br />
to work in their fields. The owners of these gardens generally have alternative sources of income (e.g.<br />
own a shop). Although being involved in planning the farming operations, many do not get involved in<br />
the physical work in the field, but this does not apply to all. Plots vary from small to large. In the<br />
141
lower Syadla area, wetland gardens are worked mainly by young to middle aged (both males and<br />
females). Often at least two members of the family are actively involved. While paid assistants may<br />
undertake temporary work, family members undertake most of the work. These families appear to be<br />
relatively poor, and individual members walk significant distances (for some a round trip of over 20<br />
km) to work in their fields each day, which are situated inside the Nature Reserve. Plots tend to be<br />
intermediate to large and geared for production for sale. In the Manguze area, farmers appear to be<br />
mainly women producing food for household consumption in small plots, with some limited selling of<br />
excess taking place.<br />
5.2.4 The rapid visual appraisal of plots<br />
Based on the survey, it can be seen that the majority of the plots are having at least a moderately high<br />
impact on the hydrology of the plot area as a result of the artificial drains and/or raised beds (Figure<br />
48). The cumulative impacts of the collective plots are discussed in Section 2.3.1.<br />
Percentage frequency<br />
60<br />
50<br />
40<br />
30<br />
20<br />
10<br />
0<br />
Hydrological modification<br />
No drains or raised<br />
beds<br />
Low level of<br />
modification<br />
Moderately high<br />
level of<br />
modification<br />
Very high level of<br />
modification<br />
Figure 48. Level of hydrological modification of surveyed swamp forest plots (n=30) based on a<br />
subjective visual appraisal of the extent of artificial drains and raised beds in the plot, ranging from<br />
those with none to those with considerable modification<br />
During the survey, very few signs of active erosion were observed in the plots visited. Farmers also<br />
did not <strong>report</strong> erosion as a problem. The peatland swamp forests occur in relatively low energy<br />
environments where erosion forces tend not to be very high. Owing to the very high infiltration rates<br />
of the sandy soils, surface runoff from the surrounding slopes is relatively low. It should be cautioned,<br />
however, that the risks of erosion taking place in very high flood events (e.g. a 1 in a 100 year event)<br />
are not known and may be significant.<br />
As discussed in more detail in Section 2.3, the drainage and cultivation of a swamp forest area has<br />
three main environmental impacts:<br />
?? Removal of indigenous trees and other vegetation, leading to the complete destruction of habitat<br />
for both fauna and flora and a reduction in vegetation cover.<br />
?? The gradual loss of the upper layers of peat as a result of the loss of most of the peat forming<br />
processes, together with accelerated breakdown of the peat formed under historical conditions.<br />
142
?? The above two impacts result in a secondary impact on the hydrology of the swamp forest system,<br />
which has potential consequences for the hydrology and state of the overall lake system,<br />
depending on the scale of swamp forest destruction.<br />
It would appear, however, as <strong>report</strong>ed in Section 2.3, that the swamp forest is fairly resilient - if<br />
agricultural fields are abandoned and drains blocked the forest species re-establish fairly rapidly, and<br />
the original peat forming processes are resumed. In many respects the traditional low external-input<br />
agricultural practices found in the swamp forests have a high level of environmental sustainability.<br />
Biocides or artificial fertilizers are used sparingly or not at all, cultivation is totally by hand, external<br />
energy requirements (and associated CO 2 emissions) are very low, and levels of soil erosion appear to<br />
be low. This contrasts with many mainstream commercial agricultural farms, which are characterized<br />
by a high level of external energy input associated with mechanized operations and high levels of<br />
artificial fertilizer and biocide application. The value of these traditional methods needs to be<br />
emphasized and encouraged.<br />
Nevertheless, the current scale of agricultural activity taking place in the Kosi Bay swamp forests is so<br />
great (see Section 4) that even with low impact traditional methods, the cumulative impact of the<br />
multitude of individual plots is considerable. Many of the swamp forest tongues lying outside the<br />
Nature Reserve have been almost totally transformed to agricultural lands (see Plates 1i and 1j, table<br />
17 in the appendix of this section). No space is therefore left to allow the agricultural plots to rest<br />
while cultivation takes place elsewhere and no rejuvenation of the peat can take place, as was<br />
traditional practice.<br />
5.3 An examination of alternative land-use options<br />
5.3.1 Approach used in identifying alternatives<br />
In examining alternatives to swamp forest cultivation it is important to begin by reviewing the results<br />
of the survey. The survey indicates that in its intact natural state, the swamp forest is currently not of<br />
great direct value to local people. Although many households use it for wood, only some of the<br />
households obtain other swamp forest resources. Furthermore, as more and more households use<br />
modern materials such as cement blocks for building, the requirement for wood is declining. Wood<br />
can also be obtained from outside the swamp forest (i.e. it can be substituted). Thus, at best, the direct<br />
contribution to the livelihoods of local households by natural swamp forest is modest for some<br />
households and small for the remaining households. Furthermore, swamp forests are seen to harbour<br />
Bushpigs and monkeys that cause crop damage. Bushpigs are particularly destructive – some farmers<br />
<strong>report</strong>ing loosing more than half of their madumbe crop to Bushpigs. In the words of one of the<br />
farmers “We feed the pigs!“<br />
The modest direct contribution of swamp forests to local livelihoods contrasts markedly with some<br />
other wetland types found in South Africa, particularly some of the herbaceous wetland types<br />
dominated by grasses, reeds and sedges. These wetlands often provide multiple direct benefits<br />
including livestock grazing, especially during critical dry periods when cattle have little alternative<br />
143
grazing lands. These herbaceous wetlands may also supply unique and highly sought after craft plants<br />
such as incema, and reeds for construction purposes (see Kotze et al. 2002). All of these are difficult<br />
to substitute with resources from outside of the wetland. Where a natural wetland provides a high level<br />
of multiple direct benefits to local people, there is a strong local incentive not to transform too much<br />
of the wetland to agricultural land. Unfortunately, however, this does not apply to the Kosi Bay<br />
swamp forests, where the direct benefits of converting the swamp forest to agricultural land are<br />
generally far in excess of the modest benefits currently being derived directly from natural swamp<br />
forest. The challenge, therefore, is to find alternative ways through which value can be added to<br />
natural swamp forests for local people. Based on the investigation <strong>report</strong>ed on in Section 5.2.3 and<br />
discussions with Department of Agriculture staff and other stakeholders, the following potential<br />
alternatives to CPSF cultivation were identified.<br />
?? Tourism, particularly that linked closely to a “swamp forest experience”<br />
?? Enhanced productivity of upland household gardens<br />
?? Enhanced productivity of upland field crops<br />
?? Enhanced productivity of wetland margin gardens<br />
?? New commercial crops (e.g. geraniums for essential oil production) in upland areas<br />
?? Cultivation of Raphia palm in degraded swamp forest<br />
?? Craft production from sedges<br />
?? Forestry plantations in upland areas<br />
Each of these potential options is examined individually in Section 5.4.1-5.4.9, but nevertheless<br />
recognizing that the solution is likely to lie with a blend of several different alternatives. The<br />
assumption implicit in all of these alternatives is that if local people are assisted in gaining benefits<br />
from alternative land-uses to that of cultivating in the swamp forests then this will serve as a “carrot”<br />
to draw farmers out of the swamp forests. But several key issues around resource use will need to be<br />
addressed in parallel for this assumption to hold. For example, mechanisms to control resource use<br />
require strengthening so the use of a “carrot” can be supported by a “stick” (see Section 5.4.7).<br />
5.3.2 Tourism<br />
Tourism has been hailed as a promising means of adding value to the natural areas contained within<br />
GSWP, and is considered as pivotal in the economic development of the Maputaland Region.<br />
Furthermore, Kosi Bay is described as the crown jewel of the GSWP. Tourism therefore deserves<br />
attention as one of the most promising alternatives to swamp forest cultivation at Kosi Bay. However,<br />
for tourism to achieve this, several issues relevant to Kosi Bay need to be addressed.<br />
Firstly, people currently engaged in swamp forest cultivation may not look favourably on putting<br />
down their hoes for some occupation in the tourism sector and may not have the capacity to perform in<br />
this new role. For many farmers, farming is a way of life with which they are familiar and they may be<br />
uncomfortable entering a new and unfamiliar occupation. It is important to recognize, however, that as<br />
time passes to the next generation it is likely to become easier to attract people into the tourism sector<br />
compared with agriculture. Many of the farmers are from the older generations, with the younger<br />
generations having less interest in participating in agriculture.<br />
144
Secondly, the new tourism enterprises will need to involve a significant number of local people and<br />
mechanisms must be present to ensure that the agricultural lands that are abandoned for tourism will<br />
not become occupied by others, either outsiders moving into the area or local people (see Section<br />
5.4.11).<br />
In order to reinforce the positive feedback effect of tourism in maintaining the integrity of the swamp<br />
forest, direct links are required such as through the development of a swamp forest trail. To have the<br />
desired effect this trail would need to be as extensive as possible, effectively linked to as many tourist<br />
nodes as possible and be built using the maximum amount of local materials and labour and involving<br />
local people in maintenance and tour guiding. To this end, construction of the boardwalk could make<br />
extensive use of Raphia, with the novelty of walking on a boardwalk made from the midribs of leaves.<br />
If enough swamp forest could be preserved, this could be marketed as the premier swamp forest trail<br />
in South Africa.<br />
It must, however, be remembered that tourism is certainly not without its own array of environmental<br />
impacts, particularly if not carefully managed. In short, therefore, tourism is not about to come and<br />
save the swamp forest. And while it has the potential to make a positive contribution, it will need to be<br />
carefully managed. Thus far, tourism has failed to deliver the promised social and environmental<br />
benefits. This is not simply because local people have been denied access to tourism enterprise<br />
opportunities. There has been considerable investment in training and infrastrutural development in<br />
support of community based tourism ventures, but these enterprises have generally performed poorly<br />
(Ridl 2003. Pers. comm. School of Law, University of Natal, Durban).<br />
“Currently in South Africa, and particularly KwaZulu-Natal, the environmental and conservation<br />
tourism sector is being enthusiastically promoted as one of the key mechanisms to catalyse rural local<br />
economic development. However, there is increasing concern that the impact of tourism on local<br />
communities is not always beneficial and can include a range of negative livelihood consequences,<br />
false and uneven economic growth, loss of resources, cultural pollution, and increased vulnerability.<br />
One of the key areas of concern is the dispossession and loss of rights, particularly land rights for<br />
rural communities.” (Sapsford 2003).<br />
When considering tourism, it is important to examine the notion that nature-based tourism can pay for<br />
conservation. This was widely touted by the lobby opposing the mining of the St Lucia dunes. Here,<br />
the argument was put forward that the revenue generated from tourism would more than match that of<br />
the proposed mining. As highlighted in Section 5.1, expectations are unrealistically high of the<br />
revenue that can be generated from tourism, and particularly the amount of revenue, which will reach<br />
local people.<br />
5.3.3 Enhanced productivity of upland gardens and field crops<br />
Cultivation outside of swamp forests is faced with substantial constraints. The Kosi Bay area is<br />
characterized by sandy soils of low nutrient status, low soil organic matter contents and poor water<br />
holding capacity (see section 2.2.1). Soils are therefore infertile and susceptible to dry periods.<br />
145
Farmers spoke particularly of the poor maize yields. Some of the other field crops, especially nitrogen<br />
fixing crops such as groundnuts, perform better. Furthermore, despite the difficulties encountered,<br />
some successful household vegetable gardens were encountered with a variety of different vegetables.<br />
Most of these appeared to be well maintained through hand irrigation and the application of manure. It<br />
appears that a lot of opportunity exists for improving the production from existing upland gardens and<br />
increasing the number of households with their own household garden. Key mechanisms for achieving<br />
this would be through:<br />
?? Harvesting of water from the roofs of buildings<br />
?? Use of grey water generated by the household<br />
?? Increasing soil organic content through increased incorporation of crop residues and other organic<br />
material into the soil, trench gardening, etc.<br />
?? Use of nutrients generated by the household through application of composted household waste.<br />
Correct application procedures for cattle manure can also improve productivity. Currently, it is<br />
common practice amongst the Kosi Bay farmers interviewed who apply cattle manure to leave the<br />
manure on the soil surface exposed to sun and heat. This exposure results in increased loss of nitrogen<br />
through volatilisation, leading to reduced nitrogen content of the manure. This can be countered by<br />
storing the manure in a shady, cooler location and digging the manure into the soil immediately<br />
following application.<br />
However, overall there are no quick fixes to promoting household gardens. Valley Trust, for example,<br />
which is an NGO with a well established programme promoting sustainable agricultural production<br />
amongst poor households in the Valley of a Thousand Hills, near Durban, observe that it can take<br />
many years to facilitate improvements in the sustainability and productivity of households’<br />
agricultural systems (Haigh and Mbelu 2003. Pers. comm. Social Plant Use Programme, Valley Trust;<br />
Adey Pers comm. Rural Sociology Group, Wageningen University).<br />
It is also important to highlight that improved productivity of homestead gardens will generally only<br />
be a potential substitute for subsistence production and the sale of some excess production. It is<br />
unlikely to allow for substantial production for sale owing to the finite amount of water and nutrients<br />
that are generated and collected from a homestead.<br />
The potential to increase the productivity of field crops (currently mainly maize) is somewhat more<br />
limited than that of the small household gardens. The water and nutrients generated by households is<br />
unlikely to be sufficient to be used over more than a small area immediately adjacent to the<br />
homestead.<br />
Many farmers already grow groundnuts, which are nitrogen fixing and therefore assist in addressing,<br />
to some extent, the fertility problem. Nevertheless, there is likely to be scope for further addressing<br />
soil fertility constraints (e.g. through mechanisms to promote the accumulation of soil organic matter).<br />
5.3.4 Enhanced productivity of wetland margin gardens<br />
The inherent fertility of wetland margin soils would tend to lie between that of the surrounding slopes<br />
and that of the CPSF. Soil organic matter is likely to be higher and water in closer proximity than the<br />
146
upslope areas. The agricultural potential of these areas is likely to be enhanced through composting<br />
and irrigation from shallow wells, either by hand or with a treadle pump. The use of hand pumps over<br />
shallow boreholes located upslope from the wetland margin would also warrant investigation.<br />
Compared with the swamp forests, which are essentially “self irrigating”, irrigation of the wetland<br />
margins requires extra work. However, the advantage is that wetness can be better controlled, thereby<br />
overcoming the problem of waterlogging, <strong>report</strong>ed as problematic by several farmers in the survey<br />
(see Section 5.3). Department of Agriculture could potentially play a critical role here, with a key area<br />
of support in terms of advice and resources for treadle pumps and fencing. Community gardens are<br />
generally taken as the most effective means for Department of Agriculture to reach as many individual<br />
households as possible, as well as optimising the benefits of infrastructure such as fences and treadle<br />
pumps. One of the “down-sides” of community gardens are the added resources required to develop<br />
and maintain the organizational structures (e.g. conflict resolution mechanisms) to keep the group<br />
working effectively together.<br />
As in the case of upland gardens, these gardens are also likely to benefit from the greater cultivation of<br />
nitrogen fixing crops and mechanisms to increase soil organic content.<br />
5.3.5 New commercial crops<br />
Department of Agriculture are currently examining the potential new crops for the Maputaland area.<br />
One of the potentially most promising are geraniums for the production of essential oils, and another<br />
possibility is organically produced mangoes. The general area is well suited for mangoes, which<br />
already occur widely. After all, Manguze takes its name from the abundantly growing mangoes of the<br />
area. Other possibilities include black pepper (which grows well under reasonably shady conditions)<br />
and vanilla (Osborne 2003. Pers. comm., Department of Agriculture and Environmental Affairs,<br />
Cedara, KwaZulu-Natal). The promotion of potential new crops is likely to be more difficult than in<br />
other more fertile areas of Maputaland such as around the Pongola floodplain, where the inherent<br />
fertility of the soils are much higher. Thus, it is likely to prove difficult to find new crops that will be<br />
able to be produced on the poor sandy soils of Kosi Bay but it is nevertheless worth investigating<br />
(Osborne 2003. Pers. Comm., Department of Agriculture and Environmental Affairs, Cedara,<br />
KwaZulu-Natal).<br />
Potential also exists for increasing production through the introduction of new varieties of existing<br />
crops. Department of Agriculture, for example, have promising new varieties of sweet potatoes which<br />
they are starting to promote more widely in the province (Osborne 2003. Pers. Comm., Department of<br />
Agriculture and Environmental Affairs, Cedara, KwaZulu-Natal).<br />
5.3.6 Cultivation and processing of Raphia palms<br />
The leaves of the Raphia palm (Raphia australis) are amongst the longest in the world, measuring up<br />
to 10 m in length. As highlighted in Section 5.3, this plant has a great variety of different uses,<br />
particularly for building. It also grows quickly and easily from seed, provided that the soils are well<br />
supplied with water (Pooley 1993). Thus, it has the potential to be grown and harvested for income<br />
147
generation. From a hydrogeomorphological perspective, it is far more desirable than any of the known<br />
crops, which can be viably grown in the swamp forests in that it has the following features:<br />
?? It is tolerant of prolonged waterlogging and therefore does not require any artificial drainage<br />
?? Its root system effectively binds stream banks<br />
?? It does not require disturbance of the soil to plant or harvest<br />
?? The dead fronds are harvested, leaving the rest of the plant fairly intact and undisturbed<br />
?? It would support a much greater diversity of indigenous plants than any of the alternatives<br />
It should be noted, however, that from a biodiversity point of view it would not be desirable to have<br />
extensive areas of other types of swamp forest converted to Raphia, as this would reduce the diversity<br />
of types contained within the collective swamp forests of Kosi Bay. Neverthele ss, conversion of other<br />
swamp forest types to Raphia would be preferable to no swamp forest at all. Thus, propagation and<br />
planting of Raphia could be responsibly promoted provided that it takes place only in degraded swamp<br />
forest and its extent is controlled. This would be well suited as a project to be supported by the statefunded<br />
Working for Wetlands Programme.<br />
It should also be added that harvesting of Raphia would need to be well controlled. People cutting<br />
leaves often cut living leaves and burn undergrowth in order to obtain easier access to the dead leaves.<br />
Several fires have been started in this manner (Kyle 1995). Prevention of such practices would make<br />
harvesting very sustainable.<br />
No matter how extensively and sustainably Raphia could theoretically be grown and harvested, in<br />
order for Raphia to be a viable alternative, the issue of markets for Raphia products will need to be<br />
addressed. The current market for Raphia is fairly limited. While some of the tourist camps have used<br />
Raphia in their construction, most is for domestic use. Thus, markets need to be developed. Promoting<br />
the use of Raphia in tourist camps, lodges and boardwalks within the Kosi area, is likely to have the<br />
greatest potential. Raphia requires replacing after a period. While the cost of the materials is low the<br />
labour requirement for maintenance would be high. This makes the option very attractive from a<br />
poverty alleviation point of view. Thus, if markets could be secured and degraded swamp forest<br />
rehabilitated then this would add value to the intact swamp forest.<br />
5.3.7 Crafts woven from wetland sedges<br />
Cyperus alternifolius occurs in some swamp forest areas, particularly where the forest is disturbed and<br />
the tree canopy is broken. It is able to continue growing vigorously even under partial shade. The<br />
culms of the plant are used for weaving mats, which have the potential for use in roller blinds, screens<br />
and cladding. It is one of the tallest growing sedges and therefore the culms can be woven into wide<br />
mats. This is an asset for products such as roller blinds, which are required at particular widths.<br />
This plant can also be readily cultivated. But, as in the case of Raphia, extensive conversion to favour<br />
this species would compromise the biological integrity of the swamp forest. Cyperus alternifolius is<br />
not found in any abundance within undisturbed swamp forest, and currently Cyperus alternifolius is<br />
148
not widely used. Thus, while promoting new markets is likely to have some potential, the potential of<br />
this alternative use is unlikely to be high.<br />
5.3.8 Plantation forestry<br />
Sappi are intending to expand the area of Maputaland falling under their out growers’ programme for<br />
small-scale timber producers, termed Project Grow. Some of the major banana growers are already<br />
making the transition to plantation forestry (see Section 5.3). Because of the financial returns, a good<br />
market for timber and backup support from the timber industry, timber production is a potentially very<br />
promising alternative from an economic point of view.<br />
The downside of plantation forestry is the potentially substantial environmental impact on the general<br />
area and specifically on the integrity of the Kosi Bay system. Extensive plantation forestry around the<br />
Kosi Lakes is likely to lead to a lowering of the water table and the desiccation of the CPSF, which<br />
would have significant secondary impacts such as the increased incidence of ground fires. Peat fires<br />
have already occurred in the peatlands adjacent to KuShenga Lake, the levels of which have been<br />
dropped as a result of pumping water to supply Manguze town. These likely environmental impacts<br />
are recognized by Sappi, who are therefore focusing the development of new plantations in the Project<br />
Grow programme away from Kosi Bay, west of the main tar road (Van Loggerenberg 2003. Pers<br />
comm., Sappi). This is some distance from Kosi Bay, which would limit its potential as an alternative<br />
for individual swamp forest farmers with land rights close to Kosi Bay. Therefore, plantation forestry<br />
probably has the potential to act as an alternative for a few of the major banana producers in the<br />
swamp forest but it would have very limited potential beyond this.<br />
Furthermore, entry into plantation forestry tends to be by farmers who already have reasonable<br />
financial means and power in the community. It is difficult for the poorest of the poor to enter unless<br />
as menial labour. In addition, the labour requirement for timber is lower than that existing cultivation.<br />
5.3.9 Public works programmes<br />
One of the Government’s strategies for addressing poverty in South Africa is through public works<br />
programmes, such as the Working for Water programme. Already operating widely across South<br />
Africa, the scale of public works programmes is to be increased, and in the foreseeable future they are<br />
likely to remain one of the key means of alleviating poverty in South Africa.<br />
For Kosi Bay, the following types of works programmes should be examined.<br />
?? Those with an environmental focus, notably the Working for Wetlands and Working for Water<br />
programmes, particularly given that the main focus of the Working for Wetlands programme<br />
is the rehabilitation of degraded wetlands.<br />
?? The upgrading and maintenance of roads (which has potential benefits to both the local<br />
community and for tourism)<br />
?? Tourism-orientated infrastructure (e.g. a cultural centre or a forest boardwalk)<br />
149
?? Other public works programmes, such as those dealing with and building of schools, crèches<br />
and community centres<br />
The programmes that are geared around environmental issues and nature based tourism have the<br />
greatest potential to try and maximize the “pull effect” that they have on swamp forest farmers owing<br />
to the more direct link that they could potentially have with swamp forests.<br />
While it may be argued that these programmes are not highly self-sustaining because they are<br />
dependent on direct government support, the level of government support is high. Commitment from<br />
government for funding of Working for Wetlands is assured for the next three years at the very least,<br />
and in all likelihood longer than that.<br />
5.3.10 Other alternatives<br />
The eight alternative “land uses” described above is by no means an exhaustive list. During the<br />
participatory process advocated in Section 6 for developing a way forward, other potential alternatives<br />
are likely to emerge in addition to the few further possibilities listed below.<br />
?? Honey production, with the swamp forest trees providing an important source of nectar.<br />
?? A variety of crafts based on natural, synthetic and recycled materials, which as far as possible<br />
reflect the local Maputaland culture as well as having appeal for a contemporary market (e.g. fish<br />
traps adapted as lampshades)<br />
?? Small businesses supplying a variety of products to meet local needs (e.g. locally brewed beer,<br />
locally made coffins and locally manufactured security gates). This results in capital being<br />
circulated more in the local economy rather than being lost rapidly to outside businesses (i.e. the<br />
economy is as localized as possible).<br />
5.3.11 Summary of the features of potential alternatives to swamp forest cultivation<br />
Table 16. Summary of the features of potential alternatives to swamp forest cultivation<br />
Alternative<br />
land-use option<br />
Market and<br />
backup<br />
Potential<br />
negative<br />
Ease of<br />
entry for<br />
Potential<br />
“pull effect”<br />
Attractiveness<br />
for “better-<br />
support environment the poor off” farmers 2<br />
al impacts 1<br />
Tourism Moderate Moderate Moderate 3 Moderate Very high 4<br />
Upland<br />
cultivation<br />
Wetland margin<br />
cultivation<br />
Moderately<br />
poor<br />
Moderately<br />
poor<br />
Low Very high 5 Low Moderate<br />
Moderate Very high 5 Low Moderate<br />
New crops Poor Unknown Unknown 5 Unknown Unknown<br />
150
Raphia Poor Low High 5 Unknown Moderate<br />
Crafts from<br />
sedges<br />
Plantation<br />
forestry<br />
Works<br />
programmes<br />
Poor Low Very high Low Low<br />
Good High Low High Low<br />
Good Low Very high Moderate 6 Very high 7<br />
1 For all land-uses, it is assumed that there will be a reasonable level of control over land-use activities<br />
2 The assumption is that markets are secured for the particular product<br />
3 Although there is scope for a variety of skills within tourism, a reasonable skills and capacity level is<br />
required for most operations, requiring training, development and mentoring<br />
4 Although some of the existing tourism operations are illegal and may need to be closed, much<br />
potential exists to expand existing tourism operations at Kosi Bay and enhance the marketing of Kosi<br />
Bay as a tourist destination.<br />
5 The assumption is that there is assured access to land<br />
6 Provided that they would be able to secure work as contractors through the standard tendering process<br />
7 This is entirely dependent on continued government support<br />
5.3.12 Issues around control of land-use activities<br />
Currently, the Kosi Bay swamp forests include portions inside the Kosi Bay Nature Reserve<br />
proclaimed in 1987, where the controlling authority is Ezemvelo KZN Wildlife, and those portions<br />
lying outside the Reserve. Here the Tribal Authority has primary control over the allocation of land<br />
but they are having very little restraining effect on the destruction of swamp forests. While CBNRM<br />
programmes have the potential for enhancing control of swamp forest use, throughout southern Africa,<br />
CBNRM systems have generally failed to deliver the benefits envisaged. The hard truth is that if we<br />
want some swamp forest to survive then, for the immediate future at least, areas of forest have to be<br />
set aside for formal protection. To be successful, this will require the buy-in and support of all<br />
stakeholders. The tremendous challenge is to ensure that just compensation has been provided to all<br />
those households that have foregone their rights to cultivate in the forest. And, just as importantly,<br />
there must be public consensus from all key stakeholders that this has taken place. This will then<br />
provide a sound basis on which to move forward with regulation.<br />
As described in Section 5.1, following proclamation of the Kosi Bay Nature Reserve, a lengthy<br />
compensation process took place. However, this was in the politically very turbulent times during the<br />
apartheid era, when even if households had been more than compensated for their foregone rights of<br />
use, consensus from all stakeholders was not going to be achieved. It is not surprising, therefore, that<br />
151
the issue of access by local people to cultivation of swamp forests within the Reserve boundary has<br />
remained highly contested. The end result is that the regulatory authority, Ezemvelo KwaZulu-Natal<br />
Wildlife now have the very difficult task of continuing to exclude users who do not recognize their<br />
legitimacy. Furthermore, KwaZulu-Natal Wildlife therefore also has little credibility in calling for<br />
more restrained use of the swamp forest outside of the Reserve.<br />
The “Building Broader Support for Protected Areas” stream at the World Parks Congress, 2003 passed<br />
a recommendation on poverty and protected areas. It advocates a number of guiding principles for<br />
protected area agencies and practitioners, including the following:<br />
?? Protected areas should strive to contribute to poverty reduction at the local level, and at the very<br />
minimum must not contribute to or exacerbate poverty<br />
?? Where negative social, cultural and economic impacts occur, affected communities should be<br />
fairly and fully compensated.<br />
?? Biodiversity should be conserved both for its value as a local livelihoods resource and as a<br />
national and global public good<br />
Some conventional protected area approaches have tended to exclude people and/ or prohibit most<br />
kinds of resource use within certain categories of protected areas, without providing alternatives to<br />
meeting livelihood needs of local people. Many participants at the congress presented an alternative<br />
view that sees sustainable resource use and management as a realistic alternative, which would<br />
contribute to both poverty reduction and biodiversity conservation.<br />
A more participatory, community based approach to the management of the Kosi Bay Nature Reserve,<br />
in line with the above sentiments, is required. It is acknowledged, however, that this is by no means an<br />
easy option. More than a decade has now passed since “old style”, “fortress conservation” of protected<br />
areas has been replaced in many areas by Community Based Natural Resource Management<br />
(CBNRM), whereby local communities are empowered as the custodians, owners and beneficiaries of<br />
the wetland resources (Hulme and Murphre 2001). Much hope was placed in this new paradigm for<br />
benefiting both local people and the conservation of biodiversity. However, although there have been<br />
some successes, the overriding consensus is that CBNRM is failing dismally to deliver the originally<br />
intended results of conservation and development (Murombedzi 1999; Breen et al., undated).<br />
There are many difficulties in implementing CBNRM because, for example traditional institutions and<br />
belief systems are rapidly being lost in many rural areas. In Lake Malawi, for example, CBNRM<br />
programmes have failed to address the increasing threat that fishing is having on the on the Lake’s<br />
unique cichlid fishes (Hara 2000). As indicated by Wells and Brandon (1992) linking conservation and<br />
development objectives is extremely difficult, and Adams (2001) cites some East African examples<br />
showing how conservation objectives can, over time, readily become de-emphasised in relation to<br />
revenue generation and development.<br />
152
In South Africa’s communal areas, the issue of environmental management is very complex. It is<br />
influenced by factors such as ownership, responsibility and trust. During the apartheid regime people<br />
where removed forcefully to go and stay elsewhere in small stands. They lost the land, which<br />
previously they thought was theirs. Those conditions to a certain extent eroded responsibility, trust,<br />
and sense of ownership (Silima 2003. Pers. comm. Mondi Wetlands Project, Pretoria). Apartheid<br />
fostered mistrust between people and the government, highlighted poignantly in the case of Kosi Bay.<br />
After the forced removal it was rare to find people with existing social ties, same interest and<br />
objectives of grouping themselves to care for the environment. Presently in a democratic South Africa<br />
we are living on the era were the slogan is “people shall govern” and some people misunderstood the<br />
meaning of the word “rights”, forgetting that rights come with responsibility. Some people think they<br />
have rights of practicing activities anywhere without considering their effect on the environment<br />
(Silima 2003. Pers. comm. Mondi Wetlands Project, Pretoria). Wetlands are gradually becoming the<br />
victim of such understanding and are thus subjected to poor land-use. Parallel authorities also<br />
characterize a democratic South Africa. We have traditional tribal authorities, local political councils<br />
and government departments all exercising powers and initiating different projects in the same areas<br />
(Claridge 2000). This can be demonstrated by, for example, the tribal authorities allocating plots of<br />
cultivation in wetlands, while conservation bodies are trying to promote their conservation.<br />
When planning the way forward the stakeholders will have to think very carefully about the<br />
relationship between offering alternatives to existing swamp forest cultivation and improving control<br />
of the cultivation, in order that the two work synergistically. In other words, how do we juggle the<br />
carrot and stick without dropping them? For example, some mechanisms may be required to make<br />
support for farmers with upland gardens conditional upon their following Best Management Practices<br />
when using the swamp forest.<br />
5.4 A framework to elucidate and resolve conflicting land use options for peat<br />
A framework is required to assist in reconciling the conflicting uses made of the peat swamp forests.<br />
The framework of Joosen and Clarke (2002) has specific relevance to the situation. Thus, the<br />
framework was applied to Kosi Bay as a means of revealing specific issues that would need to be<br />
addressed. The application of the framework also served as an opportunity to provide comment on the<br />
applicability of the framework to a “Developing World” situation. It should be noted that the<br />
application of the framework to Kosi Bay was to existing interventions (i.e. the current cultivation of<br />
the swamp forests described in Section 5.3) rather than to proposed future interventions. In addition,<br />
the framework was not applied in a multi-stakeholder context but rather applied by the authors as a<br />
way of exploring the issues and potential solutions.<br />
The framework developed by Joosen and Clarke (2002) consists of a series of questions (e.g. do all<br />
decision makers and participants have the same basic understanding of peatlands, and their characters,<br />
extent and functions?). If these questions are addressed satisfactorily, Joosen and Clarke (2002)<br />
contend then this framework should result in conflicts being resolved or options chosen with:<br />
?? A knowledge of the relevant information on mires and peatlands and their functions;<br />
?? An understanding of relevant values;<br />
?? A knowledge of the type of conflict or choice being faced;<br />
153
?? Respect for the different points of view involved;<br />
?? A knowledge of the effect of the intervention on the proposed function and on other functions;<br />
?? An awareness of the guidance principles which will govern the intervention; and<br />
?? A knowledge of the legal, regulatory and business framework within which the intervention will<br />
be carried out.<br />
While such a framework cannot remove vested interest or emotion from choices, it can provide a<br />
rational basis for deciding between different options.<br />
5.4.1 Application of the framework to the situation at Kosi Bay<br />
For each of the questions of Joosen and Clarke (2002) which can be posed in relation to any proposed<br />
intervention in a peatland (including the option to preserve), and which are listed below, a response is<br />
provided in relation to the situation at Kosi Bay.<br />
Are all decision makers and participants in the conflict or choice using terms with the same meaning,<br />
and have they a basic knowledge of peatlands and their characteristics, extent and functions?<br />
No. There is a fundamental lack of knowledge amongst wetland users and local leadership concerning<br />
peatlands. Further adding to the difficulty of the stakeholders reaching a common understanding is a<br />
language barrier - many of the stakeholders cannot speak English.<br />
Do those concerned understand the nature and categories of conflict 1 and why people have different<br />
positions with respect to values?<br />
There is generally a very poor understanding amongst the different stakeholders of each other’s<br />
positions. This is highlighted by a comment by one of the farmers “Why is KZN Wildlife so<br />
concerned with protecting Kosi Bay when there is hardly any wildlife (i.e. large wild animals) in the<br />
Reserve?”. Even within the conservation and scientific communities there are divergent views<br />
concerning the hydrological importance of swamp forests to the integrity of the Kosi Bay Lakes.<br />
Do those concerned understand the different types of conflicts or choices, which arise and have they<br />
identified the type of conflict, which arises in this particular case?<br />
1 Joosen and Calrke (2002) distinguish the following different categories of conflict:<br />
?? Conflicts arising from different understandings. For example where there are different levels<br />
of knowledge<br />
?? Conflicts arising from different judgements of which means will achieve a given end.<br />
?? Conflicts arising from different preferences<br />
?? Conflicts between different rights<br />
154
No. A key problem is that levels of conflict are so intense that the different stakeholders are<br />
preoccupied with dealing mainly with day-to-day hostility, which continues to “bubble over” rather<br />
than being able to examine (in a climate of trust and calmness) the issues and types of conflicts.<br />
Is the proposed intervention positive for human beings and is the function to be provided essential and<br />
non-substitutable?<br />
In the short/ medium term it is certainly very positive in that the intervention (i.e. cultivation of the<br />
swamp forest) is providing a key source of food and income to local people, many of whom appear to<br />
be some of the poorest members of the community. However, currently, the crop production function<br />
that the peat is supporting is largely non-substitutable. Only if viable alternatives can be developed<br />
(e.g. through enhanced upland and wetland margin crop production) would it be substitutable.<br />
Will the proposed intervention ensure a continuous supply of the function (for example, peat for<br />
energy) and are the peatlands abundant?<br />
No. Based on the high level of hydrological alteration in plots, together with the considerable extent of<br />
the plots, current use practices are likely to lead to the eventual depletion of the supply of peat for<br />
agricultural production and other purposes. With the application of Best Management Practices and a<br />
considerable reduction in the extent of cultivation, the supply could be ensured for considerably longer<br />
into the future. But currently it is not possible to quantify this given that the specific rate of peat<br />
accretion under different intensities of hydrological modification and types of use are not known.<br />
Although Maputaland is the richest source of peat in South Africa, peat is by no means abundant, with<br />
peatlands covering less than 5% of the land area in the region.<br />
Will the proposed intervention negatively affect other functions, and if so are the negatively affected<br />
functions essential, are they abundant or are they substitutable?<br />
The relative impacts of the current use are likely to vary considerably depending on the particular<br />
function.<br />
?? It will definitely have considerable negative impacts on biodiversity, particularly considering the<br />
high cumulative impacts on swamp forests in South Africa.<br />
?? It will impact negatively on the hydrological functions of the swamp forest plot areas, which<br />
further impacts negatively on biodiversity. The magnitude and possible impacts on the Kosi Bay<br />
Lakes are not known, as described previously.<br />
?? It impacts negatively on natural resources supplied by the swamp forests. However, as discussed<br />
in Section 6.3, if the extent is controlled and Best Management Practices are followed then this<br />
impact and the impacts described above will be reduced. If the extent of cultivation is<br />
considerable, particularly if it occurs in the Reserve, it will also impact negatively on the area’s<br />
tourism potential.<br />
155
Does the proposed intervention interfere with fundamental human rights, is it intended to satisfy needs<br />
or wants, will the benefits be evenly distributed, and is it the best available means to achieve the<br />
desired end?<br />
By nature, the interventions arise directly out of individual households acting on their economic and<br />
food security needs (which could be described as their basic human rights). This use does, however,<br />
interfere to some extent with the resources available to current generations and if it continues unchecked<br />
will certainly interfere considerably in the rights of future generations to have access to the<br />
peat resource, which would have been depleted.<br />
The “desired end” has not been defined, but if we take it as sustainable use, as defined by the Ramsar<br />
Convention on Wetlands as “human use of a wetland (or other natural systems) that yields the<br />
greatest continuous benefit to present generations while maintaining the potential to meet the needs<br />
and aspirations of future generations” then the answer is “no” given the above.<br />
Is the proposal clear and publicly communicated; will it produce greater advantage than not<br />
intervening; will a decision be based on the best available information, take into account effects on<br />
other entities, be limited to the minimum necessary, be adapted to the characteristics of the peatland<br />
and respect ecological processes and habitats?<br />
The answer to all of the above questions is generally no because interventions take place on an ad hoc<br />
basis.<br />
Are the answers to the last set of questions relevant to the specific time and place of the proposed<br />
intervention?<br />
Except for the first question in the set, which relates to a single proposal and is therefore not relevant,<br />
all of the remaining questions in the set are considered relevant.<br />
Do international law or international co-operative instruments affect the proposed intervention?<br />
Yes. Given that the Kosi Bay system is a designated Wetland Site of International Significance<br />
according to the Ramsar Convention and it also falls within a World Heritage Site.<br />
Do public policy, national legislation, land-use planning and environmental licensing regulate the<br />
proposed intervention? Are property rights protected and is there provision for rehabilitation of the<br />
peatland after use. Does the country have a policy to protect areas of environmental importance and<br />
are there programmes of education and awareness?<br />
In theory there is much national policy and legislation for supporting the protection of wetlands,<br />
notably the Conservation of Agricultural Resources Act, the National environmental Management Act<br />
and the National Water Act. However, particularly in rural communal areas, these acts have little<br />
bearing on what is happening on the ground (see Kotze 2002). The country also has policy (the White<br />
156
Paper on conservation of Biodiversity) and legislation designed to protect and ensure the sustainable<br />
utilization of the countries biodiversity. This applies particularly to protected areas, but also has<br />
application beyond the protected area borders, although again at present it is not likely to have great<br />
influence on utilization practices on the ground.<br />
For those plots outside of the Reserve, tenure is moderately secure. In as far as some farmers rest<br />
portions of their land, some provision for the rehabilitation of peat is provided for but not<br />
rehabilitation of the area back to its natural vegetation.<br />
Does the enterprise which will be responsible for the proposed intervention base its activities on<br />
commercial strategy, has it a good record of corporate governance, does it employ cost-benefit<br />
analysis in assessing proposals, has it in place and environmental management system, does it use the<br />
best available technology to minimize environmental impact, and does it exploit product<br />
diversification and alternatives which would reduce intervention in peatlands?<br />
The interventions do not take place through a single enterprise with a commercial strategy. Costbenefit<br />
analysis and environmental management systems do not formally exist and the best available<br />
technology is not being applied. Also, government departments potentially able to promote better<br />
environmental practice are not working with the swamp forest farmers. Furthermore, the farmers are<br />
not grouped into an organization through which their activities could be influenced.<br />
Alternatives to reduce pressure on the peatlands have, as yet, not been pursued, although this is<br />
addressed explicitly in this project, and it is hoped that this will lead to an improved situation.<br />
Do those concerned appreciate the importance of dialogue; that there is no single set of concepts or<br />
principles, which can govern every situation; and it is not possible to reduce all complexities to simple<br />
principles or single measures?<br />
The stakeholders appear to appreciate generally the principle of open dialogue. However, as<br />
discussed, there is no forum in place in which different stakeholders can put their values, governing<br />
principles and needs on the table.<br />
5.4.2 Recommendations for revision of the framework of Joosen and Clarke (2002)<br />
The framework consists of 13 different questions, some of which consist of up to four different “subquestions”.<br />
This makes it rather complex, particularly when communicating to a diversity of<br />
stakeholders from a variety of different cultures and with a range of different literacy levels. Thus, it is<br />
recommend that some of the existing questions be consolidated into a more streamlined set of<br />
questions.<br />
The questions are focused on interventions by a single entity consisting of a commercially oriented<br />
enterprise, which generally does not fit the “developing world” situation such as that found at Kosi<br />
Bay. This involves many (several hundred) individuals each undertaking their own independent<br />
157
developments, some of which are commercially driven, but for many the motive is mainly food<br />
production for subsistence purposes. Thus, it is recommended that the questions be revised to make<br />
more explicit reference to:<br />
?? Multi-user systems<br />
?? Common property situations<br />
?? Livelihood issues<br />
5.5 Annex Chapter 5<br />
Table 17. Plates Chapter 5<br />
Plates 1a-n: Cultivated swamp forest<br />
a. Newly cleared swamp forest, with a few<br />
madumbes already being cultivated<br />
b. Recently cleared (2 years ago) plot extensively<br />
cultivated to madumbes, and with widely spaced<br />
banana trees<br />
c. Moderately high level of hydrological<br />
modification, with recently planted madumbes in<br />
left foreground<br />
d. Raised beds with sweet potatoes<br />
158
e. High level of hydrological modification,<br />
resulting from extensive raised beds and drainage<br />
channels<br />
f. “I have been cultivating this plot for more than<br />
50 years“ says this Kosi Bay plot holder<br />
g. Small-scale plot holders who spoke of the<br />
great importance of their plots for the food<br />
security of their families<br />
h. A plot extending from the margin of the wetland<br />
(see left foreground planted to onions) into the<br />
swamp forest in the background<br />
i. An extensively cleared swamp forest area with<br />
only a few very small forest patches remaining<br />
j. A swamp forest area that has been cleared<br />
entirely, and is now planted predominantly to<br />
bananas<br />
159
k.<br />
l. An isolated tree that has been left in a plot, and<br />
has been recently wind-blown<br />
m. A log fence designed to exclude bushpigs n. A moderately drained area, also showing<br />
madumbes in a drainage channel and good ground<br />
cover provided by wild rice grass (Leersia<br />
Plate 2a-d: Cultivation in uplands<br />
hexandra).<br />
a. An upland household garden with a variety of<br />
vegetable for household consumption<br />
b. An upland household garden with onions<br />
growing vigorously under irrigation and manure<br />
application<br />
160
c. An upland field being prepared for groundnuts d. An upland field planted to sweet potatoes<br />
Plate 3a-f: Cultivation on the wetland margin<br />
a. Sweet potatoes planted on raised beds<br />
extending from upland down to the wetland<br />
margin<br />
b. Raised beds on the wetland margin planted to<br />
sweet potatoes<br />
c. A plot holder with her onions in a wetland<br />
margin plot<br />
d. An extensive wetland margin plot planted<br />
mainly to onions<br />
161
e. A wetland margin plot with cassava on the<br />
upslope portion and madumbes on the down<br />
slope portion<br />
f. A wetland margin plot with lattice seedlings and<br />
onions<br />
6 Recommendations for building a common future and promoting wise use<br />
of the swamp forests<br />
6.1 Recommendations for negotiating a common future<br />
It is critical when working together to harmonize different objectives that all individual parties<br />
recognize that the best way to achieve what you need is to help others achieve what they need.<br />
The focus is on developing a common understanding by having all parties lay their values, needs and<br />
problems on the table at the start of the exercise. Parties are then exposed to all possible solutions to a<br />
problem before attempting to select one to implement (Calero and Oskam 1983; Rogers and Bestbier<br />
1999). This is expanded on further in a useful framework for goal setting in multi-party systems<br />
provided by Rogers and Bestbier (1999: pp. 40-43). This style of negotiating contrasts with the<br />
adversarial approach that appears to have characterized the negotiating process at Kosi Bay thus far.<br />
6.2 Recommendations for building awareness<br />
Based on discussions held with farmers during the course of the survey, it is clear that there is a need<br />
for raising awareness and building understanding around the process of peat formation and how this<br />
affected by different land-use options. Any awareness programme would also need to include<br />
information on how local people may benefit directly or indirectly from the various functions of intact<br />
peat forest (e.g. water purification, organic matter accumulation, etc.). It is going to be important raise<br />
awareness that it is the waterlogged (swampy) conditions and organic matter produced by the swamp<br />
forest trees, which build the peat. And it is the peat, which provides the sustenance for the crops.<br />
Destroy the peat forming processes and you destroy the fundamental basis for your agricultural<br />
production! This link is generally not clear to the swamp forest farmer because of the long time<br />
periods over which peat accumulates and the large amounts of peat now available. In many cases, the<br />
peat soils have been built up over thousands of years, and in most swamp forests the peat is usually at<br />
least a meter or two deep, sometimes more. So that even if a farmer is depleting the peat at a rate of a<br />
few centimetres a year, there will still be some productive soil remaining even after two generations of<br />
162
cultivation for the farmer to pass on to his/ her grandchildren. Thus, what we are asking swamp forest<br />
farmers to do is to think four or five generations ahead, which does a tall order for someone often have<br />
to deal with the day-to-day survival of their family.<br />
The Ramsar Convention on Wetlands provides a suite of different guidelines for promoting the wise<br />
use of wetlands. These are likely to be useful for the Kosi Bay situation, in particular the guidelines for<br />
promoting the following.<br />
?? A plan of action for promoting the active participation of local communities, so as to ensure that<br />
the programme is not predominantly top-down, without the meaningful contribution by<br />
landowners/holders (see Ramsar Convention Bureau, 2000a)<br />
?? A communication, education and public awareness programme, which targets those<br />
stakeholders, sectors and users influencing (both directly and indirectly) the state of health<br />
of the catchment’s wetlands (see Ramsar Convention Bureau, 2000b)<br />
6.3 Recommended Best Management Practices<br />
At both a provincial and national level, government departments have clearly been avoiding the issue<br />
of the uncontrolled cultivation of wetlands by small-scale farmers that is taking place widely in South<br />
Africa. There is understandably a hesitancy to interfere (albeit for sound environmental reasons) in the<br />
livelihoods of the rural poor, who have suffered so long from previous unjust and disruptive<br />
government interference. But at the same time government has made little effort to encourage Best<br />
Management Practices. Working with these farmers could been seen as supporting cultivation of<br />
wetlands which is “illegal” in the sense that permission from the necessary authorities has not been<br />
obtained (Kotze 2002). So the farmers are left to their own devices. This reflects very much the<br />
situation concerning swamp forest cultivation in communal lands outside Kosi Bay Nature Reserve.<br />
What are provided below are Best Management Practices for swamp forest cultivation that could be<br />
used by extension workers in improving the sustainability of swamp forest utilization, which would<br />
have primary application outside of the formally protected areas. The GSWPA has recently sanctioned<br />
a community garden in a swamp forest in the KwaDapa area, where these BMPs would also have<br />
application.<br />
Existing disturbed areas should be use in preference to undisturbed areas.<br />
Preliminary observations suggest that the swamp forests are generally able to recover much of their<br />
vegetation structure and species composition, provided that the substrate and hydrology have not been<br />
irreparably altered. However, as the process of swamp forest disturbance and recovery are better<br />
understood, as yet un-described impacts may be revealed. Thus, in the meantime until a better<br />
understanding is gained, it would be wise to adopt a precautionary approach and continue to use only<br />
those areas previously cultivated, in as far as this is practicable.<br />
163
Minimize the level of drainage<br />
The issue of drainage is linked with that of the choice of crop type – the lower the tolerance of the<br />
crop to waterlogging the greater the extent to which drainage will be required in order to cultivate the<br />
crop in the peatland. Crops grown in the peatland should therefore be as tolerant of waterlogging as<br />
possible. Raised beds should be avoided as far as possible as they subject the peat to very high levels<br />
of aeration. This results from three factors:<br />
?? The peat is raised above the water table and is no longer saturated.<br />
?? The spaces between sods (piled up to make the bed) allow air to move into the soil more readily<br />
?? The channels between the beds increase the removal efficiency of water from the site.<br />
Sweet potatoes do not have a high level of tolerance to waterlogging and within CPSF are<br />
characteristically grown on beds raised very high (often > 30 cm) above the original peat surface,<br />
exposing the peat to a high level of desiccation.<br />
Crops with the highest tolerance to waterlogging, namely madumbes, are already being produced<br />
extensively at Kosi Bay. The cultivation of madumbes is preferred over cultivation of sweet potatoes,<br />
which should be confined to the wetland margins.<br />
The bananas grown at Kosi Bay appear to have an intermediate level of tolerance to waterlogging.<br />
Bananas should be grown as much as possible on mounds built up through incorporation of weed and<br />
crop residues rather than lowering the water table through drainage or through creation of raised beds<br />
and planting on these.<br />
Thompson and Hamilton (1983) warn against the dangers of “over-draining” peatlands.<br />
“Although the process if reclamation is often simple, quite complex precautions must often be taken to<br />
keep the land in a stable condition. The problem known as “black death” was first encountered in<br />
Rwanda (Berg 1950). During drying out, water evaporated from the surface is replaced by water<br />
drawn from the water table. If the drains have been scoured too deep, after five or six years a<br />
“perched” water table develops; further drying then takes place extremely rapidly from below and the<br />
swamp degenerates into a dusty desert. Once a peaty soil is completely dry, texture cannot be<br />
recovered by re-wetting. To avoid the “black death” problem, water tables are maintained at 50 cm<br />
depth.”<br />
Leave the wettest (or other sensitive) areas under natural vegetation<br />
The wetter the area, the greater the level of drainage required for the cultivation of a given crop and<br />
therefore the greater the impact on the peat resource and the wetland. Certain areas of swamp forest<br />
may also be considered particularly sensitive for biodiversity reasons (e.g. the presence of a breeding<br />
Red Data species such as Pel’s Fishing Owl [Scotopelia peli]) (see Section 2).<br />
Minimize the frequency of disturbance<br />
Perennial crops such as bananas are the most preferred and annual root crops, which require<br />
disturbance for planting and harvesting, are probably the least preferred from this perspective.<br />
164
Allowing crop lands to rest/lie fallow<br />
The benefits of including rest/ fallow periods would apply particularly to areas subject to relatively<br />
high levels of drainage and/ or frequent disturbance. The greater the proportion of time that the area is<br />
rested, the greater will be the level of peat regeneration. Even short rests of a few years would be<br />
favourable for peat regeneration provided that the overall proportion of time rested was not very low<br />
relative to the time under cultivation. From a biodiversity point of view, the period of each individual<br />
rest would be much more critical. The longer the rest period, the more favourable it will be, in that<br />
species or features adapted to later successional stages of recovery of the forest would require several<br />
years, possibly decades or more, for conditions to become favourable for their establishment and<br />
perpetuation.<br />
For fallow periods to be most effective, drains should be plugged and filled with crop/weed residues<br />
(see following two items).<br />
Plugging of any artificial drains during fallow periods<br />
At present, when a wetland plot is rested, the artificial drains are usually left, as they were when the<br />
area was being cultivated. Although the drains tend to become shallower and less effective with time,<br />
as vegetation becomes established and sediment is trapped and accumulated, they continue to dry out<br />
the area long after crops have stopped being cultivated. In some cases, erosion may, over time, enlarge<br />
the channels further increasing their draining effect, although this does not appear to be occurring<br />
widely at Kosi Bay. The plugging of drains (e.g. with low earth walls running across the drains)<br />
renders them largely ineffective, therefore greatly speeding up the recovery of the peatland.<br />
Maximize the incorporation of crop/weed residues into the peat<br />
Rather than burning or discarding crop/ weed residues, these should be accumulated in wet<br />
depressions, plugged drains and other areas subject to prolonged waterlogging, where the<br />
decomposition of organic material will be retarded.<br />
It must be emphasized that even under optimal conditions, peat accumulates at a very slow rate so peat<br />
cannot be expected to recover in a few years from what was formed over centuries and depleted over<br />
decades.<br />
Seek opportunities for leaving tall canopy tress<br />
By growing crops with a reasonable shade tolerance (e.g. madumbes), it is possible to maintain tall<br />
canopy trees in the area being cultivated. In this way, at least some of the structure, composition and<br />
functioning of the forest is maintained. It should be noted, however, that where a continuous canopy is<br />
broken, leaving the trees much more isolated than before, these trees, in their isolation, are far more<br />
susceptible to being blown over by heavy winds.<br />
6.4 Summary of recommendations<br />
Clearly, there is no one quick-fix solution in sight to addressing the destruction of swamp forest. The<br />
situation is as complex as it is contentious, and the only hope will be an integrated solution<br />
encompassing the following.<br />
165
?? Build effective institutions for achieving reconciliation amongst the different stakeholders, vision<br />
building and consensus on a way forward, which is likely to require outside mediation owing to<br />
the tremendous mistrust that exists amongst the different stakeholders.<br />
?? Revisit and resolve the compensation issue, as much it is going to be a difficult and complex<br />
undertaking which some may feel is a futile dredging up of the past. This will obviously need to<br />
be closely linked with the land claims process that will hopefully be given a nationally high<br />
priority for resolution.<br />
?? Raise awareness and understanding amongst swamp forest users about how peat is formed and<br />
how, in turn, it can be destroyed by particular land-use activities.<br />
?? Promote Best Management Practices for cultivation amongst farmers in the swamp forests, whic h<br />
builds on their enhanced understanding. Examples may include: minimizing the severity of<br />
drainage by confining crops (e.g. sweet potatoes) which require reasonably well drained soils to<br />
the edge of the swamp forest; and resting portions of plots and blocking drains and filling them<br />
with organic matter to assist in the recovery of the peat.<br />
?? Assess the feasibility of different alternatives to swamp forest cultivation, identify those, which<br />
are most promising, and undertake pilot projects to promote these alternatives.<br />
?? Tourism initiatives already being developed need to be closely and sensitively linked with the<br />
swamp forests. New tourism developments at Kosi Bay will be taking place soon (B James 2003.<br />
Pers. comm. Greater St Lucia Wetland Park Authority, St Lucia).<br />
?? Ensure effective protection of designated swamp forest areas and regulation of potentially harmful<br />
activities in these areas. Strong and consistent enforcement with the support of the local leadership<br />
as well as the support of the regional, provincial and national authorities.<br />
?? Provide effective extension support for improving agricultural production outside of the swamp<br />
forest areas (e.g. through enhanced use of nitrogen-fixing crops which help address the problem of<br />
low fertility in the sandy upland soils).<br />
?? Undertake further research in direct support of promoting wise use of swamp forests (see Section<br />
6.5.)<br />
6.5 Recommendations for further research<br />
It is important to highlight that the socio-economic component of this study is by no means an<br />
exhaustive. The questionnaire survey of farmers in their plots was not intensive, and represents<br />
probably no more than 5% of the total number of farmers cultivating in the wetland. Furthermore the<br />
questionnaire did not probe issues around land tenure and control of land-use nor did it probe issues<br />
around the household’s poverty status/vulnerability. Nevertheless, the interviewed farmers were drawn<br />
166
from a wide a variety of socio-economic contexts and geographical areas around the Kosi Lakes, and<br />
it has yielded useful insights regarding on-the-ground utilization of the wetland and resources it<br />
provides, which have provided the basis for reasonably informed recommendations, as well as<br />
highlighting issues requiring further investigation. Even so, further surveying would add to the breadth<br />
of the sample. An important location not covered in the survey is KwaDapa, where the authorities<br />
have sanctioned a community garden in the reserve. Probably more useful than a further more<br />
comprehensive overall survey would be more participatory research integral to designing a way<br />
forward (see following section).<br />
The research project also did not examine the relationship between the Nature Reserve management<br />
staff and the local community, this is investigated by Ravion (1995). While many of the issues remain<br />
much the same as then, new dynamics have developed, for which a better understanding would be<br />
useful.<br />
Participatory Action Research on the social and institutional issues surrounding management<br />
Probably the most urgent research need is for supporting the development and implementation of a<br />
co-management system through an Action Research approach. This approach is useful of assessing<br />
the process of learning and helping to understand the meaning of certain social changes after an<br />
intervention (de Jager 2002). This involves a sequence of steps, including problem diagnosis, action<br />
interventions and reflective learning (Lau 1998). This is then followed by exiting from the study and<br />
extraction of general lessons. In simple terms the stakeholders identify key issues requiring action, do<br />
something to resolve them, see how successful their efforts were, and if not satisfied, tries again<br />
(O’Brien 1998). Through an action learning approach and with reference to the conceptual<br />
framework, the interaction of the researcher/ NGO worker with the case study is described as well as<br />
description of the outcomes of these interactions, the learning that arose from these interactions and<br />
how these learning’s influenced future interactions.<br />
A suggested framework for guiding the research is that of Community Action Research as described<br />
by Senge and Schamer (2001). This embodies the principles of Action Research, in that it is designed<br />
to produce practical knowledge that is useful to people in the everyday conduct of their lives and it<br />
values “knowing-in-action”. In addition, it is characterized by the following.<br />
?? It fosters relationships and collaboration among diverse organizations and those working with<br />
them.<br />
?? It creates settings for collective reflection that enable people from different organizations to “see<br />
themselves in one another”<br />
?? It aims explicitly to leverage progress in individual organizations<br />
It is recognized from the outset that the issues addressed by the study will be complex. The framework<br />
of Senge and Schamer (2001) should be referred to in trying to better make sense of this complexity.<br />
Senge and Schamer (2001) recognize three different types of complexity, which need to be accounted<br />
for.<br />
?? Dynamic complexity, which refers to the extent to which cause and effect are distant in space and<br />
time<br />
167
?? Behavioural complexity, which refers to the diversity of mental models, values, aims and political<br />
interests of the players<br />
?? Generative complexity, which arises out of the tension between the ‘current reality’ and ‘emerging<br />
realities’<br />
It is suggested also that Participatory Action Research (PAR) methods be used for interacting with<br />
local people. This method derives some of its rationale from both Participatory Rural Appraisal and<br />
Rapid Rural Appraisal. The emphasis of PAR is on participation, capability building and ownership of<br />
knowledge and empowerment. It works directly with local and development capacities to bring visible<br />
organizational structures, effective local advocacy and a durable change in power relations (Chambers<br />
1994). Furthermore, it will be important to draw on the experiences and the extensive body of<br />
literature on “People and Parks” and Conservation and the Rural Poor (see for example, Shackleton et<br />
al. 1999).<br />
Impacts of different land-use practices on peat accretion rates<br />
Hydrological impacts of different land-use scenarios<br />
Hydrological modelling will be required to predict the consequences of different scenarios of peat<br />
accretion and land cover on the volumes and timing of fresh water feeding the lakes.<br />
Investigation of the practicability of different potential alternatives to swamp forest cultivation<br />
In Section 5.4, several potential alternatives to swamp forest cultivation were discussed. The<br />
feasibility of these were not, however, assessed in any detail. It is important that this be done before<br />
any pilot projects be embarked upon.<br />
7. References<br />
Adams, W.M. (2001): Green Development: Environment and sustainability in the Third World -<br />
Routledge, London<br />
AFRA (1990): Maputaland: Conservation and Removals - Special Report No.6. Association for Rural<br />
Advancement (AFRA), Pietermaritzburg<br />
Avery, G. (1980): Palaeontology and archaeology of Maputaland – In: Bruton, M.N. and Cooper, K.H.<br />
(1980): Studies on the Ecology of Maputaland – Rhodes University and the Natal Branch of The<br />
Wildlife Society of Southern Africa, Durban; Cape and Transvaal Printers (Pty) Ltd, Cape Town<br />
Barker, N. (1997): The Battle for St Lucia is far from over - Mail and Guardian 14-20 November<br />
Barnes, K.N. (ed). 2000. The Eskom Red Data Book of birds of South Africa, Lesotho and Swaziland<br />
- BirdLife South Africa, Johannesburg<br />
Beaumont, P.B., Hertha de Villiers and Vogel, J.C. (1978): Modern man in sub-Saharan Africa prior<br />
to 49 000 years B.P.: a review an evaluation with particular reference to Border Cave – S.Afr.J.Sci.<br />
74; pp. 409-419<br />
168
Begg, G. W. (1978): The Estuaries of Natal - Natal Town and Regional Planning Report No 41<br />
Begg, G. W. (1980): The Kosi System - In: Bruton, M. N. and Cooper, K. H. (eds.): Studies on the<br />
ecology of Maputaland; Cape and Transvaal Printers, Cape Town<br />
Berg, C. L. (1950): Swamp reclamation and irrigation - Annu. Rep. Uganda Gov. Dep. Hydrol. Surv.;<br />
1950; pp. 7-8<br />
Bradbury, H. (2001): Learning with The Natural Step: Action Research to Promote Conversions for<br />
Sustainable Development - In: Reason, P. and Bradbury, H. (eds.): Handbook of Action Research -<br />
SAGE Publications; London<br />
Breen, C.; Dzingirai. V. and Jaganyi J. (undated): Institutionalizing diagnostic research and<br />
professional training on CBNRM within the Centre for Environment and Development (CEAD)<br />
University of Natal: Recreating the validity of CBNRM through the review of case studies in<br />
southern Africa – CEAD; University of Natal; Pietermaritzburg<br />
Bruton, M.N. and Cooper, K.H. (1980): Studies on the Ecology of Maputaland – Rhodes University<br />
and the Natal Branch of The Wildlife Society of Southern Africa, Durban; Cape and Transvaal<br />
Printers (Pty) Ltd, Cape Town<br />
Calero, H. and Oskam, B. (1983): Negotiate for what you want: talking your way to success in<br />
business, community affairs and personal encounters – Thorsons; Wellingborough<br />
Chambers, R. (1994): Participatory Rural Appraisal (PRA): Analysis of experience - World<br />
Development 22; pp. 1253-1268<br />
Claridge, G. (2000): What is Successful Co-management? - In: Claridge, G. (ed.): Community<br />
Involvement in Wetland Management. The manual based on the papers presented in workshop 3:<br />
Wetlands, Local people and Development of the International Conference on Wetlands and<br />
Development - Kuala Lumpur; Wetlands International<br />
Claridge., G. (2000): What Do We Mean by Community Involvement? - In: Claridge, G. (ed.):<br />
Community Involvement in Wetland Management. The manual based on the papers presented in<br />
workshop 3: Wetlands, Local people and Development of the International Conference on Wetlands<br />
and Development - Kuala Lumpur; Wetlands International<br />
Clymo, R.S. (1983): Peat - In: Gore, A.J.P. (ed.): Ecosystems of the world 4B. Mires: Swamp, Bog,<br />
Fen and Moor - Elsevier Scientific Publishing Company; Amsterdam; pp 159-221<br />
Cowan, G.I. and Marneweck, G.C. (1996): South African National Report to the Ramsar Convention -<br />
Department of Environmental Affairs and Tourism; Pretoria<br />
Critchley, W. and E. Netshikovhela (1998): Traditions of Soil and Water Conservation and<br />
Perceptions of Erosion: a Case Study from Thohoyandou District – In: Critchly, W.; Mollel, N. and<br />
Versfeld, D. (eds.): Sustainable Land Management: Some Signposts for South Africa - Land<br />
Management and Ruarl Development Programme; University of the North Press; University of the<br />
North, Northern province; pp. 69-81<br />
Cyrus, D. and Robson, N. (1980): Bird Atlas of Natal - University of Natal Press; Pietermaritzburg<br />
169
Davion, R. (1995): Community-Reserve Interaction in Natal Parks Board and KwaZulu Department of<br />
Nature Conservation – Giant’s Castle and Kosi Bay Studies; MSc thesis; University of Natal;<br />
Pietermaritzburg<br />
De Jager, A. (2002): An Intergrated and Holistic Approach to Assessment in Outcome-based learning<br />
in South Africa - Hagar.up.ac/catts/dessertation.html<br />
Dugan., P. (ed.) (1990): Wetland Conservation: A Review of Current Issues and Required Action –<br />
IUCN; Gland; Switzerland<br />
Felgate, W. S. (1965): An ecological study of the Thembe-Thonga of Natal and Mozambique<br />
Goodman, P. (1990): Soil, vegetation and large herbivore relations in Mkuzi Game Reserve, Natal –<br />
PHD Thesis; University of Witwatersand; Johannesburg<br />
Grundling, P.-L. (1994): 'n Regionale studie van die veenafsettings net suid van Sibayi-meer, Noord<br />
Kwa Zulu/Natal - Council for Geoscience, Internal. Report No. 1994-0122, pp. 57<br />
Grundling, P.-L. (1996b): Sustainable Utilisation of Peat in Maputaland, KwaZulu-Natal, South Africa<br />
- In: Lüttig, G.W. (ed.): Abstracts of the 10th International Peat Society Congress - May 1996;<br />
Bremen; 1; p. 6<br />
Grundling, P.-L. (2002): The Quaternary Peat Deposits Of Maputaland, Northern Kwazulu-Natal,<br />
South Africa: Categorisation, Chronology And Utilisation - MSc Thesis, Rand Afrikaans University<br />
Grundling, P.-L.; Baartman, L.; Mazus, H. and Blackmore, A. (2000): Peat resources of KwaZulu-Natal<br />
wetlands: Southern Maputaland and the North and South Coast - Council for Geoscience; Report no:<br />
2000-0132<br />
Grundling, P.-L.; Mazus, H. and Baartman, L. (1998): Peat resources in northern KwaZulu-Natal<br />
wetlands: Maputaland – Research Report Series; South African Wetlands Conservation Programme;<br />
Department of Environmental Affairs and Tourism; Pretoria<br />
Hara, M. (2000): Could co-management provide a solution to the problems of artisanal fisheries<br />
management on the south-eastern arem of Lake Malawi? - PHD Thesis, University of Western Cape,<br />
Cape Town<br />
Harrison, J.A.; Allan, D.G.; Underhill, L.G.; Herremans, M.; Tree, A.J.; Parker, V. and Brown, C.J.<br />
(eds.) (1997): The Atlas of Southern African Birds. Vols 1 (Passerines) and 2 (Non-passerines);<br />
BirdLife South Africa; Johannesburg<br />
Herrington, S. (producer) (2003): Greater St Lucia Wetland Park, 50/50 Programme screened March<br />
23, 2003 - Interviewer: R Crompton; SABC; Johannesburg<br />
Hill, M.O. and Gauch, H.G. (1980): Detrended correspondence analysis: an improved ordination<br />
technique - Vegetatio 42: 47-58<br />
Hobday, D.K. (1979): Geological evolution and geomorphology of the Zululand coastal plain - In:<br />
Allanson, B.R. (ed.): Lake Sibaya - Monographiae Biological; W. Junk Publishers; London; 36; pp.<br />
1-20<br />
170
Hobday, D.K. and Orme, A.R. (1979): The Port Dunford Formation: A major Pleistocene barrier<br />
lagoon complex along the Zululand coast - Trans. Geol. Soc. S. Afr., 77; pp. 141-149<br />
Hulme, D. and Murphree, M. (2001): African Wildlife and Livelihoods: The Promise and Performance<br />
of Community Conservation - James Currey; Oxford<br />
Immirzi, C.P. and Maltby, E. with Clymo, R.S. (1992): The Global Status of Peatlands and their Role<br />
in Carbon Cycling – A <strong>report</strong> for Friends of the Earth by the Wetlands Ecosystems Research Group,<br />
Department of Geography, University of Exeter. Friends of the Earth, London<br />
Joosen, H. and Clarke, D. (2002): Wise use of mires and peatlands – background principles including<br />
a framework for decision-making; International Mire Conservation Group and International Peat<br />
Society; Saarijärvi; Finland<br />
Kemmis, S. and McTaggart, R. (2000): Participatory Action Research - In: Denzen, N.K. and Lincoln,<br />
Y.S. (eds.): Handbook of Qualitative Research - 2nd Edition; SAGE Publications; London<br />
Kotze, D.C. (2002): Wetland cultivation and the rural poor in South Africa: reconiling conflicting<br />
needs - Food and Agriculture Organization of the United Nations, Sub-Regional Office for East and<br />
Southern Africa; Harare<br />
Kotze, D.C. and Silima, V. (2003): Wetland Cultivation: Reconciling the Conflicting Needs of the<br />
Rural Poor and Society at Large Through Wise Wetland use – In: Gopal, B.; Pathak, P.S.; Raman,<br />
A. and Lee, S.Y. (eds.): Special issues: Wetlands and Agriculture - International Journal of Ecology<br />
and Environmental Sciences (1); vol. 29; pp. 85-88<br />
Kotze, D.C., (2001): Promoting crafts woven from wetland plants - LandCare South Africa, Pretoria<br />
Kotze, D.C.; Breen, C.M. and Klug, J.R. (2000): Wetland-use: a wetland management decision<br />
support system for South African freshwater palustrine wetlands - Department of Environmental<br />
Affairs and Tourism; Pretoria<br />
Kotze, D.C.; Memela, B.; Fuzani, N. and Thobela, M. (2002): Utilization of the Mbongolwane<br />
wetland in KwaZulu-Natal, South Africa - International Water Management Institute, Pretoria<br />
Kyle, R. (1986): Aspects of the Ecology and Exploitation of the Fishes of the Kosi Bay System,<br />
KwaZulu, South Africa - University of Natal Press; Pietermaritzburg<br />
Kyle, R. (1995): Wise use of wetlands by rural indigenous people. The Kosi Bay Nature Reserve: A<br />
case study - In: Cowan, G. (ed.): Wetlands of South Africa - Department of Environmental Affairs<br />
and Tourism; Pretoria<br />
KZNNCS (2000): Eastern Shores: Emoyeni Trail - KZNNCS Ecotourism and Marketing<br />
Landman, T. (2003): Advanced wetland modelling: As a part of the National Land Cover 2000 Project<br />
(NLC) – South African Wetland Action Group Symposium; Barberspan; October 2003<br />
Lau, F. (1999): Toward a Framework for Action Research in Information Systems Studies - Business<br />
Faculty; University of Alberta; Canada; Information Technology and People, 12 (2). Pp. 148-175<br />
Low, A.B. and Rebelo, A.G. (1996): Vegetation map of South Africa, Lesotho and Swaziland -<br />
Department of Environmental Affairs and Tourism<br />
171
Lubbe, R.A. (1997): Vegetation and Flora of the Kosi Bay Coastal Forest Reserve in Maputaland,<br />
northern KwaZulu-Natal, South Africa - Magister Scientiae in the Faculty of Biological and<br />
Agricultural Sciences (Department of Botany); University of Pretoria<br />
Maclean, G.L. (1993): Roberts’ Birds of Southern Africa – Sixth edition; John Voelcker Bird Book<br />
Fund; Cape Town<br />
Maud, R.R. (1980): The climate and geology of Maputaland – In: Bruton, M.N. and Cooper, K.H.<br />
(1980): Studies on the Ecology of Maputaland – Rhodes University and the Natal Branch of The<br />
Wildlife Society of Southern Africa, Durban; Cape and Transvaal Printers (Pty) Ltd, Cape Town;<br />
pp. 1-7<br />
Meadows, M.E. (1985): Biogeography and ecosystems of South Africa – Juta, Cape Town<br />
Moll, E. J. and White, F. (1978): The Indian Ocean coastal belt – In: Werger, M.J.A. (ed.):<br />
Biogeography and Ecology of Southern Africa - Junk, The Hague; pp. 562-598<br />
Moll, E.J. (1977): The vegetation of Maputaland - a preliminary <strong>report</strong> of the plant communities and<br />
their present and future conservation status - Trees in South Africa, 29; pp. 31-58<br />
Moll, E.J. (1980): Terrestrial plant ecology - In: Burton, M.N. and Cooper, K.H. (eds.): Studies on the<br />
ecology of Maputaland, Rhodes University and Wildlife, pp. 52-68<br />
Murombedzi, J. (1999): Land expropriation, communal tenure and community-based natural resource<br />
management in southern Africa - Common Property Digest 50; pp. 1-4<br />
Myers, M.D. (1997): Qualitative Research in Information Systems - MIS Quartely (21:2), June 1997,<br />
pp. 241-242; MISQ Discovery, archival version, June 1997, www.mis.org/misqd961/. MISQ<br />
Discovery, updated version, last modified: July 03, 2003 www.qual.auckland.ac.nz<br />
Nduli, N. and Versfeld, D. (1998): The Need for a Communtiy-based Land management Movement in<br />
South Africa – In: Critchly, W.; Mollel, N. and Versfeld, D. (eds.): Sustainable Land Management:<br />
Some Signposts for South Africa - Land Management and Rural Development Programme;<br />
University of the North Press; University of the North, Northern province; pp. 54-68<br />
Ngubane, P. (2003): Kosi Solution in sight - Wetland Wire, Newsletter of Greater St Lucia Wetland<br />
Authority<br />
Pooley, E. (1993): The complete field guide to trees of Natal, Zululand and Transkei - Natal Flora<br />
Publications Trust; Durban<br />
Ramsar Convention Bureau (2000a): Ramsar handbooks for the wise use of wetlands, Handbook 5:<br />
Establishing and strengthening local communities’ and indigenous people’s participation in the<br />
management of wetlands - Ramsar Convention Bureau; Gland; Switzerland<br />
Ramsar Convention Bureau (2000b): Ramsar handbooks for the wise use of wetlands, Handbook 6:<br />
Promoting the conservation and wise use of wetlands through communication, education and public<br />
awareness – The Outreach Programme of the Convention on Wetlands; Ramsar Convention Bureau;<br />
Gland; Switzerland<br />
Reader, J. (1997): Africa a Biography of the Continent - Penguin Books, London<br />
172
Robson, N.F. and Horner, R.F. (1996): The birds of the Ozabeni section of the Greater St Lucia<br />
Wetland Park - Unpublished Report<br />
Rogers, K.H. and Bestbier, R. (1997): Development of a protocol for the definition of the desired<br />
future state of riverine systems in South Africa - Department of Environmental Affairs and Tourism,<br />
Pretoria<br />
Sapsford, P. (undated): AFRA Research Programme on the relationship between tenure rights and the<br />
conservation/ tourism sector - The MIDNET Newsletter No 124; pp. 2-7<br />
Senge, P.M. and Schamer, O. (2001): Community Action Research: Learning as a Community of<br />
Practitioners, Consultants and Researchers - In: Reason, P. and Bradbury, H. (eds.): Handbook of<br />
Action Research; SAGE Publications; London<br />
Shackleton, S.E., Shackleton C.C. and Cousins, B. (1999): The economic value of land and natural<br />
resources to rural livelihoods: case studies from South Africa - In: Cousins, B. (ed.): At the<br />
crossroads: Land and Agrarian reform in South Africa into the 21st Century - Papers from a<br />
Conference at the Alpha Training Centre, Broedestroom, Pretoria; 26-28 July, 1999; PLAAS<br />
(Programme for Land and Agrarian Studies) and National Land Committee<br />
Shanley, B.M.G. (1966): The protein nutritional value of selected Natal food plants - PHD Thesis,<br />
University of Natal, Durban<br />
Smuts, W.J. (1992): Peatlands of the Natal Mire Complex: geomorphology and characterization - S.<br />
Afr. J. Sci., 88; pp. 474 - 483<br />
Stattersfield, A. J.; Crosby, M. J.; Long, A. J. and Wedge, D. C. (1998): Endemic Bird Areas of the<br />
World. Priorities for biodiversity conservation - BirdLife Conservation Series No. 7. BirdLife<br />
International, Cambridge, United Kingdom<br />
Taylor, P.B. (1997): South African palustrine wetlands: the results of a survey in summer 1995/ 96 -<br />
ADU Research Report No. 24; Avian Demography Unit; University of Cape Town<br />
Taylor, P.B. and Grundling P.-L. (2003): The importance of South African mires as habitat for the<br />
endangered White-winged Flufftail (Sarothrura ayresi) - International Mire Conservation Group<br />
Newsletter; July 2003<br />
Thompson, K. and Hamilton, A.C. (1983): Peatlands and swamps of the African continent - In: Gore,<br />
A.J.P. (ed): Ecosystems of the world 4B. Mires: Swamp, Bog, Fen and Moor - Elsevier Scientific<br />
Publishing Company; Amsterdam; pp 331-373<br />
van Wyk, A.E. (1994): Biodiversity of the Maputaland Centre - In: Van der Masen, L.J.G.; van der<br />
Burgt, X.M. and van Medenbach de Rooy, J.M. (eds.): Biodiversity in African Savannahs - XIVth<br />
AETFAT Congress; 22-27 August 1994; International Conference Centre; Waginingen, The<br />
Netherlands; Kluwer Academic Press, Dordrecht; pp. 198-209<br />
van Wyk, A.E. (1994b): Maputaland-Pondoland Region – In: Davis, S.D.; Heywood, V.H. and<br />
Hamilton, A.C. (eds.): Centres of Plant Diversity, a Guide and Strategy for their Conservation - Vol.<br />
1. Information Press, Oxford; pp. 227-235<br />
173
Von Post, L. and Granlund, E. (1926): Södra Sveriges tortillangar I. Sver. geol Unders., Arsb. 19, Ser.<br />
C, No 335, Stockholm<br />
Watkeys, M. K.; Mason, T. R. and Goodman, P. S. (1993): The role of geology in the development of<br />
Maputaland, South Africa - Journal of African Earth Sciences 16; pp. 205-221<br />
Webster, D.J. (1986): The Political Economy of Food Production and Nutrition in Southern Africa in<br />
Historical Perspective - Journal of Modern African Studies, 24; 3; p. 456<br />
Wells, M. and Brandon, K. (1992): People and parks: linking protected area management with local<br />
communities - World Bank, Washington DC<br />
Werger, M.J.A. (1974): On the concepts and techniques applied in the Zürich-Montpellier method of<br />
vegetation survey - Bothalia 11(3); pp. 309-332<br />
Wessels, N.G. (1997): Aspects of the Ecology and Conservation of Swamp Forests in South Africa -<br />
MSc. Dissertation Technikon Port Elizabeth; unpublished<br />
White, F. (1976a): The vegetation map of Africa: the history of a completed project – Boissiera 24; pp.<br />
659-666<br />
White, F. (1983): The vegetation of Africa, a descriptive memoir to accompany the UNESCO/<br />
AETFAT/ UNSO Vegetation Map of Africa - (3 Plates, North-western Africa, Northeastern Africa,<br />
and Southern Africa, 1:5,000,000); UNESCO, Paris<br />
WWF (2001): Kirkwood, D.: Maputaland Coastal Forest Mosaic (AT0119) - WWF Terrestrial<br />
Ecoregions; http://www.worldwildlife.org/wildworld/profiles/terrestrial/at/at0119_full.html<br />
Zakrzewski, M. (1988): Conservation in Maputaland: The Facts - KwaZulu Bureau of Natural<br />
Resources, Ulundi<br />
174