RW I:Discussion Papers - Rheinisch-Westfälisches Institut für ...
RW I:Discussion Papers - Rheinisch-Westfälisches Institut für ...
RW I:Discussion Papers - Rheinisch-Westfälisches Institut für ...

You also want an ePaper? Increase the reach of your titles
YUMPU automatically turns print PDFs into web optimized ePapers that Google loves.
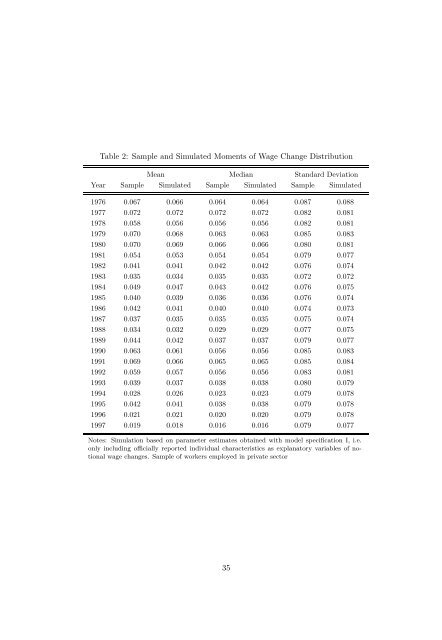
Table 2: Sample and Simulated Moments of Wage Change Distribution<br />
Mean Median Standard Deviation<br />
Year Sample Simulated Sample Simulated Sample Simulated<br />
1976 0.067 0.066 0.064 0.064 0.087 0.088<br />
1977 0.072 0.072 0.072 0.072 0.082 0.081<br />
1978 0.058 0.056 0.056 0.056 0.082 0.081<br />
1979 0.070 0.068 0.063 0.063 0.085 0.083<br />
1980 0.070 0.069 0.066 0.066 0.080 0.081<br />
1981 0.054 0.053 0.054 0.054 0.079 0.077<br />
1982 0.041 0.041 0.042 0.042 0.076 0.074<br />
1983 0.035 0.034 0.035 0.035 0.072 0.072<br />
1984 0.049 0.047 0.043 0.042 0.076 0.075<br />
1985 0.040 0.039 0.036 0.036 0.076 0.074<br />
1986 0.042 0.041 0.040 0.040 0.074 0.073<br />
1987 0.037 0.035 0.035 0.035 0.075 0.074<br />
1988 0.034 0.032 0.029 0.029 0.077 0.075<br />
1989 0.044 0.042 0.037 0.037 0.079 0.077<br />
1990 0.063 0.061 0.056 0.056 0.085 0.083<br />
1991 0.069 0.066 0.065 0.065 0.085 0.084<br />
1992 0.059 0.057 0.056 0.056 0.083 0.081<br />
1993 0.039 0.037 0.038 0.038 0.080 0.079<br />
1994 0.028 0.026 0.023 0.023 0.079 0.078<br />
1995 0.042 0.041 0.038 0.038 0.079 0.078<br />
1996 0.021 0.021 0.020 0.020 0.079 0.078<br />
1997 0.019 0.018 0.016 0.016 0.079 0.077<br />
Notes: Simulation based on parameter estimates obtained with model specification I, i.e.<br />
only including officially reported individual characteristics as explanatory variables of notional<br />
wage changes. Sample of workers employed in private sector<br />
35