RW I:Discussion Papers - Rheinisch-Westfälisches Institut für ...
RW I:Discussion Papers - Rheinisch-Westfälisches Institut für ...
RW I:Discussion Papers - Rheinisch-Westfälisches Institut für ...

Create successful ePaper yourself
Turn your PDF publications into a flip-book with our unique Google optimized e-Paper software.
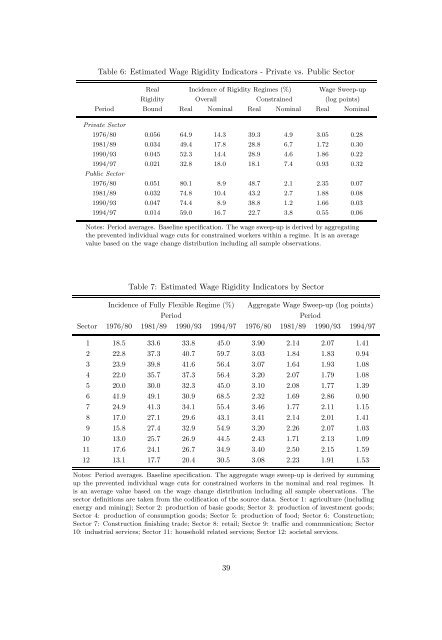
Table 6: Estimated Wage Rigidity Indicators - Private vs. Public Sector<br />
Real Incidence of Rigidity Regimes (%) Wage Sweep-up<br />
Rigidity Overall Constrained (log points)<br />
Period Bound Real Nominal Real Nominal Real Nominal<br />
Private Sector<br />
1976/80 0.056 64.9 14.3 39.3 4.9 3.05 0.28<br />
1981/89 0.034 49.4 17.8 28.8 6.7 1.72 0.30<br />
1990/93 0.045 52.3 14.4 28.9 4.6 1.86 0.22<br />
1994/97 0.021 32.8 18.0 18.1 7.4 0.93 0.32<br />
Public Sector<br />
1976/80 0.051 80.1 8.9 48.7 2.1 2.35 0.07<br />
1981/89 0.032 74.8 10.4 43.2 2.7 1.88 0.08<br />
1990/93 0.047 74.4 8.9 38.8 1.2 1.66 0.03<br />
1994/97 0.014 59.0 16.7 22.7 3.8 0.55 0.06<br />
Notes: Period averages. Baseline specification. The wage sweep-up is derived by aggregating<br />
the prevented individual wage cuts for constrained workers within a regime. It is an average<br />
value based on the wage change distribution including all sample observations.<br />
Table 7: Estimated Wage Rigidity Indicators by Sector<br />
Incidence of Fully Flexible Regime (%) Aggregate Wage Sweep-up (log points)<br />
Period<br />
Period<br />
Sector 1976/80 1981/89 1990/93 1994/97 1976/80 1981/89 1990/93 1994/97<br />
1 18.5 33.6 33.8 45.0 3.90 2.14 2.07 1.41<br />
2 22.8 37.3 40.7 59.7 3.03 1.84 1.83 0.94<br />
3 23.9 39.8 41.6 56.4 3.07 1.64 1.93 1.08<br />
4 22.0 35.7 37.3 56.4 3.20 2.07 1.79 1.08<br />
5 20.0 30.0 32.3 45.0 3.10 2.08 1.77 1.39<br />
6 41.9 49.1 30.9 68.5 2.32 1.69 2.86 0.90<br />
7 24.9 41.3 34.1 55.4 3.46 1.77 2.11 1.15<br />
8 17.0 27.1 29.6 43.1 3.41 2.14 2.01 1.41<br />
9 15.8 27.4 32.9 54.9 3.20 2.26 2.07 1.03<br />
10 13.0 25.7 26.9 44.5 2.43 1.71 2.13 1.09<br />
11 17.6 24.1 26.7 34.9 3.40 2.50 2.15 1.59<br />
12 13.1 17.7 20.4 30.5 3.08 2.23 1.91 1.53<br />
Notes: Period averages. Baseline specification. The aggregate wage sweep-up is derived by summing<br />
up the prevented individual wage cuts for constrained workers in the nominal and real regimes. It<br />
is an average value based on the wage change distribution including all sample observations. The<br />
sector definitions are taken from the codification of the source data. Sector 1: agriculture (including<br />
energy and mining); Sector 2: production of basic goods; Sector 3: production of investment goods;<br />
Sector 4: production of consumption goods; Sector 5: production of food; Sector 6: Construction;<br />
Sector 7: Construction finishing trade; Sector 8: retail; Sector 9: traffic and communication; Sector<br />
10: industrial services; Sector 11: household related services; Sector 12: societal services.<br />
39