Gender Segregation and Gender Wage Differences during the Early ...
Gender Segregation and Gender Wage Differences during the Early ...
Gender Segregation and Gender Wage Differences during the Early ...

Create successful ePaper yourself
Turn your PDF publications into a flip-book with our unique Google optimized e-Paper software.
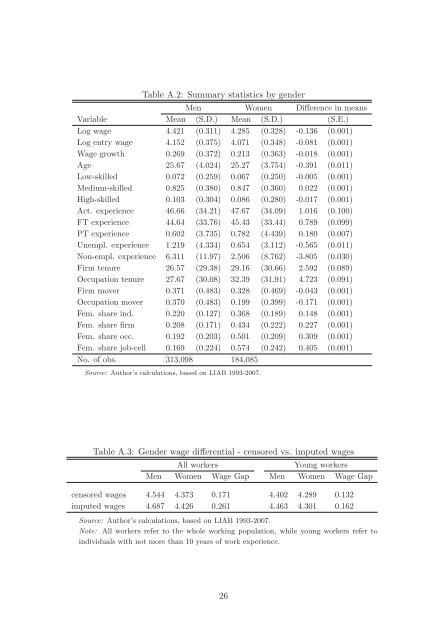
Table A.2: Summary statistics by gender<br />
Men Women Difference in means<br />
Variable Mean (S.D.) Mean (S.D.) (S.E.)<br />
Log wage 4.421 (0.311) 4.285 (0.328) -0.136 (0.001)<br />
Log entry wage 4.152 (0.375) 4.071 (0.348) -0.081 (0.001)<br />
<strong>Wage</strong> growth 0.269 (0.372) 0.213 (0.363) -0.018 (0.001)<br />
Age 25.67 (4.024) 25.27 (3.754) -0.391 (0.011)<br />
Low-skilled 0.072 (0.259) 0.067 (0.250) -0.005 (0.001)<br />
Medium-skilled 0.825 (0.380) 0.847 (0.360) 0.022 (0.001)<br />
High-skilled 0.103 (0.304) 0.086 (0.280) -0.017 (0.001)<br />
Act. experience 46.66 (34.21) 47.67 (34.09) 1.016 (0.100)<br />
FT experience 44.64 (33.76) 45.43 (33.44) 0.789 (0.099)<br />
PT experience 0.602 (3.735) 0.782 (4.439) 0.180 (0.007)<br />
Unempl. experience 1.219 (4.334) 0.654 (3.112) -0.565 (0.011)<br />
Non-empl. experience 6.311 (11.97) 2.506 (8.762) -3.805 (0.030)<br />
Firm tenure 26.57 (29.38) 29.16 (30.66) 2.592 (0.089)<br />
Occupation tenure 27.67 (30.08) 32.39 (31.91) 4.723 (0.091)<br />
Firm mover 0.371 (0.483) 0.328 (0.469) -0.043 (0.001)<br />
Occupation mover 0.370 (0.483) 0.199 (0.399) -0.171 (0.001)<br />
Fem. share ind. 0.220 (0.127) 0.368 (0.189) 0.148 (0.001)<br />
Fem. share firm 0.208 (0.171) 0.434 (0.222) 0.227 (0.001)<br />
Fem. share occ. 0.192 (0.203) 0.501 (0.209) 0.309 (0.001)<br />
Fem. share job-cell 0.169 (0.224) 0.574 (0.242) 0.405 (0.001)<br />
No. of obs. 313,098 184,085<br />
Source: Author’s calculations, based on LIAB 1993-2007.<br />
Table A.3: <strong>Gender</strong> wage differential - censored vs. imputed wages<br />
All workers<br />
Young workers<br />
Men Women <strong>Wage</strong> Gap Men Women <strong>Wage</strong> Gap<br />
censored wages 4.544 4.373 0.171 4.402 4.289 0.132<br />
imputed wages 4.687 4.426 0.261 4.463 4.301 0.162<br />
Source: Author’s calculations, based on LIAB 1993-2007.<br />
Note: All workers refer to <strong>the</strong> whole working population, while young workers refer to<br />
individuals with not more than 10 years of work experience.<br />
26