Gender Segregation and Gender Wage Differences during the Early ...
Gender Segregation and Gender Wage Differences during the Early ...
Gender Segregation and Gender Wage Differences during the Early ...

You also want an ePaper? Increase the reach of your titles
YUMPU automatically turns print PDFs into web optimized ePapers that Google loves.
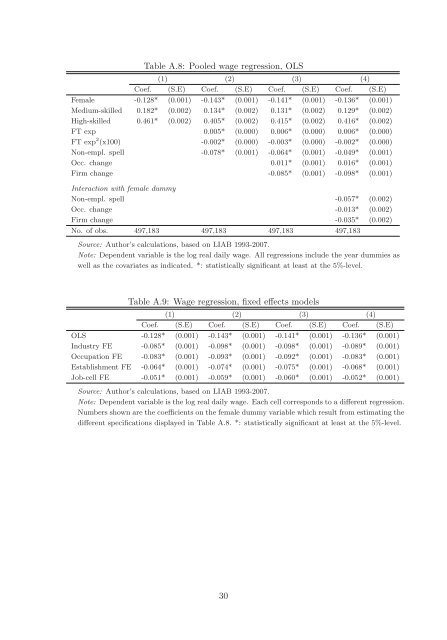
Table A.8: Pooled wage regression, OLS<br />
(1) (2) (3) (4)<br />
Coef. (S.E) Coef. (S.E) Coef. (S.E) Coef. (S.E)<br />
Female -0.128* (0.001) -0.143* (0.001) -0.141* (0.001) -0.136* (0.001)<br />
Medium-skilled 0.182* (0.002) 0.134* (0.002) 0.131* (0.002) 0.129* (0.002)<br />
High-skilled 0.461* (0.002) 0.405* (0.002) 0.415* (0.002) 0.416* (0.002)<br />
FT exp 0.005* (0.000) 0.006* (0.000) 0.006* (0.000)<br />
FT exp 2 (x100) -0.002* (0.000) -0.003* (0.000) -0.002* (0.000)<br />
Non-empl. spell -0.078* (0.001) -0.064* (0.001) -0.049* (0.001)<br />
Occ. change 0.011* (0.001) 0.016* (0.001)<br />
Firm change -0.085* (0.001) -0.098* (0.001)<br />
Interaction with female dummy<br />
Non-empl. spell -0.057* (0.002)<br />
Occ. change -0.013* (0.002)<br />
Firm change -0.035* (0.002)<br />
No. of obs. 497,183 497,183 497,183 497,183<br />
Source: Author’s calculations, based on LIAB 1993-2007.<br />
Note: Dependent variable is <strong>the</strong> log real daily wage. All regressions include <strong>the</strong> year dummies as<br />
well as <strong>the</strong> covariates as indicated. *: statistically significant at least at <strong>the</strong> 5%-level.<br />
Table A.9: <strong>Wage</strong> regression, fixed effects models<br />
(1) (2) (3) (4)<br />
Coef. (S.E) Coef. (S.E) Coef. (S.E) Coef. (S.E)<br />
OLS -0.128* (0.001) -0.143* (0.001) -0.141* (0.001) -0.136* (0.001)<br />
Industry FE -0.085* (0.001) -0.098* (0.001) -0.098* (0.001) -0.089* (0.001)<br />
Occupation FE -0.083* (0.001) -0.093* (0.001) -0.092* (0.001) -0.083* (0.001)<br />
Establishment FE -0.064* (0.001) -0.074* (0.001) -0.075* (0.001) -0.068* (0.001)<br />
Job-cell FE -0.051* (0.001) -0.059* (0.001) -0.060* (0.001) -0.052* (0.001)<br />
Source: Author’s calculations, based on LIAB 1993-2007.<br />
Note: Dependent variable is <strong>the</strong> log real daily wage. Each cell corresponds to a different regression.<br />
Numbers shown are <strong>the</strong> coefficients on <strong>the</strong> female dummy variable which result from estimating <strong>the</strong><br />
different specifications displayed in Table A.8. *: statistically significant at least at <strong>the</strong> 5%-level.<br />
30