Wind Load Analysis - CPP
Wind Load Analysis - CPP
Wind Load Analysis - CPP

You also want an ePaper? Increase the reach of your titles
YUMPU automatically turns print PDFs into web optimized ePapers that Google loves.
Shawn Schreiner<br />
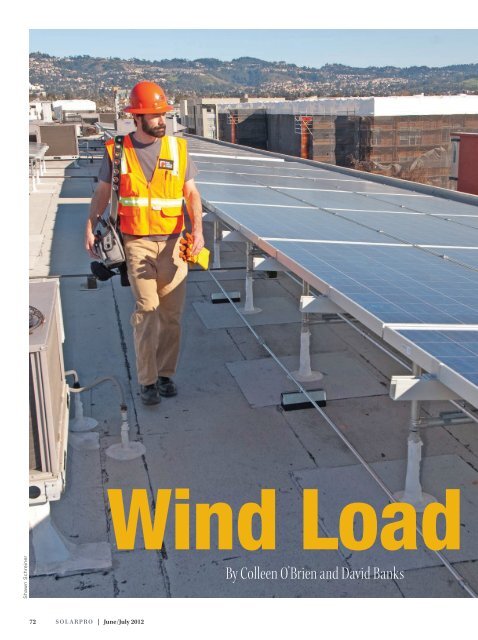
<strong>Wind</strong> <strong>Load</strong><br />
By Colleen O’Brien and David Banks<br />
72 SolarPro | June/July 2012
PV modules mounted to racks or trackers should be designed<br />
to withstand wind forces as prescribed in the building codes,<br />
like any other important structure. However, there is a significant<br />
challenge in applying existing codes to commercial and<br />
industrial roof-mounted PV arrays.<br />
Everyone is familiar with the potentially destructive<br />
forces that wind can exert on structures,<br />
whether from video footage or firsthand experience<br />
with structural damage from strong winds.<br />
The wind load on a structure depends on many<br />
factors, including the wind speed, the wind characteristics<br />
(turbulence and velocity profile), the geometry of<br />
the structure, the effect of surrounding objects and the height<br />
above the ground, to name just a few. A structural engineer<br />
must calculate wind forces or loads to ensure that a structure<br />
can resist wind conditions at a particular location.<br />
The engineer should always determine wind loads on PV<br />
systems, even if local building departments do not require<br />
such an analysis. <strong>Wind</strong>-related failures of both roof- and<br />
ground-mounted systems have occurred—and more can<br />
be expected because wind loads are poorly understood. The<br />
spread of solar energy will depend on favorable public opinion,<br />
and a poor safety record is counterproductive. The longterm<br />
success of the solar industry depends on the deployment<br />
of systems that are structurally engineered to meet building<br />
codes. Unfortunately, this is not as easy as it sounds.<br />
In this article, we discuss wind loads on sloped PV modules<br />
installed on standard open racks on a flat or low-slope<br />
roof. We also provide high-level guidance for other types of<br />
systems. We present some fundamentals of wind loading on<br />
rooftop PV systems, as well as challenges associated with<br />
applying existing building codes to this type of system. While<br />
building codes will eventually include improved guidelines<br />
<strong>Analysis</strong><br />
for determining wind loads on PV systems, the<br />
process of developing these guidelines is likely<br />
to take years. Until then, structural engineers<br />
need strategies to reduce the guesswork in estimating<br />
wind loads, particularly for sloped PV<br />
modules on flat roofs, because building codes<br />
are least applicable to this type of system.<br />
With support from its parent company, Det<br />
Norske Veritas (DNV), and its wind engineering<br />
partner, <strong>CPP</strong>, BEW Engineering has developed<br />
an analytical approach for determining<br />
wind loads on sloped PV systems mounted on<br />
flat and low-slope roofs. BEW analyzed the results of thousands<br />
of wind tunnel tests in the process of developing this<br />
method. While this approach is more complex than typical<br />
ACSE 7 methods, the partnership developed a free online<br />
design tool for designers and engineers to simplify the process<br />
and expedite the analysis. Here we discuss how this tool<br />
works and how to apply the results.<br />
The Building Code and PV<br />
While all US building codes have sections on wind loading,<br />
it is widely accepted that the most comprehensive guide for<br />
estimating wind loads on structures is Standard No. 7 of<br />
the American Society of Civil Engineers (ASCE), Minimum<br />
Design <strong>Load</strong>s for Building and Other Structures (ASCE 7). All<br />
other building codes allow for the use of this ASCE standard.<br />
The latest edition of this standard is ASCE 7-10, the 2010<br />
edition. However, ASCE 7-10 has not been widely adopted,<br />
and the 2005 edition is still mainly in use. Therefore, we reference<br />
ASCE 7-05 in this article. By the time ASCE 7-10 is<br />
widely adopted, it is likely that a broader range of publicly<br />
available wind tunnel data will be available that will improve<br />
upon the methods described in this article. The wind loading<br />
content found in ASCE 7 was primarily developed to calculate<br />
wind loads on buildings, though a small subset of other<br />
structures, such as billboards and chimneys, is included. As<br />
a result, building codes do not provide clear guidance on<br />
how to calculate wind loads<br />
on PV arrays, unless these are<br />
shaped like buildings—for<br />
instance, PV carports.<br />
With proper guidance—<br />
see “<strong>Wind</strong> <strong>Load</strong> <strong>Analysis</strong> Recommendations<br />
by PV System<br />
Type” (p. 90)—designers and<br />
engineers applying ASCE 7-05<br />
for Commercial Roof-Mounted Arrays<br />
solarprofessional.com | SolarPro 73
<strong>Wind</strong> <strong>Load</strong> <strong>Analysis</strong><br />
Courtesy BEW Engineering<br />
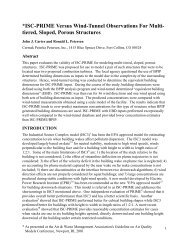
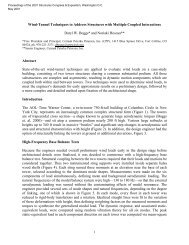
Damage control <strong>Wind</strong> damage investigators determined that the system designer did not follow the racking manufacturer’s<br />
instructions. These avoidable failures are potentially disastrous to an industry that is reliant on favorable public opinion.<br />
methods can do a reasonable job of estimating wind loads on<br />
some flat-plate PV systems. For example, ground-mounted<br />
PV systems are very much like small open buildings—<br />
meaning buildings with no walls, such as carports—closely<br />
spaced together. In addition, wind load patterns on modules<br />
mounted parallel to and close to the roof—as is common<br />
in residential applications—may be estimated by<br />
calculating the loads expected on the exterior of the building<br />
cladding. In many but not all of these cases, building<br />
codes overestimate wind loads on these types of PV systems,<br />
and designers and engineers can use these conservative<br />
results with confidence.<br />
Applying building codes to sloped PV systems on flat<br />
roofs presents significant challenges. While some data are<br />
provided in the ASCE 7 standard related to “rooftop equipment,”<br />
these were developed for equipment with a prismatic<br />
shape, such as chimneys and HVAC units, with no gaps<br />
between the equipment and the roof. These data are not<br />
applicable to roof-mounted PV. Designers are left with nothing<br />
to do but guess which tables and figures—for example,<br />
which building shapes—in the building codes best apply<br />
to PV systems. Many of the choices designers must make<br />
depend upon the type of building classification.<br />
Building classification. ASCE 7-05 has three different classifications<br />
of buildings depending on the porosity of the walls<br />
(Section 6.2): open buildings, enclosed buildings and partially<br />
enclosed buildings. Most buildings are considered either<br />
enclosed or partially enclosed buildings.<br />
The walls of open buildings must be at least 80% open.<br />
Carports are an example. Partially enclosed buildings are<br />
those in which a wall has openings that are larger than the<br />
openings on other walls. In this situation, large positive pressures<br />
can develop inside the building. Enclosed buildings are<br />
buildings that are neither open nor partially enclosed.<br />
PV system classification. Rooftop PV arrays are like very<br />
small open buildings on top of very large enclosed or partially<br />
enclosed buildings. This is unchartered territory for<br />
building codes. Should the engineer apply the loads for a<br />
flat roof to tilted panels on a flat roof ? If so, that ignores<br />
panel tilt. Should the engineer use tilted roof numbers? If<br />
so, which ones: sawtooth or monosloped? Engineers must<br />
make a judgment call on whether to use the PV tilt or roof<br />
tilt, or perhaps some combination of the two. Should they<br />
calculate net design wind pressures using the components<br />
and cladding (C&C) method or the main wind force resisting<br />
system (MWFRS) method? ASCE 7-05 provides no guidance<br />
on these issues.<br />
Whatever method engineers eventually choose, the<br />
resulting wind loads will likely exceed the amount of ballast<br />
that most roofs can support. Further, ballasted systems are<br />
typically engineered with custom aerodynamic features that<br />
the generic application of building codes continued on page 76<br />
74 SolarPro | June/July 2012
<strong>Wind</strong> <strong>Load</strong> <strong>Analysis</strong><br />
cannot address. Therefore, manufacturers of ballasted systems<br />
must often rely on wind tunnel testing to verify that<br />
their systems have adequate wind resistance, particularly<br />
when they have implemented unique design features to<br />
lower the wind loads.<br />
<strong>Wind</strong> tunnel testing. The requirements for proper wind<br />
tunnel testing are spelled out explicitly in Method 3 of<br />
ASCE 7-05. Additional guidelines are found in the article by<br />
Gregory Kopp and others, “Rooftop Solar Arrays and <strong>Wind</strong><br />
<strong>Load</strong>ing: A Primer on Using <strong>Wind</strong> Tunnel Testing as a Basis<br />
for Code Compliant Design per ASCE 7.” (See Resources.)<br />
Unfortunately, it is all too common for wind tunnel testing<br />
to fail to comply with these guidelines.<br />
For example, to perform a wind tunnel test correctly for<br />
a roof-mounted PV system, a model of the building must<br />
be included. The dimensions of the model building and the<br />
parapet height need to be to scale. The slope, row spacing<br />
and height above the roof of the model PV array also must be<br />
to scale. If a friction coefficient is modeled, it should match<br />
that expected on the actual roof.<br />
Further, to model the boundary layer, most tests must be<br />
done at a small scale (1:30 to 1:50). Unless testing was done<br />
at the new Insurance Institute for Business & Home Safety<br />
wind tunnel (see Resources), it is unlikely that tests done at<br />
larger scale or at full scale properly model wind flow. Designers<br />
may wish to hire an independent expert to review wind<br />
tunnel reports from manufacturers. The independent expert<br />
should comment on the compliance with ASCE 7-05 requirements<br />
and the similarity between the models and the fullscale<br />
systems.<br />
When done correctly, however, using wind tunnel tests<br />
to determine wind forces removes the guesswork involved<br />
with applying building codes to PV systems. The wind tunnel<br />
data that we have analyzed suggest that some types of<br />
PV array structures are overdesigned, while others may<br />
be significantly underdesigned relative to expected wind<br />
loads—especially corners and edges of sloped PV arrays on<br />
flat roofs.<br />
<strong>Wind</strong> loads on PV systems. <strong>Wind</strong> flowing over PV systems<br />
applies forces to PV modules, fasteners, the racking system<br />
and the roof, if an array is roof mounted. All wind forces on a<br />
roof- or ground-mounted array must ultimately be transmitted<br />
through the structure to the ground. All of the structural<br />
components in a PV system have limits on how much wind<br />
force they can withstand, so it is critical that wind loads on<br />
PV arrays be determined for every PV system; further, all<br />
structural components in the system should be verified to<br />
resist expected wind loads—not to mention the loads on the<br />
PV module itself or the loads that the entire system transmits<br />
to the roof or ground.<br />
Note that “every PV system” means any size residential,<br />
commercial, or utility-scale system; ballasted or structurally<br />
Rigidity and resonance The small size of most roofmounted<br />
PV structures relative to the building results in<br />
vortex shedding—swirling gusts of wind flowing off the<br />
structure—with significant energy in the 2–3 Hz range. To<br />
avoid dynamic resonance, the PV structure should have a<br />
higher natural frequency than these vortices. If a structural<br />
engineer determines that the natural frequency of the PV<br />
racking system is less than 4 Hz, a dynamic analysis for flexible<br />
structures should be done based on ASCE 7-05.<br />
attached; and rack mounted, flat roof mounted, sloped<br />
roof mounted or ground mounted. Similarly, “all structural<br />
components” includes all fasteners; welds; steel; aluminum,<br />
wood, concrete, plastic and other structural members; and<br />
motors, gears and drive mechanisms for tracking systems.<br />
<strong>Wind</strong> <strong>Load</strong> Fundamentals<br />
The force and pressure of the wind are proportional to the<br />
velocity of the wind squared. The basic equation that converts<br />
wind velocity into pressure is shown in Equation 1:<br />
<strong>Wind</strong> pressure = ½ρ x V 2 x c (1)<br />
where ρ is the density of air, V is the wind velocity, and C is<br />
a dimensionless coefficient that is typically measured for a<br />
specific object.<br />
The equations found in ASCE 7-05 are based on Equation<br />
1 (a fundamental equation from fluid dynamics), where the<br />
coefficient C is referred to as the pressure continued on page 78<br />
Shawn Schreiner<br />
76 SolarPro | June/July 2012
<strong>Wind</strong> <strong>Load</strong> <strong>Analysis</strong><br />
coefficient. The most challenging part to estimating<br />
wind loads on any structure is finding out<br />
which of the many pressure coefficients in ASCE<br />
7-05 should be used. The pressure coefficient<br />
depends on many factors, including the shape of<br />
the structure and the tributary area of the structural<br />
component being analyzed.<br />
Your firsthand experience with the force of the<br />
wind provides some understanding of what makes<br />
an object more or less aerodynamic. The evolution<br />
of the geometrical shape of cars, the curve of airplane<br />
wings, and the tuck of bicyclists and skiers<br />
has largely focused on improving aerodynamics so<br />
that these objects can move through the air with<br />
less resistance. This improvement is measured as a<br />
reduction in the pressure coefficient.<br />
Since force is equal to pressure times the area<br />
over which the pressure is applied, wind force is<br />
determined by multiplying the wind pressure by<br />
a representative area. This area is referred to by<br />
structural engineers as a tributary area and by<br />
ASCE as the effective wind area; see the definition<br />
in Section 6.2 of ASCE 7-05.<br />
The tributary area or effective wind area is generally<br />
understood as the area that a component structurally supports.<br />
For example, if there are four fasteners securing a<br />
4-foot-by-8-foot sheet of plywood to a roof deck, each fastener<br />
has a tributary area equal to the total area of the plywood<br />
divided by the number of fasteners, or 8 square feet.<br />
The effective wind area can also be thought of as the area<br />
over which loads are transmitted and effectively resisted by<br />
the structural system. For PV systems, one way to think of the<br />
effective wind area is this: Suppose the PV array was placed<br />
on a surface without physically restraining the system from<br />
uplift. If one were to lift one PV module in the array, how<br />
much of the system would lift along with it without permanently<br />
damaging any of the components?<br />
More than one effective wind area applies to most PV systems,<br />
depending upon the component under analysis. When<br />
analyzing the racking structure, the effective wind area may be<br />
relatively large—perhaps the area of 5 to 30 modules if the rack<br />
is rigid enough to support the applied loads from this many<br />
modules. However, the fasteners that secure the module to the<br />
rack have a smaller effective wind area. If one PV module is<br />
secured with four fasteners, each fastener has an effective wind<br />
area of one-quarter of the module area. The PV module itself<br />
has an effective wind area equal to the module area.<br />
Components with smaller effective wind areas have<br />
higher wind pressures. This is because wind pressure distributions<br />
on structures vary rapidly with time and location<br />
on the structure. One PV module may be subjected to<br />
a high wind pressure while a module 4 feet away may have<br />
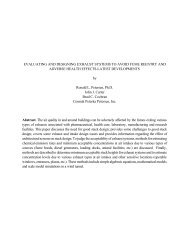
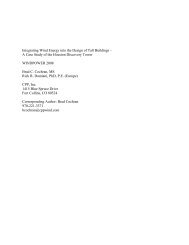
Figure 1 The conical vortices and accelerated flow region associated<br />
with oblique or cornering winds are shown here. The accelerated wind<br />
speeds between the vortices may result in actual wind pressures in<br />
excess of those calculated using typical ASCE 7 methods.<br />
a much lower wind pressure. A rigid rack supporting both<br />
modules may be able to spread the load across the structural<br />
components. However, load sharing across individual PV<br />
modules is limited, and the fasteners that secure modules<br />
to the structure cannot spread loads. Similarly, a PV mounting<br />
system that is insufficiently rigid will not spread loads<br />
over a large area. It is very important to analyze wind loads<br />
on individual PV modules using the effective wind area for<br />
one PV module to ensure that wind loads do not exceed the<br />
module’s rating. There are applications where wind loads in<br />
excess of module ratings are a very real possibility.<br />
As shown in Equation 1 (p. 76), wind force and pressure<br />
on any object is proportional to the wind velocity squared.<br />
Therefore, a wind speed of 60 mph creates wind forces<br />
four times larger than a 30-mph wind. This is important to<br />
remember when considering claims that a product can withstand<br />
a 90- or 120-mph wind speed simply because it survived<br />
a 70- or 80-mph wind event.<br />
In addition, it should be noted that the basic wind speed<br />
provided in the ASCE 7-05 standard for any location in the<br />
US represents the free-stream velocity, which corresponds<br />
with unobstructed flow over open Exposure C terrain (as<br />
defined in ASCE 7-05) at 10 meters above the ground with an<br />
averaging period of 3 seconds. Further, the basic wind speed<br />
values in ASCE 7-05 represent the expected wind speed with<br />
a 50-year recurrence interval.<br />
When you compare ASCE 7-05 wind speeds to measurements<br />
made in the field, be sure that you are comparing<br />
apples to apples. <strong>Wind</strong> sensors placed within an array at<br />
Courtesy <strong>CPP</strong><br />
78 SolarPro | June/July 2012
module height do not provide free-stream velocity measurements.<br />
In fact, a wind speed measurement taken anywhere in<br />
the vicinity of the PV modules could be significantly higher<br />
or lower than the free-stream velocity. <strong>Wind</strong> speeds averaged<br />
over any period other than 3 seconds are not 3-second gust<br />
wind speeds, as defined in the standard. <strong>Wind</strong> speed measurements<br />
taken at different heights and over different averaging<br />
periods can be modified using equations in ASCE 7-05<br />
to determine the equivalent 10-meter, 3-second wind speed.<br />
However, to do this modification, the surrounding objects<br />
must not affect the measurement, and unfortunately this is<br />
almost never the case with wind sensors in PV arrays.<br />
<strong>Wind</strong> <strong>Load</strong>s on Roofs and Rooftop PV<br />
When wind flows around an object, the wind flow becomes<br />
disturbed and its qualities are changed. When wind flows<br />
over a building, this change is dramatic, and the effects of<br />
this disturbed wind flow are very different than for wind flow<br />
across the ground.<br />
Consider a large retail building with a flat roof, classified<br />
as a low-rise building. A low-rise building refers to a<br />
structure of modest height and substantial girth: consumer<br />
retail stores, wholesale clubs, warehouses and distribution<br />
centers are common examples. Large flat or nearly flat (lowslope)<br />
roofs are characteristic of low-rise buildings. Decades<br />
of wind tunnel testing and field measurements have shown<br />
that worst-case wind loads on the roof occur when wind hits<br />
the corner of these types of structures. These so-called cornering<br />
winds also result in worst-case wind loads on roofmounted<br />
PV modules.<br />
Conical vortices. When wind hits a building, the flow<br />
separates at the roof edges. However, the two zones of<br />
flow separation interact as they both reattach, and the result<br />
is the generation of conical vortices above the roof. These<br />
vortices can be thought of as horizontal tornadoes that<br />
originate at the corner of the roof and radiate at angles of<br />
10° to 20° along the leading edges of the building. The position<br />
and strength of these vortices are a function of the wind<br />
direction, and strong vortices are present for wind approach<br />
angles of 25°–65° (45° ±20°).<br />
Figure 1 shows the vortices that form along the edges of<br />
a roof without PV modules when wind hits the corner of the<br />
building. In between the vortices near the windward corner,<br />
there is a region of accelerated flow where wind speeds along<br />
the roof surface are 20% higher than those approaching the<br />
solarprofessional.com | SolarPro 79
<strong>Wind</strong> <strong>Load</strong> <strong>Analysis</strong><br />
Courtesy <strong>CPP</strong>(3)<br />
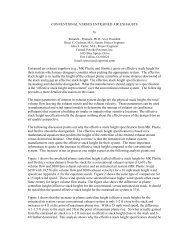
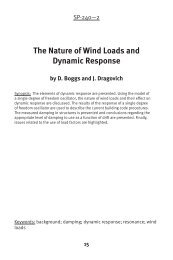
Figure 2 This figure shows the wind pressures measured in a wind tunnel on the roof<br />
of an enclosed low-rise building without PV modules. The arrow indicates wind direction.<br />
Color contours illustrate the effects of conical corner vortices: Dark blue indicates<br />
areas with strong suction force; orange indicates areas with negligible suction force.<br />
building at roof height. The presence of accelerated airflow as<br />
a result of cornering winds is one reason why ASCE 7-05 and<br />
other building codes can underpredict wind loads on PV arrays.<br />
<strong>Wind</strong> tunnel testing has shown that the vortices along the<br />
edges of the roof during cornering winds are responsible for<br />
the highest peak pressures on the building envelope, which<br />
occur directly beneath the vortices as shown in Figure 2.<br />
While the accelerated flow associated with conical vortices<br />
does not have a big impact on the loading of the roof itself—<br />
which is what ASCE 7-05 and other codes were designed to<br />
take into account—it does have an impact on objects that<br />
protrude above the roof.<br />
Conical vortices are responsible for<br />
the greatest wind pressures that occur<br />
across roof-mounted PV modules. However,<br />
the manner in which vortices load<br />
rooftop PV modules fundamentally differs<br />
from how they load the roof cladding<br />
elements that codes are based on.<br />
This is illustrated in Figures 3a and 3b,<br />
which provide typical patterns measured<br />
in the wind tunnel of net pressure<br />
coefficients (GC p<br />
values) for an array of<br />
moderately tilted (10°–15°) modules on<br />
a roof that measures 6h × 6h, where h is<br />
the mean building height. (Note that in<br />
many figures in ASCE 7-05, the pressure<br />
coefficient is given the variable name<br />
GC p<br />
instead of C.)<br />
It is clear from Figure 3a that on one hand the vortex that<br />
forms along the north edge of the building during northeast<br />
cornering winds is “quiet,” having little discernible effect on<br />
the modules. (Note that the term north and all other directions<br />
in this article are defined based solely on the array orientation,<br />
which is assumed to face to the south.) The east<br />
edge vortex at the northeast corner, on the other hand, produces<br />
significant wind loads that peak at an angle of nearly<br />
30° from the roof edge. This indicates that it is the interaction<br />
between the swirling and reattaching wind flows and<br />
the accelerated between-vortex flows that creates peak<br />
pressures for the modules, rather than continued on page 82<br />
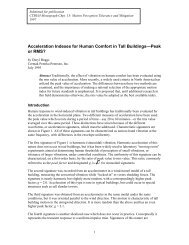
Figures 3a and 3b In these wind tunnel tests, wind pressures were measured on a PV array aligned with the edges of a lowrise<br />
building and covering most of the roof. The color red indicates areas subjected to significant uplift forces; the color blue<br />
indicates areas with negligible uplift forces. Figure 3a (left) illustrates the typical worst-case wind pressure—resulting from<br />
northeast cornering winds—on moderately tilted PV modules on a flat roof. While lower overall wind pressures result from<br />
southeast cornering winds, as shown in Figure 3b (right), the areas in yellow represent the worst-case wind loading on the<br />
mechanical components located near this corner of the roof. The structural design needs to account for the worst-case wind<br />
loads from winds in any direction.<br />
80 SolarPro | June/July 2012
<strong>Wind</strong> <strong>Load</strong> <strong>Analysis</strong><br />
Courtesy <strong>CPP</strong><br />
transfer of the high pressure at the center of the vortex to the<br />
surface, as is the case for the roof itself.<br />
Conversely, Figure 3b shows that the east edge vortex of<br />
the southeast corner vortex pair is quiet, creating little lift on<br />
the modules, while the south edge vortex creates substantial<br />
lift. In this case, the location of the lift is closer to the edge of<br />
the roof and more nearly beneath the vortex core axis.<br />
If the modules shown in Figure 3 were rotated to face to<br />
the west, then patterns in each corner would be reversed.<br />
Any noticeable rotation of the modules relative to the building<br />
edges increases the lift associated with the two quiet<br />
vortices, and may worsen overall loads as well. More data is<br />
needed to evaluate wind loads when arrays are not aligned<br />
along the same axes as the building edges.<br />
Impact of array layout. It is important to note that the pressure<br />
coefficients in Figures 3a and 3b are for an array that<br />
completely covers the roof, with no gaps other than typical<br />
spacing in the north-south direction between rows of sloped<br />
PV modules. In most cases, there are gaps between mechanical<br />
sections of a PV array. PV modules located along the edges<br />
of mechanical subarrays can experience increased wind pressure.<br />
(Note that while the NEC defines the term subarray as<br />
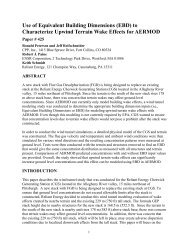
Figure 4 Most PV arrays do not cover an entire roof but are broken into mechanical subarrays,<br />
like the colored blocks in this figure. <strong>Wind</strong> tunnel test results reveal that these<br />
subarrays are subjected to higher pressures than a simple analysis based on ASCE 7-05<br />
roof zones would indicate. The red lines in this figure identify the corner, edge and<br />
interior roof zones according to ACSE 7-05. The areas in red identify subarray sections<br />
located within the interior roof zone that are subjected to significant uplift forces as a<br />
result of northeast cornering winds.<br />
“an electrical subset of a PV array,” in this article we apply the<br />
term to mechanical sections of an array that are separated<br />
from other array sections by distances larger than the standard<br />
row spacing in the north-south direction or more than a<br />
foot in the east-west direction.)<br />
<strong>Wind</strong> loads on PV arrays are sensitive to the physical<br />
array layout. This is one of the most critical differences<br />
between results obtained by applying the ASCE 7-05 standard<br />
to sloped PV arrays on flat roofs and actual wind loads.<br />
Figure 4 demonstrates this point. The colored blocks in the<br />
figure represent six subarrays, shown in blue with some yellow<br />
and red regions, installed on a roof surface, shown in<br />
white. The color gradients found in the subarrays represent<br />
pressure coefficients measured in a wind tunnel, with blue<br />
representing relatively low-pressure coefficients and red<br />
higher-pressure coefficients. This figure shows how the edges<br />
of mechanical subarrays experience much higher wind loads<br />
than the interior sections.<br />
The ASCE 7-05 standard, which only considers corner<br />
and edge zones for the roof and not for individual subarrays,<br />
would not address these higher wind loads. The red lines in<br />
Figure 4 show the corner and edge zones as defined by ASCE<br />
7-05. It is clear from this figure<br />
that peak pressures on the subarrays<br />
can occur in what ASCE<br />
7-05 considers to be interior<br />
roof zones.<br />
Any building code requires<br />
us to design a structure to withstand<br />
wind loads from all directions.<br />
So even though Figure 4<br />
shows that the north rows have<br />
the highest coefficients from a<br />
northeast cornering wind, other<br />
wind directions can cause relatively<br />
high-pressure coefficients<br />
in the south, east or west edges<br />
of mechanical subarrays.<br />
Effects not captured by ASCE<br />
methods. Capturing the effects of<br />
subarray spacing, parapets and<br />
rooftop objects in an analytical<br />
process inherently forces the<br />
process to become more complicated<br />
than the typical application<br />
of ASCE 7-05. It is clear from available<br />
wind tunnel data that peak<br />
wind loads occur at locations<br />
that are more than one building<br />
height, h, from the roof edges.<br />
The edge and corner roof zones<br />
prescribed continued on page 84<br />
82 SolarPro | June/July 2012
<strong>Wind</strong> <strong>Load</strong> <strong>Analysis</strong><br />
“Based on our testing and research, [treating arrays] as components and<br />
cladding on a monosloped roof provides a safe and generally conservative<br />
estimation of the actual loads on an array, particularly when one considers<br />
the loads over larger areas. However, when smaller tributary areas are<br />
considered, the code values appear to be less conservative and may, in<br />
certain cases, be unconservative.”<br />
—Gregory Kopp, Joe Maffei and Christopher Tilley, “Rooftop Solar Arrays and <strong>Wind</strong> <strong>Load</strong>ing”<br />
in ASCE 7-05 typically extend only 0.4h from the roof edges,<br />
while wind tunnel data suggests that the corner and roof<br />
zones should extend 2h from the roof edges.<br />
The effects of parapet walls on PV arrays are not characterized<br />
in ASCE 7-05 wind loads. While parapets reduce the<br />
peak wind loads at extreme corners and edges of the roof, they<br />
increase wind loads in interior areas. Modules that are very<br />
close to the parapet wall do receive some shielding benefit,<br />
provided that the parapet is close to or taller than the maximum<br />
height of the PV array.<br />
Objects on the roof that are taller than the PV array, such as<br />
penthouses and HVAC units, can also provide some shielding<br />
benefit; however, in certain wind directions,<br />
the objects can generate vortices<br />
that increase wind loads in the vicinity<br />
of the object. This possibility is not captured<br />
in the ASCE 7-05 standard.<br />
The alternative to complexity is to<br />
simplify the process by making conservative<br />
assumptions. However, making<br />
overconservative assumptions tends<br />
to drive up structural costs—perhaps<br />
making a viable project uneconomical—and<br />
may rule out other viable sites due to structural<br />
loading limitations.<br />
Recommended Practice for<br />
Estimating <strong>Wind</strong> <strong>Load</strong>s<br />
Capturing the effects of subarray spacing, parapets and<br />
rooftop objects in a recommended analytical process inherently<br />
forces the process to become more complicated than<br />
the typical application of ASCE 7-05. The other alternative<br />
is to simplify the process by making conservative assumptions.<br />
To avoid being overconservative, continued on page 86<br />
84 SolarPro | June/July 2012
<strong>Wind</strong> <strong>Load</strong> <strong>Analysis</strong><br />
the approach that we present takes all of the above impacts<br />
into account. The bad news is that the approach is more<br />
complicated than applying ASCE 7-05. However, there are<br />
two pieces of good news: One, the results will be more reflective<br />
of actual wind loads on the array; two, a free online<br />
design tool called the DNV <strong>Wind</strong> <strong>Load</strong> Calculator for Sloped<br />
PV Arrays on Flat Roofs (www.dnv.com/industry/energy/<br />
segments/solar_energy/index.asp) will perform the complicated<br />
steps for you.<br />
The DNV <strong>Wind</strong> <strong>Load</strong> Calculator uses an alternative<br />
method of calculating wind loads that was developed by<br />
determining which parts of ASCE 7-05 match available wind<br />
tunnel data. Thousands of wind tunnel tests have been conducted<br />
on roof-mounted PV systems. While much of the<br />
data is confidential, the results provide insights into how to<br />
best apply existing data in ASCE 7-05 to the problem of estimating<br />
wind loads on sloped PV modules on flat roofs. The<br />
DNV <strong>Wind</strong> <strong>Load</strong> Calculator’s method is completely ad hoc;<br />
there is little justification for it on the basis of physics or the<br />
intent of the code. It just fits the data.<br />
How it works. Recall that Equation 1 defined wind pressure<br />
as ½ρ x V 2 x C. This fundamental equation from fluid<br />
dynamics is the basis of the method for calculating wind<br />
pressures on roofs described in ASCE 7-05. DNV’s method<br />
relies on this equation as applied by ASCE 7-05 as well, but<br />
provides values for the pressure coefficient, C, that are not<br />
part of the ASCE 7-05 standard.<br />
Sections 6.5.3 through 6.5.10 of ASCE 7-05 provide detailed<br />
guidelines on estimating what is essentially the first part of<br />
this equation (½ρ x V 2 ), which ASCE calls the velocity pressure.<br />
As detailed in the standard, the ASCE 7-05 value for velocity<br />
pressure includes some additional terms beyond air density<br />
(ρ) and wind speed (V). ASCE 7-05 also provides values for<br />
pressure coefficients, C, which are a function of the building<br />
size and shape, as well as the effective wind area or tributary<br />
area of the structural component under investigation.<br />
While the ASCE 7-05 pressure coefficients are commonly<br />
applied to sloped PV arrays on flat roofs, wind tunnel data<br />
has shown that these coefficients are not generally applicable<br />
to this configuration. The DNV <strong>Wind</strong> <strong>Load</strong> Calculator<br />
provides alternate values for the pressure coefficient on PV<br />
arrays that take into account the PV tilt, row spacing, height<br />
above the roof and sheltering from wind due to nearby<br />
objects such as nearby subarrays or parapet walls.<br />
For example, a parapet wall shelters nearby modules,<br />
but can increase pressures in the middle continued on page 88<br />
Simplified procedure vs. wind tunnel Applying the simplified procedure of determining design wind pressures, as described<br />
in ASCE 7-05,to a square building that is 600 feet wide and 30 feet tall grossly oversimplifies the wind zone map on the left and<br />
the expected design wind forces. By comparison, 13 distinct wind zones are identified in the map on the right, based on wind<br />
tunnel tests performed by Renusol America for its CS60 ballasted mounting system. The roof areas in red, orange and yellow<br />
indicate where significant wind forces are expected; the roof areas in white indicate where the least wind forces are expected.<br />
H x 20 (600 ft)<br />
H x 20<br />
End Zone 2<br />
North<br />
A2<br />
A3<br />
A1<br />
C1<br />
A2<br />
A3<br />
A1<br />
C1<br />
C2<br />
B1<br />
B2<br />
C2<br />
B1<br />
B2<br />
C3<br />
C3<br />
H x 20 (600 ft)<br />
End Zone 2<br />
Interior Zone 1<br />
End Zone 2<br />
End Zone 2<br />
H x 20<br />
G2<br />
G1<br />
F<br />
D<br />
E<br />
G2<br />
G1<br />
F<br />
Courtesy Renusol America<br />
(24 ft)<br />
Corner<br />
Roof Zone 3<br />
86 SolarPro | June/July 2012
<strong>Wind</strong> <strong>Load</strong> <strong>Analysis</strong><br />
of the roof. The calculator incorporates the potential increase<br />
in wind pressure in interior regions of the roof when a parapet<br />
wall is present, as well as the accelerated flow around rooftop<br />
objects such as HVAC units. The velocity pressure determined<br />
in the calculator is exactly as prescribed by ASCE 7-05, but the<br />
coefficients are based on actual wind tunnel data.<br />
USING THE DNV CALCULATOR<br />
The DNV <strong>Wind</strong> <strong>Load</strong> Calculator is posted on DNV’s website<br />
(see Resources) along with a user manual. The first step is to<br />
enter a series of inputs that are defined in ASCE 7-05: mean<br />
roof height, basic wind speed, directionality factor, importance<br />
factor, topographic factor, velocity pressure exposure<br />
coefficient and effective wind area. These inputs, which<br />
structural engineers are used to working with, are used to<br />
determine the velocity pressure according to ASCE 7-05 .<br />
A second set of inputs to the DNV <strong>Wind</strong> <strong>Load</strong> Calculator<br />
defines the PV array geometry. These parameters include<br />
effective wind area or tributary area, PV tilt, row spacing,<br />
height above the roof and the location of the array section<br />
being considered. Several factors are used to describe<br />
the array location, including the location within a subarray<br />
(north row, south row, eastern or western perimeter<br />
or interior), the roof location (corner, edge or middle) and<br />
the distances to nearby objects. The calculator also asks for<br />
the parapet height(s) on the building and the dimensions of<br />
rooftop objects that are taller than the array.<br />
For each mechanical subarray section—for example, a<br />
north row in the corner of the roof—the calculator provides<br />
a wind pressure in pounds per square foot (psf). This result<br />
is the estimated pressure that should be applied analytically<br />
in the upward and downward direction perpendicular to<br />
the PV module. The calculator also provides recommended<br />
offset distances from rooftop objects, such as HVAC units,<br />
which can create regions of accelerated flow around them.<br />
Comparison to results from ASCE 7-05. Comparing DNV<br />
<strong>Wind</strong> <strong>Load</strong> Calculator results to those determined using<br />
ASCE 7-05 is complicated because there is no one correct<br />
way to apply the standard to sloped PV modules on a flat<br />
roof. However, we have compared DNV <strong>Wind</strong> <strong>Load</strong> Calculator<br />
results to those achieved using several interpretations of<br />
the ASCE 7-05 standard commonly used by structural engineers.<br />
These comparisons indicate that the DNV <strong>Wind</strong> <strong>Load</strong><br />
Calculator predicts wind loads higher than ASCE 7-05 methods<br />
in some cases and lower in others.<br />
In general, interior PV array sections that are close to<br />
the roof, tightly spaced and that can spread loads to adjacent<br />
areas—sections with a relatively large effective wind<br />
area, in other words—will have lower wind loads than predicted<br />
by ASCE 7-05. Exposed array sections, particularly the<br />
north row in the corner and edge zones of the roof, may have<br />
higher wind loads.<br />
If wind loads are found to be higher than expected or<br />
desired, the designer may iterate through many of the inputs<br />
to identify design characteristics that reduce wind loads.<br />
For example, placing the array closer to the roof, reducing<br />
row spacing or PV tilt, or increasing the effective wind area<br />
all reduce wind loads. If wind loads are still too high, a preengineered<br />
aerodynamic product that has undergone<br />
wind tunnel testing in accordance with continued on page 90<br />
Ballast study Linking components together increases the effective wind area and reduces wind loads, as illustrated in the ballast<br />
study details below provided by Renusol America. The study on the left shows the pounds of ballast required per Renusol<br />
CS60 base in the northwest corner of a large PV array that does not use strut connections in the north-south direction. The<br />
study on the right shows the pounds of ballast required per base if strut connections are used in the north-south direction.<br />
18.5 9.2 9.214.514.5<br />
8.9 4.7 4.7 4.7 4.7 8.9 12.5<br />
12.7 6.9 4.7 4.7 4.7 4.7 4.7 8.5 12.5<br />
12.7 6.9 6.9 6.9 4.7 4.7 4.7 4.7 4.7 8.5 12.5<br />
6.9 6.9 6.9 6.9 4.7 4.7 4.7 4.7 4.7 8.5 8.5 12.5 18.5<br />
12.7 2.2 6.9 6.9 6.9 6.9 4.7 4.7 4.7 4.7 4.7 8.5 8.5 12.5 4.7<br />
12.7 6.9 6.9 6.9 6.9 6.9 6.9 6.9 4.7 4.7 4.7 4.7 4.7 8.5 8.5 4.7<br />
18.1 6.9 6.9 6.9 6.9 6.9 6.9 6.9 6.9 4.7 4.7 4.7 4.7 4.7 4.7 4.7<br />
18.1 6.9 4.7 4.7 4.7 4.7 4.7 4.7<br />
18.1 6.9 4.7 4.7 4.7 4.7 4.7 4.7<br />
18.1 4.7 4.7 4.7 4.7 4.7 4.7 4.7<br />
Ballast study before N–S strut connections<br />
2.5 2.0 2.0 4.5 4.5<br />
1.5 0.2 0.2 0.2 0.2 1.5 3.3<br />
3.4 1.1 0.2 0.2 0.2 0.2 0.2 1.5 3.3<br />
5.9 1.1 1.1 1.1 0.2 0.2 0.2 0.2 0.2 1.5 3.3<br />
2.2 1.1 1.1 1.1 0.2 0.2 0.2 0.2 0.2 1.5 1.5 3.3 2.5<br />
5.9 2.2 1.1 1.1 1.1 1.1 0.2 0.2 0.2 0.2 0.2 1.5 1.5 3.3 0.2<br />
18.9 2.2 2.2 1.1 1.1 1.1 1.1 1.1 0.2 0.2 0.2 0.2 0.2 1.6 1.6 0.2<br />
8.7 2.2 2.2 1.1 1.1 1.1 1.1 1.1 1.1 0.2 0.2 0.2 0.2 0.2 0.2 0.2<br />
2.5 1.1 0.2 0.2 0.2 0.2 0.2 0.2<br />
2.5 1.1 0.2 0.2 0.2 0.2 0.2 0.2<br />
2.5 0.2 0.2 0.2 0.2 0.2 0.2 0.2<br />
Ballast study after N–S strut connections<br />
Courtesy Renusol America<br />
88 SolarPro | June/July 2012
<strong>Wind</strong> <strong>Load</strong> <strong>Analysis</strong><br />
ASCE 7-05, such as a ballasted system with wind deflecting<br />
shields, may be a viable option.<br />
How are the results applied? The DNV <strong>Wind</strong> <strong>Load</strong> Calculator<br />
yields a wind pressure for any array location on the roof. As<br />
with ASCE 7-05, it is up to the designer and structural engineer<br />
to ensure that representative sections of the array are<br />
evaluated to determine worst-case conditions, considering<br />
both uplift and downward forces. Whereas ASCE 7-05 typically<br />
results in different values for uplift and downward pressure,<br />
the DNV <strong>Wind</strong> <strong>Load</strong> Calculator provides one result that<br />
should be applied in both directions in two separate analyses.<br />
It is important that designers and engineers determine<br />
loads on modules, fasteners, all components within the racking<br />
system and the applied loads to the roof. <strong>Load</strong>s must<br />
ultimately be transferred from the modules to the fasteners<br />
and racking system, and ultimately through the roof deck<br />
and building structure to the ground. This is common knowledge<br />
for most structural engineers. Remember that this likely<br />
involves the use of different effective wind areas based on the<br />
load-sharing capability of the component under analysis. The<br />
wind load rating of the module should not be exceeded.<br />
Once wind loads are determined, structural engineers<br />
must apply appropriate safety factors and combine loads as<br />
required in ASCE 7-05 Section 2. In addition to wind loads,<br />
other loads such as snow, seismic and gravity (dead load)<br />
must be taken into account. Structural engineers must consider<br />
each of these loads separately and in combination to<br />
identify the worst-case loading situation.<br />
The use of these results assumes that the structure is sufficiently<br />
rigid so that it is not considered continued on page 92<br />
<strong>Wind</strong> <strong>Load</strong> <strong>Analysis</strong> Recommendations<br />
by PV System Type<br />
For PV system types not covered in this article, we provide the following general wind loading analysis guidelines as a starting<br />
place for system designers and engineers.<br />
Ground-mounted systems:<br />
P Following the definitions found in ASCE 7-05, treat the<br />
rows of PV modules as open buildings with monosloped<br />
roofs and use the slope of the PV modules as the roof<br />
slope to apply the standard.<br />
P Do not use ASCE 7-05 tables for billboards and signs.<br />
P For trackers, check all possible tilts and forces on the drive<br />
system (gears, struts, motors and so forth).<br />
P Results will be conservative for interior rows, but<br />
conducting wind tunnel tests in compliance with<br />
ASCE 7-05 guidelines can reduce this conservatism.<br />
Sloped-roof systems:<br />
P When PV modules are incorporated directly into the roof<br />
surface, they can be analyzed using ASCE 7-05 in the<br />
same way that a roof would be analyzed.<br />
P If PV modules are parallel to the roof surface and offset<br />
no more than 6 inches, a method developed by the<br />
Solar aBCs and described in the report “<strong>Wind</strong> <strong>Load</strong><br />
Ccalculations for PV Arrays” may be applied (see<br />
Resources).<br />
P Any application of ASCE 7-05 will likely be conservative<br />
for arrays that have gaps on the order of 1 inch or more<br />
between modules.<br />
P For PV modules sloped relative to a sloped roof, there<br />
is no known publicly available data; wind tunnel testing in<br />
compliance with ASCE 7-05 guidelines is recommended,<br />
or consider placing the modules flush to the roof.<br />
Ballasted roof-mounted systems:<br />
P ASCE 7-05 and the DNV <strong>Wind</strong> <strong>Load</strong> Calculator will likely<br />
result in wind loads that cannot feasibly be resisted by<br />
ballast alone since most roofs cannot support more than<br />
an additional 5–10 pounds per square foot, which<br />
means that ballasted systems must incorporate<br />
aerodynamic features such as wind-deflecting shields and<br />
must be tested in a wind tunnel, as no other method exists<br />
for estimating wind loads.<br />
P ASCE does not allow the use of computational fluid<br />
dynamics (CFD) in lieu of wind tunnel testing; any CFD<br />
results must be validated against wind tunnel<br />
measurements.<br />
Designers specifying ballasted systems should<br />
ensure that:<br />
P <strong>Wind</strong> tunnel testing was done in accordance with<br />
ASCE 7-05 guidelines.<br />
P Worst-case conditions—such as wet and icy—are used<br />
to determine the friction coefficient for specific roofs,<br />
since the system relies on friction between the roof and<br />
the array.<br />
P The system will not cause a safety hazard as a result of<br />
an earthquake.<br />
P The roof membrane is not subject to fluttering that could<br />
damage the roof or ballasted system.<br />
P Ballasted systems installed on ballasted membrane roofs<br />
comply with established roofing industry guidelines, such<br />
as ANSI/SPRI RP-4, “<strong>Wind</strong> Design Standard for Ballasted<br />
Single-ply Roofing Systems.” {<br />
90 SolarPro | June/July 2012
<strong>Wind</strong> <strong>Load</strong> <strong>Analysis</strong><br />
a flexible structure. It is recommended that PV mounting<br />
systems have a natural frequency above 4 Hz to be considered<br />
rigid enough to prevent resonance. This is higher than<br />
the 1 Hz limit prescribed in the ASCE 7-05 standard, because<br />
the 1 Hz limit is intended for large structures not likely to<br />
shed vortices that can create an excitation (resonance) in<br />
smaller structures. <strong>Wind</strong> tunnel testing has shown that PV<br />
systems shed vortices with frequencies in the 2–3 Hz range,<br />
so structures should be designed with natural frequencies in<br />
the 4–5 Hz range.<br />
Limitations of use. The DNV <strong>Wind</strong> <strong>Load</strong> Calculator can<br />
be applied to your project only if it meets the following<br />
conditions:<br />
f Flat or low-slope roof (less than 7°)<br />
f Low-rise building (less than 60 feet high and<br />
wider and longer than it is tall)<br />
f Modules are tilted between 1° and 35° from roof surface<br />
f Modules are flat plate<br />
f Modules are solid (not porous)<br />
f Modules are mounted close to roof surface<br />
(gap under lowest part is less than 18 inches)<br />
f Top of module sits less than 4 feet above roof surface<br />
f Modules are placed more than 5 feet from roof<br />
edge with no parapet or with parapet shorter<br />
than top of modules<br />
f No wind deflector on perimeter of array<br />
f Modules are aligned with building edges<br />
f No significantly taller structures are located near<br />
roof in question<br />
f Structure is significantly rigid (natural frequency<br />
greater than approximately 4 Hz)<br />
Apply the results of the DNV <strong>Wind</strong> <strong>Load</strong> Calculator with<br />
caution. Due to limitations in available data and the broad<br />
range of possible sloped PV geometries, the tool cannot possibly<br />
cover all types of sloped PV systems on flat and lowslope<br />
roofs. Rather, it covers standard rack-mounted PV<br />
systems that do not have aerodynamic enhancements such<br />
as wind-deflecting shields on the edges of modules.<br />
Ballasted systems rely on a wide variety of aerodynamic<br />
features to withstand wind loads. These features are product<br />
specific and in many cases are protected by patents. The<br />
wind tunnel data that does exist for these products belong<br />
to individual manufacturers, so it is not possible to present<br />
generic results for ballasted systems. (Recommended guidelines<br />
for using ballasted systems are included in “<strong>Wind</strong> <strong>Load</strong><br />
<strong>Analysis</strong> Recommendations by PV System Type,” p. 90.)<br />
Local building departments may not accept the results<br />
from the DNV <strong>Wind</strong> <strong>Load</strong> Calculator. For example, the local<br />
AHJ may require the use of the analytical methods described<br />
in ASCE 7-05 if these result in higher loads. If so, we recommend<br />
that designers and engineers use the more conservative<br />
results unless wind tunnel testing done in accordance with<br />
ASCE 7-05 demonstrates lower loads.<br />
<strong>Wind</strong>ing Up<br />
There is no ideally suited method for calculating wind loads<br />
on roof-mounted solar modules in ASCE 7-05. Many methods<br />
have been suggested by subject matter experts and analyzed<br />
by industry stakeholders. However, every one of these introduces<br />
significant shortcomings when comparing the results<br />
to the real pressure patterns that have been measured in the<br />
wind tunnel.<br />
Several efforts are currently under way that may provide<br />
new insights into the problem of estimating wind loads<br />
on PV arrays. For example, the Structural Engineers Association<br />
of California is expected to publish relevant recommendations<br />
soon. The Solar America Board for Codes and<br />
Standards has published suggested practices for estimating<br />
wind loads on flush-mounted, sloped-roof applications, and<br />
has set priorities for follow-up studies and reports.<br />
It is likely that in the next 3–8 years, new tables or figures<br />
will be introduced to ASCE 7 that directly address roofmounted<br />
solar modules tilted up off the roof. Until then,<br />
the DNV <strong>Wind</strong> <strong>Load</strong> Calculator allows for the estimation of<br />
wind uplift forces on commercial and industrial rooftop PV<br />
arrays using values currently in ASCE 7-05.<br />
g CONTACT<br />
Colleen O’Brien / BEW Engineering (a subsidiary of Det Norske Veritas) /<br />
San Ramon, CA / colleen.obrien@dnv.com / dnv.com<br />
David Banks / <strong>CPP</strong> / Fort Collins, CO / dbanks@cppwind.com /<br />
cppwind.com<br />
Resources<br />
American Society of Civil Engineers / asce.org<br />
DNV <strong>Wind</strong> <strong>Load</strong> Calculator / www.dnv.com/industry/energy/segments/<br />
solar_energy/index.asp<br />
Insurance Institute for Business & Home Safety / disastersafety.org<br />
Solar America Board for Codes and Standards / solarabcs.org<br />
Structural Engineers Association of California / seaoc.org<br />
Publications<br />
ASCE 7-05 Minimum Design <strong>Load</strong>s for Buildings and Other Structures,<br />
American Society of Civil Engineers, 2006<br />
Kopp, Gregory, Maffei, Joe, and Tilley, Christopher, “Rooftop Solar Arrays<br />
and <strong>Wind</strong> <strong>Load</strong>ing: A Primer on Using <strong>Wind</strong> Tunnel Testing as a Basis for<br />
Code Compliant Design per ASCE 7,” SunLink, sunlink.com, 2011<br />
Barkaszi, Stephen, and O’Brien, Colleen, “<strong>Wind</strong> <strong>Load</strong> Calculations for<br />
PV Arrays,” Solar America Board for Codes and Standards,<br />
solarabcs.org, 2010<br />
92 SolarPro | June/July 2012