Wind Load Analysis - CPP
Wind Load Analysis - CPP
Wind Load Analysis - CPP

Create successful ePaper yourself
Turn your PDF publications into a flip-book with our unique Google optimized e-Paper software.
<strong>Wind</strong> <strong>Load</strong> <strong>Analysis</strong><br />
Courtesy <strong>CPP</strong><br />
transfer of the high pressure at the center of the vortex to the<br />
surface, as is the case for the roof itself.<br />
Conversely, Figure 3b shows that the east edge vortex of<br />
the southeast corner vortex pair is quiet, creating little lift on<br />
the modules, while the south edge vortex creates substantial<br />
lift. In this case, the location of the lift is closer to the edge of<br />
the roof and more nearly beneath the vortex core axis.<br />
If the modules shown in Figure 3 were rotated to face to<br />
the west, then patterns in each corner would be reversed.<br />
Any noticeable rotation of the modules relative to the building<br />
edges increases the lift associated with the two quiet<br />
vortices, and may worsen overall loads as well. More data is<br />
needed to evaluate wind loads when arrays are not aligned<br />
along the same axes as the building edges.<br />
Impact of array layout. It is important to note that the pressure<br />
coefficients in Figures 3a and 3b are for an array that<br />
completely covers the roof, with no gaps other than typical<br />
spacing in the north-south direction between rows of sloped<br />
PV modules. In most cases, there are gaps between mechanical<br />
sections of a PV array. PV modules located along the edges<br />
of mechanical subarrays can experience increased wind pressure.<br />
(Note that while the NEC defines the term subarray as<br />
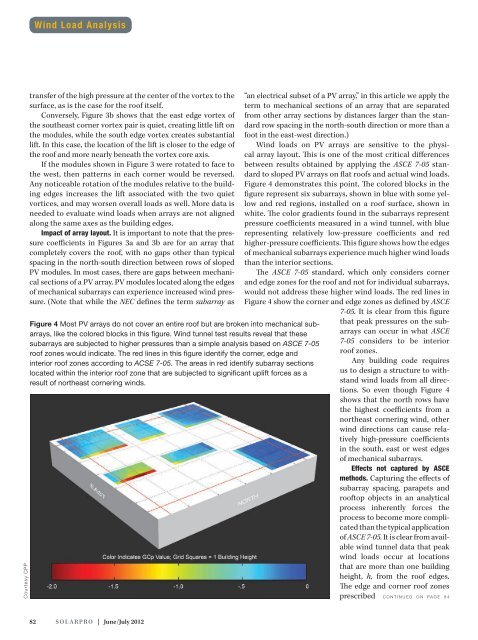
Figure 4 Most PV arrays do not cover an entire roof but are broken into mechanical subarrays,<br />
like the colored blocks in this figure. <strong>Wind</strong> tunnel test results reveal that these<br />
subarrays are subjected to higher pressures than a simple analysis based on ASCE 7-05<br />
roof zones would indicate. The red lines in this figure identify the corner, edge and<br />
interior roof zones according to ACSE 7-05. The areas in red identify subarray sections<br />
located within the interior roof zone that are subjected to significant uplift forces as a<br />
result of northeast cornering winds.<br />
“an electrical subset of a PV array,” in this article we apply the<br />
term to mechanical sections of an array that are separated<br />
from other array sections by distances larger than the standard<br />
row spacing in the north-south direction or more than a<br />
foot in the east-west direction.)<br />
<strong>Wind</strong> loads on PV arrays are sensitive to the physical<br />
array layout. This is one of the most critical differences<br />
between results obtained by applying the ASCE 7-05 standard<br />
to sloped PV arrays on flat roofs and actual wind loads.<br />
Figure 4 demonstrates this point. The colored blocks in the<br />
figure represent six subarrays, shown in blue with some yellow<br />
and red regions, installed on a roof surface, shown in<br />
white. The color gradients found in the subarrays represent<br />
pressure coefficients measured in a wind tunnel, with blue<br />
representing relatively low-pressure coefficients and red<br />
higher-pressure coefficients. This figure shows how the edges<br />
of mechanical subarrays experience much higher wind loads<br />
than the interior sections.<br />
The ASCE 7-05 standard, which only considers corner<br />
and edge zones for the roof and not for individual subarrays,<br />
would not address these higher wind loads. The red lines in<br />
Figure 4 show the corner and edge zones as defined by ASCE<br />
7-05. It is clear from this figure<br />
that peak pressures on the subarrays<br />
can occur in what ASCE<br />
7-05 considers to be interior<br />
roof zones.<br />
Any building code requires<br />
us to design a structure to withstand<br />
wind loads from all directions.<br />
So even though Figure 4<br />
shows that the north rows have<br />
the highest coefficients from a<br />
northeast cornering wind, other<br />
wind directions can cause relatively<br />
high-pressure coefficients<br />
in the south, east or west edges<br />
of mechanical subarrays.<br />
Effects not captured by ASCE<br />
methods. Capturing the effects of<br />
subarray spacing, parapets and<br />
rooftop objects in an analytical<br />
process inherently forces the<br />
process to become more complicated<br />
than the typical application<br />
of ASCE 7-05. It is clear from available<br />
wind tunnel data that peak<br />
wind loads occur at locations<br />
that are more than one building<br />
height, h, from the roof edges.<br />
The edge and corner roof zones<br />
prescribed continued on page 84<br />
82 SolarPro | June/July 2012