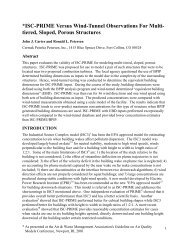
Wind Load Analysis - CPP
Wind Load Analysis - CPP
Wind Load Analysis - CPP

Create successful ePaper yourself
Turn your PDF publications into a flip-book with our unique Google optimized e-Paper software.
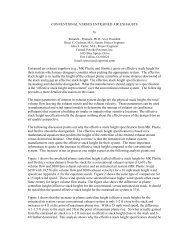
<strong>Wind</strong> <strong>Load</strong> <strong>Analysis</strong><br />
Courtesy <strong>CPP</strong>(3)<br />
Figure 2 This figure shows the wind pressures measured in a wind tunnel on the roof<br />
of an enclosed low-rise building without PV modules. The arrow indicates wind direction.<br />
Color contours illustrate the effects of conical corner vortices: Dark blue indicates<br />
areas with strong suction force; orange indicates areas with negligible suction force.<br />
building at roof height. The presence of accelerated airflow as<br />
a result of cornering winds is one reason why ASCE 7-05 and<br />
other building codes can underpredict wind loads on PV arrays.<br />
<strong>Wind</strong> tunnel testing has shown that the vortices along the<br />
edges of the roof during cornering winds are responsible for<br />
the highest peak pressures on the building envelope, which<br />
occur directly beneath the vortices as shown in Figure 2.<br />
While the accelerated flow associated with conical vortices<br />
does not have a big impact on the loading of the roof itself—<br />
which is what ASCE 7-05 and other codes were designed to<br />
take into account—it does have an impact on objects that<br />
protrude above the roof.<br />
Conical vortices are responsible for<br />
the greatest wind pressures that occur<br />
across roof-mounted PV modules. However,<br />
the manner in which vortices load<br />
rooftop PV modules fundamentally differs<br />
from how they load the roof cladding<br />
elements that codes are based on.<br />
This is illustrated in Figures 3a and 3b,<br />
which provide typical patterns measured<br />
in the wind tunnel of net pressure<br />
coefficients (GC p<br />
values) for an array of<br />
moderately tilted (10°–15°) modules on<br />
a roof that measures 6h × 6h, where h is<br />
the mean building height. (Note that in<br />
many figures in ASCE 7-05, the pressure<br />
coefficient is given the variable name<br />
GC p<br />
instead of C.)<br />
It is clear from Figure 3a that on one hand the vortex that<br />
forms along the north edge of the building during northeast<br />
cornering winds is “quiet,” having little discernible effect on<br />
the modules. (Note that the term north and all other directions<br />
in this article are defined based solely on the array orientation,<br />
which is assumed to face to the south.) The east<br />
edge vortex at the northeast corner, on the other hand, produces<br />
significant wind loads that peak at an angle of nearly<br />
30° from the roof edge. This indicates that it is the interaction<br />
between the swirling and reattaching wind flows and<br />
the accelerated between-vortex flows that creates peak<br />
pressures for the modules, rather than continued on page 82<br />
Figures 3a and 3b In these wind tunnel tests, wind pressures were measured on a PV array aligned with the edges of a lowrise<br />
building and covering most of the roof. The color red indicates areas subjected to significant uplift forces; the color blue<br />
indicates areas with negligible uplift forces. Figure 3a (left) illustrates the typical worst-case wind pressure—resulting from<br />
northeast cornering winds—on moderately tilted PV modules on a flat roof. While lower overall wind pressures result from<br />
southeast cornering winds, as shown in Figure 3b (right), the areas in yellow represent the worst-case wind loading on the<br />
mechanical components located near this corner of the roof. The structural design needs to account for the worst-case wind<br />
loads from winds in any direction.<br />
80 SolarPro | June/July 2012