Investigation of factors influencing the determination of ... - saimm
Investigation of factors influencing the determination of ... - saimm
Investigation of factors influencing the determination of ... - saimm

Create successful ePaper yourself
Turn your PDF publications into a flip-book with our unique Google optimized e-Paper software.
Value creation in <strong>the</strong> resource business<br />
better explained using <strong>the</strong> institutional <strong>the</strong>ory12, which<br />
postulates that companies facing <strong>the</strong> same set <strong>of</strong> environmental<br />
conditions usually follow an evolutionary path from<br />
diversity to homogeneity.<br />
Even though <strong>the</strong> value chain and upstream/downstream<br />
concepts are ingrained in <strong>the</strong> resources lexicon, <strong>the</strong> mining<br />
business still remains fully integrated from exploration to<br />
sales. As a result, financial information such as capital<br />
investment and earnings is not calculated for <strong>the</strong> different<br />
segments <strong>of</strong> <strong>the</strong> value chain, let alone value. In <strong>the</strong>ir annual<br />
reports, mining firms report separate information only for<br />
product groups or business units.<br />
In summary, this analysis suggests that <strong>the</strong> most critical<br />
activities in <strong>the</strong> oil and gas industry and <strong>the</strong> resource<br />
business at large are in <strong>the</strong> upper part <strong>of</strong> <strong>the</strong> value chain. It<br />
appears that companies that excel in managing <strong>the</strong> upstream<br />
segment are likely to generate a higher value. To gain fur<strong>the</strong>r<br />
insights into this proposition, a study <strong>of</strong> value creation in <strong>the</strong><br />
oil and gas industry was carried out. The outcomes <strong>of</strong> this<br />
study are discussed in <strong>the</strong> following section.<br />
Value creation in <strong>the</strong> oil and gas industry<br />
The model used in this assessment is essentially <strong>the</strong> same as<br />
previously described in <strong>the</strong> introductory section for <strong>the</strong><br />
fourteen mining companies. The only distinction is <strong>the</strong> period<br />
<strong>of</strong> analysis—ten years, instead <strong>of</strong> eight considered in <strong>the</strong><br />
abovementioned mining study—from 31 Dec 1999 to 31 Dec<br />
2009. The central hypo<strong>the</strong>sis is that oil and gas companies<br />
that excel in TSR over an entire economic cycle are those that<br />
also excel in increasing <strong>the</strong>ir reserves and production,<br />
referred to here as TRI. To prove this, a group <strong>of</strong> nine<br />
international oil and gas companies trading on <strong>the</strong> New York<br />
Stock Exchange (NYSE) were examined using similar<br />
parameters to calculate <strong>the</strong>ir respective TSR and TRI. These<br />
companies, listed in Table I, were chosen because <strong>the</strong>ir<br />
production and reserves data was easily accessible and <strong>the</strong>y<br />
cover an ample spectrum, representing <strong>the</strong> oil and gas<br />
industry adequately.<br />
Information on oil and gas reserves and production was<br />
obtained from <strong>the</strong> companies’ annual reports. Crude oil<br />
reserves are usually reported in millions <strong>of</strong> barrels, whereas<br />
gas volumes are in billions <strong>of</strong> cubic feet. As almost all<br />
companies produce crude oil as well as gas, production and<br />
reserves are reported in millions <strong>of</strong> barrels <strong>of</strong> oil equivalent.<br />
Since <strong>the</strong> conversion ratio varies slightly across companies,<br />
this study uses 5 800 cubic feet as one oil equivalent barrel.<br />
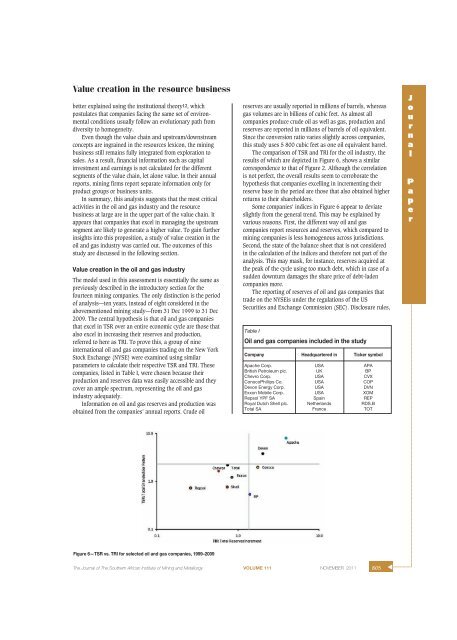
The comparison <strong>of</strong> TSR and TRI for <strong>the</strong> oil industry, <strong>the</strong><br />
results <strong>of</strong> which are depicted in Figure 6, shows a similar<br />
correspondence to that <strong>of</strong> Figure 2. Although <strong>the</strong> correlation<br />
is not perfect, <strong>the</strong> overall results seem to corroborate <strong>the</strong><br />
hypo<strong>the</strong>sis that companies excelling in incrementing <strong>the</strong>ir<br />
reserve base in <strong>the</strong> period are those that also obtained higher<br />
returns to <strong>the</strong>ir shareholders.<br />
Some companies’ indices in Figure 6 appear to deviate<br />
slightly from <strong>the</strong> general trend. This may be explained by<br />
various reasons. First, <strong>the</strong> different way oil and gas<br />
companies report resources and reserves, which compared to<br />
mining companies is less homogenous across jurisdictions.<br />
Second, <strong>the</strong> state <strong>of</strong> <strong>the</strong> balance sheet that is not considered<br />
in <strong>the</strong> calculation <strong>of</strong> <strong>the</strong> indices and <strong>the</strong>refore not part <strong>of</strong> <strong>the</strong><br />
analysis. This may mask, for instance, reserves acquired at<br />
<strong>the</strong> peak <strong>of</strong> <strong>the</strong> cycle using too much debt, which in case <strong>of</strong> a<br />
sudden downturn damages <strong>the</strong> share price <strong>of</strong> debt-laden<br />
companies more.<br />
The reporting <strong>of</strong> reserves <strong>of</strong> oil and gas companies that<br />
trade on <strong>the</strong> NYSEis under <strong>the</strong> regulations <strong>of</strong> <strong>the</strong> US<br />
Securities and Exchange Commission (SEC). Disclosure rules,<br />
Table I<br />
Oil and gas companies included in <strong>the</strong> study<br />
Company Headquartered in Ticker symbol<br />
Apache Corp. USA APA<br />
British Petroleum plc. UK BP<br />
Chevro Corp. USA CVX<br />
ConocoPhillips Co. USA COP<br />
Devon Energy Corp. USA DVN<br />
Exxon Mobile Corp. USA XOM<br />
Repsol YPF SA Spain REP<br />
Royal Dutch Shell plc. Ne<strong>the</strong>rlands RDS.B<br />
Total SA France TOT<br />
J<br />
o<br />
u<br />
r<br />
n<br />
a<br />
l<br />
P<br />
a<br />
p<br />
e<br />
r<br />
Figure 6—TSR vs. TRI for selected oil and gas companies, 1999–2009<br />
The Journal <strong>of</strong> The Sou<strong>the</strong>rn African Institute <strong>of</strong> Mining and Metallurgy VOLUME 111 NOVEMBER 2011 805<br />
▲