Fitnessgram Performance Standards - California Department of ...
Fitnessgram Performance Standards - California Department of ...
Fitnessgram Performance Standards - California Department of ...

You also want an ePaper? Increase the reach of your titles
YUMPU automatically turns print PDFs into web optimized ePapers that Google loves.
DEPARTMENT<br />
OF<br />
EDUCATION<br />
2 0 1 2 – 1 3 P h y s i c a l F i t n e s s T e s t ( P F T )<br />
STATE<br />
OF<br />
CALIFORNIA<br />
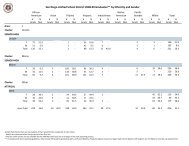
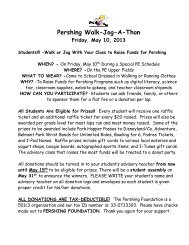
FITNESSGRAM <strong>Performance</strong> <strong>Standards</strong> 1<br />
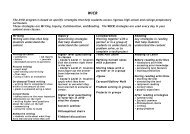
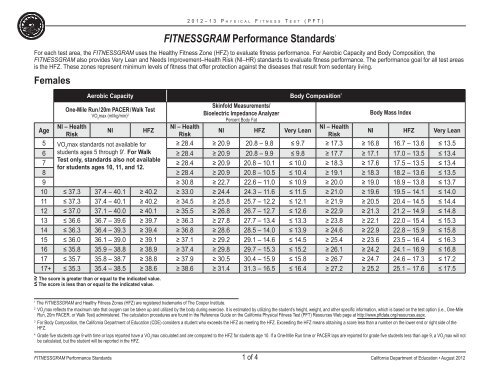
For each test area, the FITNESSGRAM uses the Healthy Fitness Zone (HFZ) to evaluate fitness performance. For Aerobic Capacity and Body Composition, the<br />
FITNESSGRAM also provides Very Lean and Needs Improvement–Health Risk (NI–HR) standards to evaluate fitness performance. The performance goal for all test areas<br />
is the HFZ. These zones represent minimum levels <strong>of</strong> fitness that <strong>of</strong>fer protection against the diseases that result from sedentary living.<br />
Females<br />
Aerobic Capacity Body Composition 3<br />
One-Mile Run / 20m PACER / Walk Test<br />
VO 2<br />
max (ml/kg/min) 2<br />
NI – Health<br />
Age<br />
NI<br />
HFZ<br />
Risk<br />
5 VO 2<br />
max standards not available for<br />
students ages 5 through 9 4 . For Walk<br />
Test only, standards also not available<br />
Skinfold Measurements/<br />
Bioelectric Impedance Analyzer<br />
Body Mass Index<br />
Percent Body Fat<br />
NI – Health<br />
NI – Health<br />
NI HFZ Very Lean<br />
Risk<br />
Risk<br />
NI HFZ Very Lean<br />
≥ 28.4 ≥ 20.9 20.8 – 9.8 ≤ 9.7 ≥ 17.3 ≥ 16.8 16.7 – 13.6 ≤ 13.5<br />
6 ≥ 28.4 ≥ 20.9 20.8 – 9.9 ≤ 9.8 ≥ 17.7 ≥ 17.1 17.0 – 13.5 ≤ 13.4<br />
7 ≥ 28.4 ≥ 20.9 20.8 – 10.1 ≤ 10.0 ≥ 18.3 ≥ 17.6 17.5 – 13.5 ≤ 13.4<br />
for students ages 10, 11, and 12.<br />
8 ≥ 28.4 ≥ 20.9 20.8 – 10.5 ≤ 10.4 ≥ 19.1 ≥ 18.3 18.2 – 13.6 ≤ 13.5<br />
9 ≥ 30.8 ≥ 22.7 22.6 – 11.0 ≤ 10.9 ≥ 20.0 ≥ 19.0 18.9 – 13.8 ≤ 13.7<br />
10 ≤ 37.3 37.4 – 40.1 ≥ 40.2 ≥ 33.0 ≥ 24.4 24.3 – 11.6 ≤ 11.5 ≥ 21.0 ≥ 19.6 19.5 – 14.1 ≤ 14.0<br />
11 ≤ 37.3 37.4 – 40.1 ≥ 40.2 ≥ 34.5 ≥ 25.8 25.7 – 12.2 ≤ 12.1 ≥ 21.9 ≥ 20.5 20.4 – 14.5 ≤ 14.4<br />
12 ≤ 37.0 37.1 – 40.0 ≥ 40.1 ≥ 35.5 ≥ 26.8 26.7 – 12.7 ≤ 12.6 ≥ 22.9 ≥ 21.3 21.2 – 14.9 ≤ 14.8<br />
13 ≤ 36.6 36.7 – 39.6 ≥ 39.7 ≥ 36.3 ≥ 27.8 27.7 – 13.4 ≤ 13.3 ≥ 23.8 ≥ 22.1 22.0 – 15.4 ≤ 15.3<br />
14 ≤ 36.3 36.4 – 39.3 ≥ 39.4 ≥ 36.8 ≥ 28.6 28.5 – 14.0 ≤ 13.9 ≥ 24.6 ≥ 22.9 22.8 – 15.9 ≤ 15.8<br />
15 ≤ 36.0 36.1 – 39.0 ≥ 39.1 ≥ 37.1 ≥ 29.2 29.1 – 14.6 ≤ 14.5 ≥ 25.4 ≥ 23.6 23.5 – 16.4 ≤ 16.3<br />
16 ≤ 35.8 35.9 – 38.8 ≥ 38.9 ≥ 37.4 ≥ 29.8 29.7 – 15.3 ≤ 15.2 ≥ 26.1 ≥ 24.2 24.1 – 16.9 ≤ 16.8<br />
17 ≤ 35.7 35.8 – 38.7 ≥ 38.8 ≥ 37.9 ≥ 30.5 30.4 – 15.9 ≤ 15.8 ≥ 26.7 ≥ 24.7 24.6 – 17.3 ≤ 17.2<br />
17+ ≤ 35.3 35.4 – 38.5 ≥ 38.6 ≥ 38.6 ≥ 31.4 31.3 – 16.5 ≤ 16.4 ≥ 27.2 ≥ 25.2 25.1 – 17.6 ≤ 17.5<br />
≥ The score is greater than or equal to the indicated value.<br />
≤ The score is less than or equal to the indicated value.<br />
1<br />
The FITNESSGRAM and Healthy Fitness Zones (HFZ) are registered trademarks <strong>of</strong> The Cooper Institute.<br />
2<br />
VO 2<br />
max reflects the maximum rate that oxygen can be taken up and utilized by the body during exercise. It is estimated by utilizing the student’s height, weight, and other specific information, which is based on the test option (i.e., One-Mile<br />
Run, 20m PACER, or Walk Test) administered. The calculation procedures are found in the Reference Guide on the <strong>California</strong> Physical Fitness Test (PFT) Resources Web page at http://www.pftdata.org/resources.aspx.<br />
3<br />
For Body Composition, the <strong>California</strong> <strong>Department</strong> <strong>of</strong> Education (CDE) considers a student who exceeds the HFZ as meeting the HFZ. Exceeding the HFZ means obtaining a score less than a number on the lower end or right side <strong>of</strong> the<br />
HFZ.<br />
4<br />
Grade five students age 9 with time or laps reported have a VO 2<br />
max calculated and are compared to the HFZ for students age 10. If a One-Mile Run time or PACER laps are reported for grade five students less than age 9, a VO 2<br />
max will not<br />
be calculated, but the student will be reported in the HFZ.<br />
FITNESSGRAM <strong>Performance</strong> <strong>Standards</strong> 1 <strong>of</strong> 4 <strong>California</strong> <strong>Department</strong> <strong>of</strong> Education • August 2012
DEPARTMENT<br />
OF<br />
EDUCATION<br />
2 0 1 2 – 1 3 P h y s i c a l F i t n e s s T e s t ( P F T )<br />
STATE<br />
OF<br />
CALIFORNIA<br />
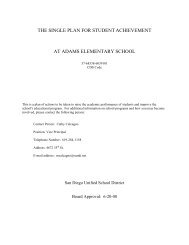
Females<br />
Age<br />
Abdominal<br />
Strength and<br />
Endurance<br />
Curl-Up<br />
# completed<br />
up to max <strong>of</strong> 75<br />
Trunk Extensor<br />
Strength and<br />
Flexibility<br />
Trunk Lift<br />
# <strong>of</strong> inches<br />
up to max <strong>of</strong> 12<br />
90 o Push-Up<br />
# completed<br />
up to max <strong>of</strong> 75<br />
Upper Body Strength<br />
and Endurance<br />
Modified<br />
Pull-Up<br />
# completed<br />
up to max <strong>of</strong> 75<br />
Flexed-Arm Hang<br />
# <strong>of</strong> seconds<br />
up to max <strong>of</strong> 90<br />
Back-Saver<br />
Sit & Reach 5<br />
# <strong>of</strong> inches<br />
up to max <strong>of</strong> 12<br />
5 ≥ 2 6 – 12 ≥ 3 ≥ 2 ≥ 2 9<br />
6 ≥ 2 6 – 12 ≥ 3 ≥ 2 ≥ 2 9<br />
7 ≥ 4 6 – 12 ≥ 4 ≥ 3 ≥ 3 9<br />
8 ≥ 6 6 – 12 ≥ 5 ≥ 4 ≥ 3 9<br />
9 ≥ 9 6 – 12 ≥ 6 ≥ 4 ≥ 4 9<br />
10 ≥ 12 9 – 12 ≥ 7 ≥ 4 ≥ 4 9<br />
11 ≥ 15 9 – 12 ≥ 7 ≥ 4 ≥ 6 10<br />
12 ≥ 18 9 – 12 ≥ 7 ≥ 4 ≥ 7 10<br />
13 ≥ 18 9 – 12 ≥ 7 ≥ 4 ≥ 8 10<br />
14 ≥ 18 9 – 12 ≥ 7 ≥ 4 ≥ 8 10<br />
15 ≥ 18 9 – 12 ≥ 7 ≥ 4 ≥ 8 12<br />
16 ≥ 18 9 – 12 ≥ 7 ≥ 4 ≥ 8 12<br />
17 ≥ 18 9 – 12 ≥ 7 ≥ 4 ≥ 8 12<br />
17+ ≥ 18 9 – 12 ≥ 7 ≥ 4 ≥ 8 12<br />
≥ The score is greater than or equal to the indicated value.<br />
≤ The score is less than or equal to the indicated value.<br />
Flexibility<br />
Shoulder Stretch<br />
Touching<br />
fingertips<br />
together behind<br />
the back on both<br />
the right and left<br />
sides.<br />
© 2010 by The Cooper Institute, Dallas, Texas. All rights reserved.<br />
5<br />
Student must reach the distance on both the right and left sides to achieve the HFZ.<br />
FITNESSGRAM <strong>Performance</strong> <strong>Standards</strong> 2 <strong>of</strong> 4 <strong>California</strong> <strong>Department</strong> <strong>of</strong> Education • August 2012
DEPARTMENT<br />
OF<br />
EDUCATION<br />
2 0 1 2 – 1 3 P h y s i c a l F i t n e s s T e s t ( P F T )<br />
STATE<br />
OF<br />
CALIFORNIA<br />
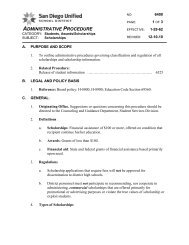
FITNESSGRAM <strong>Performance</strong> <strong>Standards</strong> 1<br />
For each test area, the FITNESSGRAM uses the Healthy Fitness Zone (HFZ) to evaluate fitness performance. For Aerobic Capacity and Body Composition, the<br />
FITNESSGRAM also provides Very Lean and Needs Improvement–Health Risk (NI–HR) standards to evaluate fitness performance. The performance goal for all test areas<br />
is the HFZ. These zones represent minimum levels <strong>of</strong> fitness that <strong>of</strong>fer protection against the diseases that result from sedentary living.<br />
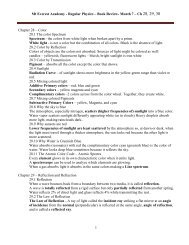
Males<br />
Aerobic Capacity Body Composition 3<br />
Skinfold Measurements /<br />
One-Mile Run / 20m PACER / Walk Test<br />
VO 2<br />
max (ml/kg/min) Bioelectric Impedance Analyzer<br />
2<br />
Percent Body Fat<br />
Body Mass Index<br />
Age<br />
NI – Health<br />
NI – Health<br />
NI – Health<br />
NI<br />
HFZ<br />
NI HFZ Very Lean<br />
Risk<br />
Risk<br />
Risk<br />
NI HFZ Very Lean<br />
5 VO 2<br />
max standards not available for ≥ 27.0 ≥ 18.9 18.8 – 8.9 ≤ 8.8 ≥ 17.5 ≥ 16.8 16.7 – 13.9 ≤ 13.8<br />
6 students ages 5 through 9 4 . For Walk ≥ 27.0 ≥ 18.9 18.8 – 8.5 ≤ 8.4 ≥ 17.8 ≥ 17.0 16.9 – 13.8 ≤ 13.7<br />
7 Test only, standards also not available ≥ 27.0 ≥ 18.9 18.8 – 8.3 ≤ 8.2 ≥ 18.3 ≥ 17.4 17.3 – 13.8 ≤ 13.7<br />
for students ages 10, 11, and 12.<br />
8 ≥ 27.0 ≥ 18.9 18.8 – 8.4 ≤ 8.3 ≥ 19.0 ≥ 17.9 17.8 – 13.9 ≤ 13.8<br />
9 ≥ 30.1 ≥ 20.7 20.6 – 8.7 ≤ 8.6 ≥ 19.9 ≥ 18.6 18.5 – 14.1 ≤ 14.0<br />
10 ≤ 37.3 37.4 – 40.1 ≥ 40.2 ≥ 33.2 ≥ 22.5 22.4 – 8.9 ≤ 8.8 ≥ 20.8 ≥ 19.0 18.9 – 14.3 ≤ 14.2<br />
11 ≤ 37.3 37.4 – 40.1 ≥ 40.2 ≥ 35.4 ≥ 23.7 23.6 – 8.8 ≤ 8.7 ≥ 21.8 ≥ 19.8 19.7 – 14.6 ≤ 14.5<br />
12 ≤ 37.6 37.7 – 40.2 ≥ 40.3 ≥ 35.9 ≥ 23.7 23.6 – 8.4 ≤ 8.3 ≥ 22.7 ≥ 20.6 20.5 – 15.1 ≤ 15.0<br />
13 ≤ 38.6 38.7 – 41.0 ≥ 41.1 ≥ 35.0 ≥ 22.9 22.8 – 7.8 ≤ 7.7 ≥ 23.6 ≥ 21.4 21.3 – 15.5 ≤ 15.4<br />
14 ≤ 39.6 39.7 – 42.4 ≥ 42.5 ≥ 33.2 ≥ 21.4 21.3 – 7.1 ≤ 7.0 ≥ 24.5 ≥ 22.2 22.1 – 16.1 ≤ 16.0<br />
15 ≤ 40.6 40.7 – 43.5 ≥ 43.6 ≥ 31.5 ≥ 20.2 20.1 – 6.6 ≤ 6.5 ≥ 25.3 ≥ 23.0 22.9 – 16.6 ≤ 16.5<br />
16 ≤ 41.0 41.1 – 44.0 ≥ 44.1 ≥ 31.6 ≥ 20.2 20.1 – 6.5 ≤ 6.4 ≥ 26.0 ≥ 23.8 23.7 – 17.2 ≤ 17.1<br />
17 ≤ 41.2 41.3 – 44.1 ≥ 44.2 ≥ 33.0 ≥ 21.0 20.9 – 6.7 ≤ 6.6 ≥ 26.7 ≥ 24.5 24.4 – 17.8 ≤ 17.7<br />
17+ ≤ 41.2 41.3 – 44.2 ≥ 44.3 ≥ 35.1 ≥ 22.3 22.2 – 7.0 ≤ 6.9 ≥ 27.5 ≥ 25.2 25.1 – 18.3 ≤ 18.2<br />
≥ The score is greater than or equal to the indicated value.<br />
≤ The score is less than or equal to the indicated value.<br />
1<br />
The FITNESSGRAM and Healthy Fitness Zones (HFZ) are registered trademarks <strong>of</strong> The Cooper Institute.<br />
2<br />
VO 2<br />
max reflects the maximum rate that oxygen can be taken up and utilized by the body during exercise. It is estimated by utilizing the student’s height, weight, and other specific information, which is based on the test option (i.e., One-Mile<br />
Run, 20m PACER, or Walk Test) administered. The calculation procedures are found in the Reference Guide on the <strong>California</strong> Physical Fitness Test (PFT) Resources Web page at http://www.pftdata.org/resources.aspx.<br />
3<br />
For Body Composition, the <strong>California</strong> <strong>Department</strong> <strong>of</strong> Education (CDE) considers a student who exceeds the HFZ as meeting the HFZ. Exceeding the HFZ means obtaining a score less than a number on the lower end or right side <strong>of</strong> the<br />
HFZ.<br />
4<br />
Grade five students age 9 with time or laps reported have a VO 2<br />
max calculated and are compared to the HFZ for students age 10. If a One-Mile Run time or PACER laps are reported for grade five students less than age 9, a VO 2<br />
max will not<br />
be calculated, but the student will be reported in the HFZ.<br />
FITNESSGRAM <strong>Performance</strong> <strong>Standards</strong> 3 <strong>of</strong> 4 <strong>California</strong> <strong>Department</strong> <strong>of</strong> Education • August 2012
DEPARTMENT<br />
OF<br />
EDUCATION<br />
2 0 1 2 – 1 3 P h y s i c a l F i t n e s s T e s t ( P F T )<br />
STATE<br />
OF<br />
CALIFORNIA<br />
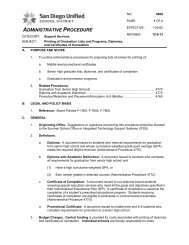
Males<br />
Abdominal<br />
Strength and<br />
Endurance<br />
Trunk Extensor<br />
Strength and<br />
Flexibility<br />
Upper Body Strength<br />
and Endurance<br />
Flexibility<br />
Age<br />
Curl-Up<br />
# completed<br />
up to max <strong>of</strong> 75<br />
Trunk Lift<br />
# <strong>of</strong> inches<br />
up to max <strong>of</strong> 12<br />
90 o Push-Up<br />
# completed<br />
up to max <strong>of</strong> 75<br />
Modified<br />
Pull-Up<br />
# completed<br />
up to max <strong>of</strong> 75<br />
Flexed-Arm Hang<br />
# <strong>of</strong> seconds<br />
up to max <strong>of</strong> 90<br />
Back-Saver<br />
Sit & Reach 5<br />
# <strong>of</strong> inches<br />
up to max <strong>of</strong> 12<br />
5 ≥ 2 6 – 12 ≥ 3 ≥ 2 ≥ 2 8<br />
6 ≥ 2 6 – 12 ≥ 3 ≥ 2 ≥ 2 8<br />
7 ≥ 4 6 – 12 ≥ 4 ≥ 3 ≥ 3 8<br />
8 ≥ 6 6 – 12 ≥ 5 ≥ 4 ≥ 3 8<br />
9 ≥ 9 6 – 12 ≥ 6 ≥ 5 ≥ 4 8<br />
10 ≥ 12 9 – 12 ≥ 7 ≥ 5 ≥ 4 8<br />
11 ≥ 15 9 – 12 ≥ 8 ≥ 6 ≥ 6 8<br />
12 ≥ 18 9 – 12 ≥ 10 ≥ 7 ≥ 10 8<br />
13 ≥ 21 9 – 12 ≥ 12 ≥ 8 ≥ 12 8<br />
14 ≥ 24 9 – 12 ≥ 14 ≥ 9 ≥ 15 8<br />
15 ≥ 24 9 – 12 ≥ 16 ≥ 10 ≥ 15 8<br />
16 ≥ 24 9 – 12 ≥ 18 ≥ 12 ≥ 15 8<br />
17 ≥ 24 9 – 12 ≥ 18 ≥ 14 ≥ 15 8<br />
17+ ≥ 24 9 – 12 ≥ 18 ≥ 14 ≥ 15 8<br />
≥ The score is greater than or equal to the indicated value.<br />
≤ The score is less than or equal to the indicated value.<br />
Shoulder Stretch<br />
Touching<br />
fingertips<br />
together behind<br />
the back on both<br />
the right and left<br />
sides.<br />
© 2010 by The Cooper Institute, Dallas, Texas. All rights reserved.<br />
5<br />
Student must reach the distance on both the right and left sides to achieve the HFZ.<br />
FITNESSGRAM <strong>Performance</strong> <strong>Standards</strong> 4 <strong>of</strong> 4 <strong>California</strong> <strong>Department</strong> <strong>of</strong> Education • August 2012