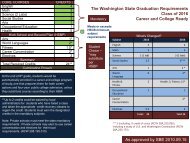
ppt - Washington State Board of Education
ppt - Washington State Board of Education
ppt - Washington State Board of Education

Create successful ePaper yourself
Turn your PDF publications into a flip-book with our unique Google optimized e-Paper software.
AMAOs for <strong>Washington</strong> <strong>State</strong><br />
Recommendations to the <strong>State</strong> <strong>Board</strong> <strong>of</strong> <strong>Education</strong><br />
May 8, 2013<br />
Gil Mendoza, Assistant Superintendent<br />
Migrant, Bilingual and Native <strong>Education</strong><br />
Office <strong>of</strong> Superintendent <strong>of</strong> Public Instruction
Proposal for Changing AMAO-1<br />
Student progress toward English pr<strong>of</strong>iciency
OSPI recommends<br />
1. estimate the median time to pr<strong>of</strong>iciency<br />
2. compute expected grade <strong>of</strong> pr<strong>of</strong>iciency<br />
3. compute WELPA transitional scale score required to<br />
reach transitional cut point<br />
4. establish annual student progress required to reach<br />
that scale score
OSPI recommends a prospective measurement <strong>of</strong> the<br />
median time to transition<br />
‣ by placement grade and placement level<br />
‣ median years to transition for students successfully transitioning<br />
‣ use 3 years <strong>of</strong> placement cohorts SY 2005-06 2006-07 2007-08<br />
- enough time has passed to minimize effect <strong>of</strong> censoring<br />
- covers testing using all three forms <strong>of</strong> the WLPT-II
4.0<br />
Years to Transition by Placement Year - Level 1<br />
3.5<br />
3.0<br />
Median Years<br />
2.5<br />
2.0<br />
1.5<br />
2006<br />
2007<br />
2008<br />
1.0<br />
0.5<br />
0.0<br />
K 1 2 3 4 5 6 7 8 9 10 11 12<br />
Grade at Placement
4.0<br />
Years to Transition by Placement Year - Level 1<br />
3.5<br />
3.0<br />
Median Years<br />
2.5<br />
2.0<br />
1.5<br />
2006<br />
2007<br />
2008<br />
avg<br />
1.0<br />
0.5<br />
0.0<br />
K 1 2 3 4 5 6 7 8 9 10 11 12<br />
Grade at Placement
4.0<br />
Years to Transition by Placement Year - Level 2<br />
3.5<br />
3.0<br />
Median Years<br />
2.5<br />
2.0<br />
1.5<br />
2006<br />
2007<br />
2008<br />
1.0<br />
0.5<br />
0.0<br />
K 1 2 3 4 5 6 7 8 9 10 11 12<br />
Grade at Placement
4.0<br />
Years to Transition by Placement Year - Level 2<br />
3.5<br />
3.0<br />
Median Years<br />
2.5<br />
2.0<br />
1.5<br />
2006<br />
2007<br />
2008<br />
avg<br />
1.0<br />
0.5<br />
0.0<br />
K 1 2 3 4 5 6 7 8 9 10 11 12<br />
Grade at Placement
4.0<br />
Years to Transition by Placement Year - Level 3<br />
3.5<br />
3.0<br />
Median Years<br />
2.5<br />
2.0<br />
1.5<br />
2006<br />
2007<br />
2008<br />
1.0<br />
0.5<br />
0.0<br />
K 1 2 3 4 5 6 7 8 9 10 11 12<br />
Grade at Placement
4.0<br />
Years to Transition by Placement Year - Level 3<br />
3.5<br />
3.0<br />
Median Years<br />
2.5<br />
2.0<br />
1.5<br />
2006<br />
2007<br />
2008<br />
avg<br />
1.0<br />
0.5<br />
0.0<br />
K 1 2 3 4 5 6 7 8 9 10 11 12<br />
Grade at Placement
4.0<br />
Years to Transition by Placement Level and Grade (3 YR AVG)<br />
3.5<br />
3.0<br />
Median Years<br />
2.5<br />
2.0<br />
1.5<br />
1.0<br />
0.5<br />
0.0<br />
Level 2<br />
Level 1<br />
Level 3<br />
K 1 2 3 4 5 6 7 8 9 10 11 12<br />
Grade at Placement
4.0<br />
Years to Transition by Placement Level and Grade (3 YR AVG)<br />
3.5<br />
Level 1<br />
3.0<br />
Median Years<br />
2.5<br />
2.0<br />
1.5<br />
1.0<br />
Level 2<br />
Level 3<br />
0.5<br />
0.0<br />
K 1 2 3 4 5 6 7 8 9 10 11 12<br />
Grade at Placement
4<br />
Years to Transition by Placement Level and Grade (3 YR AVG)<br />
3.5<br />
3<br />
Median Years<br />
2.5<br />
2<br />
1.5<br />
1<br />
0.5<br />
0<br />
K 1 2 3 4 5 6 7 8 9 10 11 12<br />
Grade at Placement
Preliminary Prospective Estimates<br />
Placement<br />
Average Years to Expected Years to<br />
Grade<br />
Transition<br />
Transition<br />
Level 1 Level 2 Level 3 Level 1 Level 2 Level 3<br />
K 2.6 2.4 1.7 3 2 2<br />
1 2.4 1.8 1.1 3 2 1<br />
2 2.7 1.6 0.9 3 2 1<br />
3 3.0 2.0 1.6 3 2 1<br />
4 2.8 1.6 1.4 3 2 1<br />
5 3.1 1.8 1.5 3 2 1<br />
6 3.3 2.2 0.9 3 2 1<br />
7 3.2 2.6 1.1 3 2 1<br />
8 3.0 2.4 1.0 3 2 1<br />
9 2.4 2.1 1.2 3 2 1<br />
10 2.0 1.5 0.6 2 2 1<br />
11 1.8 1.2 0.5 2 1 1<br />
12 1.4 1.3 0.4 1 1 0
Placement<br />
Grade<br />
Expected Years to<br />
Transition<br />
Expected Grade <strong>of</strong><br />
Transition<br />
Level 4 Cut Score <strong>of</strong><br />
expected grade<br />
Level 1 Level 2 Level 3 Level 1 Level 2 Level 3 Level 1 Level 2 Level 3<br />
K 3 2 2 2 2 2 511 511 494<br />
1 3 2 1 4 3 2 548 529 511<br />
2 3 2 1 5 4 3 553 548 529<br />
3 3 2 1 6 5 4 563 553 548<br />
4 3 2 1 7 6 5 575 563 553<br />
5 3 2 1 8 7 6 575 575 563<br />
6 3 2 1 9 8 7 575 575 575<br />
7 3 2 1 10 9 8 575 575 575<br />
8 3 2 1 11 10 9 577 575 575<br />
9 3 2 1 11 11 10 577 577 575<br />
10 2 2 1 12 12 11 577 577 577<br />
11 2 1 1 13 12 12 577 577 577<br />
12 1 1 0 13 13 12 577 577 577
Transitional Score<br />
WELPA Scale Score<br />
0 1 2<br />
3<br />
placement<br />
Years in TBIP
Transitional Score<br />
WELPA Scale Score<br />
0 1 2<br />
3<br />
placement<br />
Years in TBIP
Recommended procedure to establish AMAO-1 adequate annual growth<br />
Establish “on-track” to English pr<strong>of</strong>iciency<br />
1. Compute expected transition grade given placement grade and<br />
English pr<strong>of</strong>iciency level.<br />
2. Compute Level 4 cut score needed to transition at the expected<br />
grade.<br />
3. Set the adequate annual growth from 1 st annual test.<br />
Establish school/district/state targets <strong>of</strong> percent on-track<br />
4. Compute percent <strong>of</strong> students on-track or above by<br />
school/district.<br />
5. Establish target percent <strong>of</strong> students on-track or above such that<br />
85% <strong>of</strong> districts could meet that target.<br />
6. increase targets using exponential curve over years.
Proposal for Changing AMAO-2<br />
Set separate targets for each combination <strong>of</strong><br />
- Years in Program and Placement Level<br />
Proposal for Changing AMAO-3<br />
Set targets for math and reading scale scores below <strong>State</strong> standard for<br />
current Level 1 to Level 3<br />
Create an Ever ELL cell in the <strong>State</strong> Accountability Index
Making the case for “Ever ELL” cell<br />
ELL student academic pr<strong>of</strong>iciency in Reading and Math<br />
Michael Shapiro<br />
<strong>Washington</strong> <strong>State</strong> Bilingual <strong>Education</strong> Advisory Committee
The case for “Ever ELL” cell<br />
English language pr<strong>of</strong>iciency means academic performance<br />
is no longer related to language acquisition<br />
Current ELL subgroup<br />
- does not consider post transitional success<br />
- membership continuously changes<br />
“Ever ELL” subgroup gives credit for the rapid improvement<br />
in reading and mathematics following transition from ELL<br />
services
90%<br />
Percent Meeting <strong>State</strong> Standards 2012 by ELL Type<br />
80%<br />
70%<br />
60%<br />
50%<br />
40%<br />
72%<br />
61%<br />
69%<br />
61%<br />
38%<br />
35%<br />
55%<br />
50%<br />
74%<br />
63%<br />
53%<br />
46%<br />
77%<br />
65%<br />
30%<br />
20%<br />
26%<br />
24%<br />
22%<br />
21%<br />
Reading<br />
Math<br />
10%<br />
0%<br />
All Students<br />
Current ELL<br />
Recent ELL<br />
Recent&Current<br />
Active ELL<br />
Transition ELL<br />
Former ELL<br />
Ever ELL<br />
Never ELL<br />
T+1 & T+2<br />
Current ELL<br />
T+>2 Current &<br />
Recent &<br />
Former
100%<br />
Math Growth and Achievement 2012<br />
90%<br />
80%<br />
Percentage Meeting Standard<br />
70%<br />
60%<br />
50%<br />
40%<br />
30%<br />
Total = 61%<br />
Never<br />
ELL<br />
Current ELL<br />
Ever ELL<br />
Recent ELLs<br />
Former ELLs<br />
Transitional<br />
ELL<br />
20%<br />
10%<br />
Active ELL<br />
0%<br />
40 42 44 46 48 50 52 54 56 58 60<br />
Median Student Growth Percentile
100%<br />
Reading Growth and Achievement 2012<br />
90%<br />
80%<br />
Total = 74%<br />
Never<br />
ELL<br />
Former ELL<br />
Percentage Meeting Standard<br />
70%<br />
60%<br />
50%<br />
40%<br />
30%<br />
Current ELL<br />
Ever ELL<br />
Recent ELL<br />
Transitional<br />
ELL<br />
20%<br />
10%<br />
Active ELL<br />
0%<br />
40 42 44 46 48 50 52 54 56 58 60<br />
Median Student Growth Percentile
The case for “Ever ELL” cell<br />
Recognizes developmental nature <strong>of</strong> language acquisition<br />
Allows continual monitoring <strong>of</strong> all ESL students<br />
Encourages better service delivery<br />
Give schools credit for high academic growth after transition
AMAOs for <strong>Washington</strong> <strong>State</strong><br />
Recommendations to the <strong>State</strong> <strong>Board</strong> <strong>of</strong> <strong>Education</strong><br />
May 8, 2013<br />
Gil Mendoza, Assistant Superintendent<br />
Migrant, Bilingual and Native <strong>Education</strong><br />
Office <strong>of</strong> Superintendent <strong>of</strong> Public Instruction