Medicare Health Plan Quality and Performance Ratings 2011 Part C ...
Medicare Health Plan Quality and Performance Ratings 2011 Part C ...
Medicare Health Plan Quality and Performance Ratings 2011 Part C ...
Create successful ePaper yourself
Turn your PDF publications into a flip-book with our unique Google optimized e-Paper software.
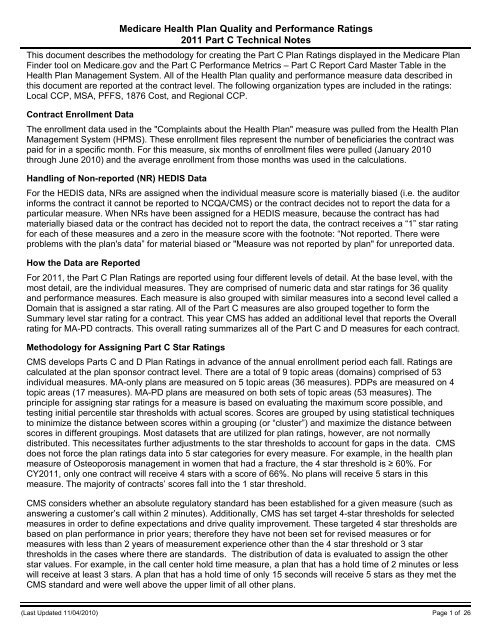
<strong>Medicare</strong> <strong>Health</strong> <strong>Plan</strong> <strong>Quality</strong> <strong>and</strong> <strong>Performance</strong> <strong>Ratings</strong><br />
<strong>2011</strong> <strong>Part</strong> C Technical Notes<br />
This document describes the methodology for creating the <strong>Part</strong> C <strong>Plan</strong> <strong>Ratings</strong> displayed in the <strong>Medicare</strong> <strong>Plan</strong><br />
Finder tool on <strong>Medicare</strong>.gov <strong>and</strong> the <strong>Part</strong> C <strong>Performance</strong> Metrics – <strong>Part</strong> C Report Card Master Table in the<br />
<strong>Health</strong> <strong>Plan</strong> Management System. All of the <strong>Health</strong> <strong>Plan</strong> quality <strong>and</strong> performance measure data described in<br />
this document are reported at the contract level. The following organization types are included in the ratings:<br />
Local CCP, MSA, PFFS, 1876 Cost, <strong>and</strong> Regional CCP.<br />
Contract Enrollment Data<br />
The enrollment data used in the "Complaints about the <strong>Health</strong> <strong>Plan</strong>" measure was pulled from the <strong>Health</strong> <strong>Plan</strong><br />
Management System (HPMS). These enrollment files represent the number of beneficiaries the contract was<br />
paid for in a specific month. For this measure, six months of enrollment files were pulled (January 2010<br />
through June 2010) <strong>and</strong> the average enrollment from those months was used in the calculations.<br />
H<strong>and</strong>ling of Non-reported (NR) HEDIS Data<br />
For the HEDIS data, NRs are assigned when the individual measure score is materially biased (i.e. the auditor<br />
informs the contract it cannot be reported to NCQA/CMS) or the contract decides not to report the data for a<br />
particular measure. When NRs have been assigned for a HEDIS measure, because the contract has had<br />
materially biased data or the contract has decided not to report the data, the contract receives a “1” star rating<br />
for each of these measures <strong>and</strong> a zero in the measure score with the footnote: “Not reported. There were<br />
problems with the plan's data” for material biased or "Measure was not reported by plan" for unreported data.<br />
How the Data are Reported<br />
For <strong>2011</strong>, the <strong>Part</strong> C <strong>Plan</strong> <strong>Ratings</strong> are reported using four different levels of detail. At the base level, with the<br />
most detail, are the individual measures. They are comprised of numeric data <strong>and</strong> star ratings for 36 quality<br />
<strong>and</strong> performance measures. Each measure is also grouped with similar measures into a second level called a<br />
Domain that is assigned a star rating. All of the <strong>Part</strong> C measures are also grouped together to form the<br />
Summary level star rating for a contract. This year CMS has added an additional level that reports the Overall<br />
rating for MA-PD contracts. This overall rating summarizes all of the <strong>Part</strong> C <strong>and</strong> D measures for each contract.<br />
Methodology for Assigning <strong>Part</strong> C Star <strong>Ratings</strong><br />
CMS develops <strong>Part</strong>s C <strong>and</strong> D <strong>Plan</strong> <strong>Ratings</strong> in advance of the annual enrollment period each fall. <strong>Ratings</strong> are<br />
calculated at the plan sponsor contract level. There are a total of 9 topic areas (domains) comprised of 53<br />
individual measures. MA-only plans are measured on 5 topic areas (36 measures). PDPs are measured on 4<br />
topic areas (17 measures). MA-PD plans are measured on both sets of topic areas (53 measures). The<br />
principle for assigning star ratings for a measure is based on evaluating the maximum score possible, <strong>and</strong><br />
testing initial percentile star thresholds with actual scores. Scores are grouped by using statistical techniques<br />
to minimize the distance between scores within a grouping (or “cluster”) <strong>and</strong> maximize the distance between<br />
scores in different groupings. Most datasets that are utilized for plan ratings, however, are not normally<br />
distributed. This necessitates further adjustments to the star thresholds to account for gaps in the data. CMS<br />
does not force the plan ratings data into 5 star categories for every measure. For example, in the health plan<br />
measure of Osteoporosis management in women that had a fracture, the 4 star threshold is ≥ 60%. For<br />
CY<strong>2011</strong>, only one contract will receive 4 stars with a score of 66%. No plans will receive 5 stars in this<br />
measure. The majority of contracts’ scores fall into the 1 star threshold.<br />
CMS considers whether an absolute regulatory st<strong>and</strong>ard has been established for a given measure (such as<br />
answering a customer’s call within 2 minutes). Additionally, CMS has set target 4-star thresholds for selected<br />
measures in order to define expectations <strong>and</strong> drive quality improvement. These targeted 4 star thresholds are<br />
based on plan performance in prior years; therefore they have not been set for revised measures or for<br />
measures with less than 2 years of measurement experience other than the 4 star threshold or 3 star<br />
thresholds in the cases where there are st<strong>and</strong>ards. The distribution of data is evaluated to assign the other<br />
star values. For example, in the call center hold time measure, a plan that has a hold time of 2 minutes or less<br />
will receive at least 3 stars. A plan that has a hold time of only 15 seconds will receive 5 stars as they met the<br />
CMS st<strong>and</strong>ard <strong>and</strong> were well above the upper limit of all other plans.<br />
(Last Updated 11/04/2010) Page 1 of 26
When CMS has not set a st<strong>and</strong>ard for a measure, the maximum score possible is considered as a first step in<br />
setting the initial 5 star thresholds. Again, these thresholds may require adjustments to accommodate the<br />
actual distribution of data. After this analysis is complete, the measures’ underlying scores, star rating,<br />
domain scores, <strong>and</strong> summary scores are posted on the <strong>Medicare</strong> <strong>Plan</strong> Finder tool on www.medicare.gov.<br />
See Attachment A for more details about the methodology.<br />
Methodology for Calculating Stars at the Domain Level<br />
The domain score is a simple average of the star values assigned to each individual measure under the<br />
domain. A minimum number of individual measures is needed to produce a domain score.<br />
Minimum Number of Measures<br />
Domain<br />
Needed to Calculate a Domain Score<br />
Staying <strong>Health</strong>y: Screenings, Tests <strong>and</strong> Vaccines 6 out of 13<br />
Managing Chronic (Long Term) Conditions 5 out of 10<br />
<strong>Ratings</strong> of <strong>Health</strong> <strong>Plan</strong> Responsiveness <strong>and</strong> Care 3 out of 6<br />
<strong>Health</strong> <strong>Plan</strong> Members' Complaints <strong>and</strong> Appeals 2 out of 4<br />
<strong>Health</strong> <strong>Plan</strong> Telephone Customer Service 2 out of 3<br />
Methodology for Calculating Stars at the Summary Rating for <strong>Part</strong> C<br />
A summary rating for <strong>Part</strong> C is calculated by taking an average of the measure level stars. Additionally, to<br />
incorporate performance stability into the rating process, CMS has used an approach that utilizes both the<br />
mean <strong>and</strong> the variance of individual performance ratings to differentiate contracts for the summary score. That<br />
is, a measure of individual performance score dispersion, specifically an integration factor (i-Factor), has been<br />
added to the mean score for rewarding contracts if they have both high <strong>and</strong> stable relative performance.<br />
Details about the integration factor can be found in the section titled Applying the Integration Factor.<br />
For the summary score half scores are also assigned to allow more variation across contracts. To have a<br />
summary score, all contracts from organization type other than PFFS <strong>and</strong> MSA need to have at least 18 of the<br />
36 <strong>Part</strong> C measures. Note: The colorectal screening measure (C02) is not included in the summary calculation<br />
for local <strong>and</strong> regional PPOs. PFFS <strong>and</strong> MSA organizations need to have at least 8 of the 15 <strong>Part</strong> C measures<br />
that they are required to report.<br />
Methodology for Calculating the Overall MA-PD Summary Star<br />
The overall summary plan rating for MA-PD contracts is calculated by taking an average of the <strong>Part</strong> C <strong>and</strong> D<br />
measure level stars. There are 53 measures (36 in <strong>Part</strong> C, 17 in <strong>Part</strong> D) total. The Complaints Tracking<br />
Module measures for <strong>Part</strong> C <strong>and</strong> D share the same data source. Where the <strong>Part</strong> C <strong>and</strong> D measures use the<br />
same data source, CMS has used the <strong>Part</strong> C measure (<strong>and</strong> not the <strong>Part</strong> D measure) in calculating the overall<br />
plan rating. This results in a total of 51 measures (the two <strong>Part</strong> D CTM measures are equivalent to the one<br />
<strong>Part</strong> C CTM measure). Additionally, CMS is using the same integration factor approach used in calculating the<br />
summary level stars for the <strong>Part</strong> C ratings. Details about the integration factor can be found in the section titled<br />
Applying the Integration Factor.<br />
For the overall plan rating, half scores are also assigned to allow more variation across contracts. For MA-PDs<br />
to have an overall plan rating, contracts from organization types other than PFFS <strong>and</strong> MSA need stars for at<br />
least 26 of the 51 measures. Note: The colorectal screening measure (C02) is not included in the overall<br />
calculation for local <strong>and</strong> regional PPOs. PFFS <strong>and</strong> MSA organizations need at least 15 of the 30 measures on<br />
which they are required to report.<br />
If a contract does not have a summary rating for <strong>Part</strong> C or a summary rating for <strong>Part</strong> D, the overall MA-PD<br />
summary rating is not calculated.<br />
(Last Updated 11/04/2010) Page 2 of 26
Applying the Integration Factor<br />
The following represents the steps taken to calculate <strong>and</strong> include the i-Factor in the <strong>Plan</strong> <strong>Ratings</strong> Summary<br />
<strong>and</strong> Overall <strong>Ratings</strong>:<br />
• Calculate the mean <strong>and</strong> the variance of all of the individual performance measure stars at the contract level<br />
• Categorize the variance into three categories<br />
▪ low (0 to 30th percentile),<br />
▪ medium (30th to 70th percentile) <strong>and</strong><br />
▪ high (70th percentile <strong>and</strong> above)<br />
• Develop the i-Factor as follows:<br />
▪ i-Factor = 0.4 (for contract w/low-variability high-mean (mean >= 85th percentile)<br />
▪ i-Factor = 0.3 (for contract w/medium-variability high-mean (mean >= 85th percentile)<br />
▪ i-Factor = 0.2 (for contract w/low-variability relatively high-mean (mean >= 65th < 85th percentile)<br />
▪ i-Factor = 0.1 (for contract w/medium-variability relatively high-mean (mean >= 65th < 85th percentile)<br />
▪ i-Factor = 0.0 (for other types of contracts)<br />
• Add i-Factor to the mean overall score by contract to develop final summary score using 0.5:<br />
▪ 0.5, 1.0, 1.5, 2.0, 2.5, 3.0, 3.5, 4.0, 4.5, <strong>and</strong> 5.0<br />
• Apply rounding to final summary score such that stars that are within the distance of .25 above or below <br />
any half star scale will be rounded to that half star scale.<br />
Methodology for Calculating the Low Performing Contract Indicator<br />
The low performing contract indicator is calculated by evaluating the <strong>Part</strong> C summary star rating for the<br />
current year <strong>and</strong> the past two years (i.e., the 2009, 2010 <strong>and</strong> <strong>2011</strong> plan ratings). If the contract has had a <strong>Part</strong><br />
C summary rating of 2.5 or lower for all three years of data, they are marked as a low performing contract.<br />
Each contract must have a <strong>Part</strong> C summary star rating for all three years to be considered for this indicator.<br />
CAHPS Methodology<br />
The table below contains the actual cut point values used in processing each CAHPS measure <strong>and</strong> the rules<br />
applied to the actual data to produce the final star rating in these measures. The values are case-mix adjusted<br />
for measures C24 – C29. See Attachment B for the case-mix adjusters.<br />
Measure<br />
2 Star Cut point<br />
(15 %tile)<br />
3 Star Cut Point<br />
(30 %tile)<br />
4 Star<br />
Threshold<br />
5 Star Cut Point<br />
(80 %tile)<br />
C07 ‐ Annual Flu Vaccine 56.1767 60.9714 70.6329 72.7475<br />
C08 ‐ Pneumonia Vaccine 54.5539 62.7547 69.8590 75.7560<br />
C24 ‐ Getting Needed Care 80.3339 82.9673 85.0912 87.4859<br />
C25 ‐ Doctors who Communicate Well 87.4397 88.5353 90.1535 91.0142<br />
C26 ‐ Getting Appointments <strong>and</strong> Care Quickly 69.8424 71.7555 75.3601 77.4666<br />
C27 ‐ Customer Service 83.8092 85.4459 88.4232 91.2952<br />
C28 ‐ Overall Rating of <strong>Health</strong> Care <strong>Quality</strong> 81.0850 82.9058 85.1088 86.4981<br />
C29 ‐ Overall Rating of <strong>Plan</strong> 77.6961 80.3273 85.0271 87.1360<br />
The base stars are the number of stars assigned prior to taking into account statistical significance <strong>and</strong><br />
reliability. Both statistical significance <strong>and</strong> reliability are taken into account in the final assignment of stars.<br />
These are the rules applied to the base star values to arrive at the final CAHPS measure star value:<br />
5 base stars: If significance is NOT above average OR reliability is low, the Final Star value equals 4.<br />
4 base stars: Always stays 4 Final Stars.<br />
3 base stars: If significance is below average, the Final Star value equals 2.<br />
2 base stars: If significance is NOT below average AND reliability is low, the Final Star value equals 3.<br />
1 base star: If significance is NOT below average AND reliability is low, the Final Star value equals 3 or<br />
If significance is below average <strong>and</strong> reliability is low, the Final Stars Value equals 2 or<br />
If significance is not below average <strong>and</strong> reliability is not low, the Final Stars Value equals 2.<br />
(Last Updated 11/04/2010) Page 3 of 26
Domain <strong>and</strong> Measure details<br />
See Attachment C for the national averages of each individual measure.<br />
Domain: 1 - Staying <strong>Health</strong>y: Screenings, Tests <strong>and</strong> Vaccines<br />
Measure: C01 - Breast Cancer Screening<br />
Label for Stars: Breast Cancer Screening<br />
Label for Data: Breast Cancer Screening<br />
HEDIS Label: Breast Cancer Screening (BCS)<br />
Description: Percent of female plan members aged 40-69 who had a mammogram during the past 2<br />
years.<br />
Metric: Percent of female MA enrollees ages 40 to 69 (denominator) who had a mammogram<br />
during the measurement year or the year prior to the measurement year (numerator).<br />
Data Source: HEDIS Data Time Frame: 1/1/2009 - 12/31/2009<br />
Statistical Method: Relative Distribution with Clustering<br />
General Trend: Higher is better<br />
Data Display: Percentage with no decimal point PFFS & MSA Reporting: Voluntary<br />
4 Star Threshold: ≥ 74% All other Orgs Reporting: Required<br />
1 Star: < 59%<br />
Cut Points: 2 Stars: ≥ 59% <strong>and</strong> < 69%<br />
3 Stars: ≥ 69% <strong>and</strong> < 74%<br />
4 Stars: ≥ 74% <strong>and</strong> < 82%<br />
5 Stars: ≥ 82%<br />
Measure: C02 - Colorectal Cancer Screening<br />
Label for Stars: Colorectal Cancer Screening<br />
Label for Data: Colorectal Cancer Screening<br />
HEDIS Label: Colorectal Cancer Screening (COL)<br />
Description: Percent of plan members aged 50-75 who had appropriate screening for colon cancer.<br />
Metric: Percent of MA enrollees aged 50 to 75 (denominator) who had appropriate screening for<br />
colorectal cancer (numerator).<br />
Data Source: HEDIS Data Time Frame: 1/1/2009 - 12/31/2009<br />
Statistical Method: Relative Distribution with Clustering<br />
General Trend: Higher is better<br />
Data Display: Percentage with no decimal point PFFS & MSA Reporting: Voluntary<br />
4 Star Threshold: ≥ 58% All other Orgs Reporting: Required<br />
1 Star: < 36%<br />
Cut Points: 2 Stars: ≥ 36% <strong>and</strong> < 48%<br />
3 Stars: ≥ 48% <strong>and</strong> < 58%<br />
4 Stars: ≥ 58% <strong>and</strong> < 70%<br />
5 Stars: ≥ 70%<br />
(Last Updated 11/04/2010) Page 4 of 26
Measure: C03 - Cardiovascular Care - Cholesterol Screening<br />
Label for Stars: Cholesterol Screening for Patients with Heart Disease<br />
Label for Data: Cholesterol Screening for Patients with Heart Disease<br />
HEDIS Label: Cholesterol Management for Patients With Cardiovascular Conditions (CMC)<br />
Description: Percent of plan members with heart disease who have had a test for “bad” (LDL)<br />
cholesterol within the past year.<br />
Metric: Percent of MA enrollees age 18-75 with ischemic vascular disease, AMI, coronary<br />
bypass Graft (CABG) or percutaneous transluminal coronary angioplasty (PTCA)<br />
(denominator) who had LDL-C test performed during the measurement year (numerator).<br />
Data Source: HEDIS Data Time Frame: 1/1/2009 - 12/31/2009<br />
Statistical Method: Relative Distribution with Clustering<br />
General Trend: Higher is better<br />
Data Display: Percentage with no decimal point PFFS & MSA Reporting: Voluntary<br />
4 Star Threshold: ≥ 85% All other Orgs Reporting: Required<br />
1 Star: < 72%<br />
Cut Points: 2 Stars: ≥ 72% <strong>and</strong> < 79%<br />
3 Stars: ≥ 79% <strong>and</strong> < 85%<br />
4 Stars: ≥ 85% <strong>and</strong> < 93%<br />
5 Stars: ≥ 93%<br />
Measure: C04 - Diabetes Care - Cholesterol Screening<br />
Label for Stars: Cholesterol Screening for Patients with Diabetes<br />
Label for Data: Cholesterol Screening for Patients with Diabetes<br />
HEDIS Label: Comprehensive Diabetes Care (CDC) – LDL-C Screening<br />
Description: Percent of plan members with diabetes who have had a test for “bad” (LDL) cholesterol<br />
within the past year.<br />
Metric: Percent of diabetic MA enrollees 18-75 with diabetes type I <strong>and</strong> II (denominator) who<br />
had an LDL-C test performed during the measurement year (numerator).<br />
Data Source: HEDIS Data Time Frame: 1/1/2009 - 12/31/2009<br />
Statistical Method: Relative Distribution with Clustering<br />
General Trend: Higher is better<br />
Data Display: Percentage with no decimal point PFFS & MSA Reporting: Voluntary<br />
4 Star Threshold: ≥ 85% All other Orgs Reporting: Required<br />
1 Star: < 73%<br />
Cut Points: 2 Stars: ≥ 73% <strong>and</strong> < 81%<br />
3 Stars: ≥ 81% <strong>and</strong> < 85%<br />
4 Stars: ≥ 85% <strong>and</strong> < 89%<br />
5 Stars: ≥ 89%<br />
(Last Updated 11/04/2010) Page 5 of 26
Measure: C05 - Glaucoma Testing<br />
Label for Stars: Glaucoma Testing<br />
Label for Data: Glaucoma Testing<br />
HEDIS Label: Glaucoma Screening in Older Adults (GSO)<br />
Description: Percent of senior plan members who got a glaucoma eye exam for early detection.<br />
Metric: Percent of MA enrollees aged 65 or older without a prior diagnosis of glaucoma<br />
(denominator) who had at least one glaucoma exam by an eye doctor during the<br />
measurement year (numerator).<br />
Data Source: HEDIS Data Time Frame: 1/1/2009 - 12/31/2009<br />
Statistical Method: Relative Distribution with Clustering<br />
General Trend: Higher is better<br />
Data Display: Percentage with no decimal point PFFS & MSA Reporting: Voluntary<br />
4 Star Threshold: ≥ 70% All other Orgs Reporting: Required<br />
1 Star: < 51%<br />
Cut Points: 2 Stars: ≥ 51% <strong>and</strong> < 57%<br />
3 Stars: ≥ 57% <strong>and</strong> < 70%<br />
4 Stars: ≥ 70% <strong>and</strong> < 76%<br />
5 Stars: ≥ 76%<br />
Measure: C06 - Appropriate Monitoring for Patients Taking Long Term Medications<br />
Label for Stars: Monitoring of Patients Taking Long-term Medications<br />
Label for Data: Monitoring of Patients Taking Long-term Medications<br />
HEDIS Label: Annual Monitoring for Patients on Persistent Medications (MPM)<br />
Description: Percent of plan members who got a 6 month (or longer) prescription for a drug known to<br />
have possibly harmful side effects among seniors if used long-term, <strong>and</strong> who had at<br />
least one appropriate follow-up visit during the year to monitor these medications:<br />
Angiotensin Converting Enzyme (ACE) inhibitors, Angiotensin Receptor Blockers (ARB),<br />
digoxin, diuretics <strong>and</strong> anticonvulsants.<br />
Metric: Percent of MA enrollees 18 or older who received at least a 180 day supply of<br />
ambulatory medication therapy for a select therapeutic agent (denominator), <strong>and</strong> who<br />
received at least one monitoring event appropriate for the specific therapeutic agent<br />
during the measurement year (numerator).<br />
Data Source: HEDIS Data Time Frame: 1/1/2009 - 12/31/2009<br />
Statistical Method: Relative Distribution with Clustering<br />
General Trend: Higher is better<br />
Data Display: Percentage with no decimal point PFFS & MSA Reporting: Voluntary<br />
4 Star Threshold: ≥ 90% All other Orgs Reporting: Required<br />
1 Star: < 70%<br />
Cut Points: 2 Stars: ≥ 70% <strong>and</strong> < 78%<br />
3 Stars: ≥ 78% <strong>and</strong> < 90%<br />
4 Stars: ≥ 90% <strong>and</strong> < 92%<br />
5 Stars: ≥ 92%<br />
(Last Updated 11/04/2010) Page 6 of 26
Measure: C07 - Annual Flu Vaccine<br />
Label for Stars: Annual Flu Vaccine<br />
Label for Data: Annual Flu Vaccine<br />
Description: Percent of plan members aged 65+ who got a vaccine (flu shot) prior to flu season.<br />
Metric: Percent of sampled <strong>Medicare</strong> enrollees (denominator) who received an influenza<br />
vaccination between September – December during the measurement year (numerator).<br />
• Have you had a flu shot since September 2009?<br />
Data Source: CAHPS Data Time Frame: Feb - June 2010<br />
Statistical Method: Relative Distribution <strong>and</strong><br />
General Trend: Higher is better<br />
Significance Testing<br />
Data Display: Rate with 2 decimal points<br />
PFFS & MSA Reporting: Required<br />
4 Star Threshold: ≥ 70.6329% All other Orgs Reporting: Required<br />
1 Star: A contract is assigned 1 star if the contract’s average CAHPS measure<br />
Cut Points: score is ranked below the 15th percentile <strong>and</strong> the contract’s average<br />
CAHPS measure score is statistically significantly lower than the national<br />
average CAHPS measure score.<br />
2 Stars: A contract is assigned 2 stars if it does not meet the 1 star criteria <strong>and</strong><br />
meets at least one of these two criteria: (a) the contract’s average CAHPS<br />
measure score is lower than the 30th percentile OR (b) the contract’s<br />
average CAHPS measure score is statistically significantly lower than the<br />
national average CAHPS measure score.<br />
3 Stars: A contract is assigned 3 stars if the contract’s average CAHPS measure<br />
score is ranked above the 30th percentile (inclusive) <strong>and</strong> the contract’s<br />
average CAHPS measure score is below the cutoff defined for 4 stars.<br />
4 Stars: A contract is assigned 4 stars if it does not meet the 5 star criteria, but the<br />
contract’s average CAHPS measure score exceeds a cutoff defined by the<br />
60th percentile of plan means in 2009 CAHPS reports for the same measure.<br />
5 Stars: A contract is assigned 5 stars if the contract’s average CAHPS measure<br />
score is ranked above the 80th percentile <strong>and</strong> the contract’s average<br />
CAHPS measure score is statistically significantly higher than the national<br />
average CAHPS measure score.<br />
(Last Updated 11/04/2010) Page 7 of 26
Measure: C08 - Pneumonia Vaccine<br />
Label for Stars: Pneumonia Vaccine<br />
Label for Data: Pneumonia Vaccine<br />
Description: Percent of plan members aged 65+ who ever got a vaccine (shot) to prevent pneumonia.<br />
Metric: Percent of sampled <strong>Medicare</strong> enrollees (denominator) who reported ever having<br />
received a pneumococcal vaccine (numerator).<br />
• Have you ever had a pneumonia shot? This shot is usually given only once or twice in<br />
a person’s lifetime <strong>and</strong> is different from the flu.<br />
Data Source: CAHPS Data Time Frame: Feb - June 2010<br />
Statistical Method: Relative Distribution <strong>and</strong><br />
General Trend: Higher is better<br />
Significance Testing<br />
Data Display: Rate with 2 decimal points<br />
PFFS & MSA Reporting: Required<br />
4 Star Threshold: ≥ 69.8590% All other Orgs Reporting: Required<br />
1 Star: A contract is assigned 1 star if the contract’s average CAHPS measure<br />
Cut Points: score is ranked below the 15th percentile <strong>and</strong> the contract’s average<br />
CAHPS measure score is statistically significantly lower than the national<br />
average CAHPS measure score.<br />
2 Stars: A contract is assigned 2 stars if it does not meet the 1 star criteria <strong>and</strong><br />
meets at least one of these two criteria: (a) the contract’s average CAHPS<br />
measure score is lower than the 30th percentile OR (b) the contract’s<br />
average CAHPS measure score is statistically significantly lower than the<br />
national average CAHPS measure score.<br />
3 Stars: A contract is assigned 3 stars if the contract’s average CAHPS measure<br />
score is ranked above the 30th percentile (inclusive) <strong>and</strong> the contract’s<br />
average CAHPS measure score is below the cutoff defined for 4 stars.<br />
4 Stars: A contract is assigned 4 stars if it does not meet the 5 star criteria, but the<br />
contract’s average CAHPS measure score exceeds a cutoff defined by the<br />
60th percentile of plan means in 2009 CAHPS reports for the same measure.<br />
5 Stars: A contract is assigned 5 stars if the contract’s average CAHPS measure<br />
score is ranked above the 80th percentile <strong>and</strong> the contract’s average<br />
CAHPS measure score is statistically significantly higher than the national<br />
average CAHPS measure score.<br />
Measure: C09 - Improving or Maintaining Physical <strong>Health</strong><br />
Label for Stars: Improving or Maintaining Physical <strong>Health</strong><br />
Label for Data: Improving or Maintaining Physical <strong>Health</strong><br />
Description: Percent of all plan members whose physical health was the same or better than<br />
expected after two years.<br />
Metric: Percent of sampled <strong>Medicare</strong> enrollees (denominator) whose physical health status was<br />
the same, or better than expected (numerator).<br />
Data Source: HOS Data Time Frame: Apr - Aug 2009<br />
Statistical Method: Relative Distribution with Clustering<br />
General Trend: Higher is better<br />
Data Display: Percentage with no decimal point PFFS & MSA Reporting: Voluntary<br />
4 Star Threshold: ≥ 60% All other Orgs Reporting: Required<br />
1 Star: Not Applicable<br />
Cut Points: 2 Stars: < 57%<br />
3 Stars: ≥ 57% <strong>and</strong> < 60%<br />
4 Stars: ≥ 60% <strong>and</strong> < 68%<br />
5 Stars: ≥ 68%<br />
(Last Updated 11/04/2010) Page 8 of 26
Measure: C10 - Improving or Maintaining Mental <strong>Health</strong><br />
Label for Stars: Improving or Maintaining Mental <strong>Health</strong><br />
Label for Data: Improving or Maintaining Mental <strong>Health</strong><br />
Description: Percent of all plan members whose mental health was the same or better than expected<br />
after two years.<br />
Metric: Percent of sampled <strong>Medicare</strong> enrollees (denominator) whose mental health status was<br />
the same or better than expected (numerator).<br />
Data Source: HOS Data Time Frame: Apr - Aug 2009<br />
Statistical Method: Relative Distribution with Clustering<br />
General Trend: Higher is better<br />
Data Display: Percentage with no decimal point PFFS & MSA Reporting: Voluntary<br />
4 Star Threshold: ≥ 85% All other Orgs Reporting: Required<br />
1 Star: < 76%<br />
Cut Points: 2 Stars: ≥ 76 <strong>and</strong> < 81%<br />
3 Stars: ≥ 81 <strong>and</strong> < 85%<br />
4 Stars: ≥ 85% <strong>and</strong> < 95%<br />
5 Stars: ≥ 95%<br />
Measure: C11 - Osteoporosis Testing<br />
Label for Stars: Osteoporosis Testing<br />
Label for Data: Osteoporosis Testing<br />
HEDIS Label: Osteoporosis Testing in Older Women (OTO)<br />
Description: Percent of female, senior plan members who had a bone density test to check for<br />
osteoporosis (fragile bones).<br />
Metric: Percent of sampled <strong>Medicare</strong> female enrollees 65 years of age or older (denominator)<br />
who report ever having received a bone density test to check for osteoporosis<br />
(numerator).<br />
Data Source: HEDIS / HOS Data Time Frame: Apr - Aug 2009<br />
Statistical Method: Relative Distribution with Clustering<br />
General Trend: Higher is better<br />
Data Display: Percentage with no decimal point PFFS & MSA Reporting: Voluntary<br />
4 Star Threshold: ≥ 73% All other Orgs Reporting: Required<br />
1 Star: < 57%<br />
Cut Points: 2 Stars: ≥ 57% <strong>and</strong> < 62%<br />
3 Stars: ≥ 62% <strong>and</strong> < 73%<br />
4 Stars: ≥ 73% <strong>and</strong> < 79%<br />
5 Stars: ≥ 79%<br />
(Last Updated 11/04/2010) Page 9 of 26
Measure: C12 - Monitoring Physical Activity<br />
Label for Stars: Monitoring Physical Activity<br />
Label for Data: Monitoring Physical Activity<br />
HEDIS Label: Physical Activity in Older Adults (PAO)<br />
Description: Percent of senior plan members who discussed exercise with their doctor <strong>and</strong> were<br />
advised to start, increase or maintain their physical activity during the year.<br />
Metric: Percent of sampled <strong>Medicare</strong> enrollees 65 years of age or older (denominator) who had<br />
a doctor’s visit in the past 12 months <strong>and</strong> who received advice to start, increase or<br />
maintain their level exercise or physical activity (numerator).<br />
Data Source: HEDIS / HOS Data Time Frame: Apr - Aug 2009<br />
Statistical Method: Relative Distribution with Clustering<br />
General Trend: Higher is better<br />
Data Display: Percentage with no decimal point PFFS & MSA Reporting: Voluntary<br />
4 Star Threshold: ≥ 60% All other Orgs Reporting: Required<br />
1 Star: < 46%<br />
Cut Points: 2 Stars: ≥ 46% <strong>and</strong> < 51%<br />
3 Stars: ≥ 51% <strong>and</strong> < 60%<br />
4 Stars: ≥ 60% <strong>and</strong> < 85%<br />
5 Stars: ≥ 85%<br />
Measure: C13 - Access to Primary Care Doctor Visits<br />
Label for Stars: At Least One Primary Care Doctor Visit in the Last Year<br />
Label for Data: At Least One Primary Care Doctor Visit in the Last Year<br />
HEDIS Label: Adults’ Access to Preventive/Ambulatory <strong>Health</strong> Services (AAP)<br />
Description: Percent of all plan members who saw their primary care doctor during the year.<br />
Metric: Percent of MA enrollees age 20 <strong>and</strong> older (denominator) who had an ambulatory or<br />
preventive care visits during the measurement year (numerator).<br />
Data Source: HEDIS Data Time Frame: 1/1/2009 - 12/31/2009<br />
Statistical Method: Relative Distribution with Clustering<br />
General Trend: Higher is better<br />
Data Display: Percentage with no decimal point PFFS & MSA Reporting: Voluntary<br />
4 Star Threshold: ≥ 85% All other Orgs Reporting: Required<br />
1 Star: < 74%<br />
Cut Points: 2 Stars: ≥ 74% <strong>and</strong> < 81%<br />
3 Stars: ≥ 81% <strong>and</strong> < 85%<br />
4 Stars: ≥ 85% <strong>and</strong> < 94%<br />
5 Stars: ≥ 94%<br />
(Last Updated 11/04/2010) Page 10 of 26
Domain: 2 - Managing Chronic (Long Term) Conditions<br />
Measure: C14 - Osteoporosis Management in Women who had a Fracture<br />
Label for Stars: Osteoporosis Management<br />
Label for Data: Osteoporosis Management<br />
HEDIS Label: Osteoporosis Management in Women Who Had a Fracture (OMW)<br />
Description: Percent of female plan members who broke a bone <strong>and</strong> got screening or treatment for<br />
osteoporosis within 6 months.<br />
Metric: Percent of female MA enrollees 67 <strong>and</strong> older who suffered a fracture during the<br />
measurement year (denominator), <strong>and</strong> who subsequently had either a bone mineral<br />
density test or were prescribed a drug to treat or prevent osteoporosis in the six months<br />
after the fracture (numerator).<br />
Data Source: HEDIS Data Time Frame: 1/1/2009 - 12/31/2009<br />
Statistical Method: Relative Distribution with Clustering<br />
General Trend: Higher is better<br />
Data Display: Percentage with no decimal point PFFS & MSA Reporting: Voluntary<br />
4 Star Threshold: ≥ 60% All other Orgs Reporting: Required<br />
1 Star: < 23%<br />
Cut Points: 2 Stars: ≥ 23% <strong>and</strong> < 41%<br />
3 Stars: ≥ 41% <strong>and</strong> < 60%<br />
4 Stars: ≥ 60% <strong>and</strong> < 85%<br />
5 Stars: ≥ 85%<br />
Measure: C15 - Diabetes Care – Eye Exam<br />
Label for Stars: Eye exam to check for damage from diabetes<br />
Label for Data: Eye exam to check for damage from diabetes<br />
HEDIS Label: Comprehensive Diabetes Care (CDC) – Eye Exam (Retinal) Performed<br />
Description: Percent of plan members with diabetes who had an eye exam to check for damage from<br />
diabetes during the year<br />
Metric: Percent of diabetic MA enrollees (denominator) who had a retinal or dilated eye exam by<br />
an eye care professional during the measurement year (numerator).<br />
Data Source: HEDIS Data Time Frame: 1/1/2009 - 12/31/2009<br />
Statistical Method: Relative Distribution with Clustering<br />
General Trend: Higher is better<br />
Data Display: Percentage with no decimal point PFFS & MSA Reporting: Voluntary<br />
4 Star Threshold: ≥ 64% All other Orgs Reporting: Required<br />
1 Star: < 45%<br />
Cut Points: 2 Stars: ≥ 45% <strong>and</strong> < 54%<br />
3 Stars: ≥ 54% <strong>and</strong> < 64%<br />
4 Stars: ≥ 64% <strong>and</strong> < 75%<br />
5 Stars: ≥ 75%<br />
(Last Updated 11/04/2010) Page 11 of 26
Measure: C16 - Diabetes Care – Kidney Disease Monitoring<br />
Label for Stars: Kidney function testing for members with diabetes<br />
Label for Data: Kidney function testing for members with diabetes<br />
HEDIS Label: Comprehensive Diabetes Care (CDC) – Medical Attention for Nephropathy<br />
Description: Percent of plan members with diabetes who had a kidney function test during the year<br />
Metric: Percent of diabetic MA enrollees (denominator) who either had a urine microalbumin test<br />
during the measurement year, or who had received medical attention for nephropathy<br />
during the measurement year (numerator).<br />
Data Source: HEDIS Data Time Frame: 1/1/2009 - 12/31/2009<br />
Statistical Method: Relative Distribution with Clustering<br />
General Trend: Higher is better<br />
Data Display: Percentage with no decimal point PFFS & MSA Reporting: Voluntary<br />
4 Star Threshold: ≥ 85% All other Orgs Reporting: Required<br />
1 Star: < 79%<br />
Cut Points: 2 Stars: ≥ 79% <strong>and</strong> < 83%<br />
3 Stars: ≥ 83% <strong>and</strong> < 85%<br />
4 Stars: ≥ 85% <strong>and</strong> < 90%<br />
5 Stars: ≥ 90%<br />
Measure: C17 - Diabetes Care – Blood Sugar Controlled<br />
Label for Stars: <strong>Plan</strong> Members with Diabetes whose blood sugar is under control<br />
Label for Data: <strong>Plan</strong> Members with Diabetes whose blood sugar is under control<br />
HEDIS Label: Comprehensive Diabetes Care (CDC) – HbA1c poor control (
Measure: C18 - Diabetes Care – Cholesterol Controlled<br />
Label for Stars: <strong>Plan</strong> Members with Diabetes whose Cholesterol Is Under Control<br />
Label for Data: <strong>Plan</strong> Members with Diabetes whose Cholesterol Is Under Control<br />
HEDIS Label: Comprehensive Diabetes Care (CDC) – LDL-C control (
Measure: C20 - Rheumatoid Arthritis Management<br />
Label for Stars: Rheumatoid Arthritis Management<br />
Label for Data: Rheumatoid Arthritis Management<br />
HEDIS Label: Disease-Modifying Anti-Rheumatic Drug Therapy for Rheumatoid Arthritis (ART)<br />
Description: Percent of plan members with Rheumatoid Arthritis who got 1 or more prescription(s) for<br />
an anti-rheumatic drug.<br />
Metric: Percent of MA enrollees diagnosed with rheumatoid arthritis during the measurement<br />
year (denominator), <strong>and</strong> who received at least one prescription for a disease modifying<br />
anti-rheumatic drug (DMARD) (numerator).<br />
Data Source: HEDIS Data Time Frame: 1/1/2009 - 12/31/2009<br />
Statistical Method: Relative Distribution with Clustering<br />
General Trend: Higher is better<br />
Data Display: Percentage with no decimal point PFFS & MSA Reporting: Voluntary<br />
4 Star Threshold: ≥ 78% All other Orgs Reporting: Required<br />
1 Star: < 46%<br />
Cut Points: 2 Stars: ≥ 46% <strong>and</strong> < 70%<br />
3 Stars: ≥ 70% <strong>and</strong> < 78%<br />
4 Stars: ≥ 78% <strong>and</strong> < 83%<br />
5 Stars: ≥ 83%<br />
Measure: C21 - Testing to Confirm Chronic Obstructive Pulmonary Disease<br />
Label for Stars: Testing to Confirm Chronic Obstructive Pulmonary Disorder<br />
Label for Data: Testing to Confirm Chronic Obstructive Pulmonary Disorder<br />
HEDIS Label: Use of Spirometry Testing in the Assessment <strong>and</strong> Diagnosis of COPD (SPR)<br />
Description: Percent of senior plan members with active Chronic Obstructive Pulmonary Disease who<br />
got appropriate spirometry testing to confirm the diagnosis.<br />
Metric: Percent of MA enrollees 40 or older with a new diagnosis or newly active Chronic<br />
Obstructive Pulmonary Disease (COPD) during the measurement year (denominator),<br />
who received appropriate spirometry testing to confirm the diagnosis (numerator).<br />
Data Source: HEDIS Data Time Frame: 1/1/2009 - 12/31/2009<br />
Statistical Method: Relative Distribution with Clustering<br />
General Trend: Higher is better<br />
Data Display: Percentage with no decimal point PFFS & MSA Reporting: Voluntary<br />
4 Star Threshold: ≥ 60% All other Orgs Reporting: Required<br />
1 Star: < 20%<br />
Cut Points: 2 Stars: ≥ 20% <strong>and</strong> < 35%<br />
3 Stars: ≥ 35% <strong>and</strong> < 60%<br />
4 Stars: ≥ 60% <strong>and</strong> < 83%<br />
5 Stars: ≥ 83%<br />
(Last Updated 11/04/2010) Page 14 of 26
Measure: C22 - Improving Bladder Control<br />
Label for Stars: Improving Bladder Control<br />
Label for Data: Improving Bladder Control<br />
HEDIS Label: Management of Urinary Incontinence in Older Adults (MUI)<br />
Description: Percent of members with a urine leakage problem who discussed the problem with their<br />
doctor <strong>and</strong> got treatment for it within 6 months.<br />
Metric: Percent of <strong>Medicare</strong> members 65 years of age or older (denominator) who reported<br />
having a urine leakage problem in the past six months <strong>and</strong> who received treatment for<br />
their current urine leakage problem (numerator).<br />
Data Source: HEDIS / HOS Data Time Frame: Apr - Aug 2009<br />
Statistical Method: Relative Distribution with Clustering<br />
General Trend: Higher is better<br />
Data Display: Percentage with no decimal point PFFS & MSA Reporting: Voluntary<br />
4 Star Threshold: ≥ 60% All other Orgs Reporting: Required<br />
1 Star: < 32%<br />
Cut Points: 2 Stars: ≥ 32% <strong>and</strong> < 39%<br />
3 Stars: ≥ 39% <strong>and</strong> < 60%<br />
4 Stars: ≥ 60% <strong>and</strong> < 85%<br />
5 Stars: ≥ 85%<br />
Measure: C23 - Reducing the Risk of Falling<br />
Label for Stars: Reducing the Risk of Falling<br />
Label for Data: Reducing the Risk of Falling<br />
HEDIS Label: Fall Risk Management (FRM)<br />
Description: Percent of members with a problem falling, walking or balancing who discussed it with<br />
their doctor <strong>and</strong> got treatment for it during the year<br />
Metric: Percent of <strong>Medicare</strong> members 65 years of age or older who had a fall or had problems<br />
with balance or walking in the past 12 months (denominator), who were seen by a<br />
practitioner in the past 12 months <strong>and</strong> who received fall risk intervention from their<br />
current practitioner (numerator).<br />
Data Source: HEDIS / HOS Data Time Frame: Apr - Aug 2009<br />
Statistical Method: Relative Distribution with Clustering<br />
General Trend: Higher is better<br />
Data Display: Percentage with no decimal point PFFS & MSA Reporting: Voluntary<br />
4 Star Threshold: ≥ 59% All other Orgs Reporting: Required<br />
1 Star: < 51%<br />
Cut Points: 2 Stars: ≥ 51% <strong>and</strong> < 55%<br />
3 Stars: ≥ 55 <strong>and</strong> < 59<br />
4 Stars: ≥ 59% <strong>and</strong> < 65%<br />
5 Stars: ≥ 65%<br />
(Last Updated 11/04/2010) Page 15 of 26
Domain: 3 - <strong>Ratings</strong> of <strong>Health</strong> <strong>Plan</strong> Responsiveness <strong>and</strong> Care<br />
Measure: C24 - Getting Needed Care<br />
Label for Stars: Ease of Getting Needed Care <strong>and</strong> Seeing Specialists<br />
Label for Data: Ease of Getting Needed Care <strong>and</strong> Seeing Specialists<br />
Description: Percent of best possible score the plan earned on how easy it is to get needed care,<br />
including care from specialists.<br />
Metric: Mean of CAHPS Composite converted to a scale from 0 to 100 that includes the<br />
following questions:<br />
• In the last 6 months, how often was it easy to get appointments with specialists?<br />
• In the last 6 months, how often was it easy to get the care, tests, or treatment you<br />
needed through your health plan?<br />
Data Source: CAHPS Data Time Frame: Feb - June 2010<br />
Statistical Method: Relative Distribution <strong>and</strong><br />
General Trend: Higher is better<br />
Significance Testing<br />
Data Display: Rate with 2 decimal points<br />
PFFS & MSA Reporting: Required<br />
4 Star Threshold: ≥ 85.0912% All other Orgs Reporting: Required<br />
1 Star: A contract is assigned 1 star if the contract’s average case-mix adjusted<br />
Cut Points: CAHPS measure score is ranked below the 15th percentile <strong>and</strong> the<br />
contract’s average CAHPS measure score is statistically significantly lower<br />
than the national average CAHPS measure score.<br />
2 Stars: A contract is assigned 2 stars if it does not meet the 1 star criteria <strong>and</strong><br />
meets at least one of these two criteria: (a) the contract’s average case-mix<br />
adjusted CAHPS measure score is lower than the 30th percentile OR (b) the<br />
contract’s average CAHPS measure score is statistically significantly lower<br />
than the national average CAHPS measure score.<br />
3 Stars: A contract is assigned 3 stars if the contract’s average case-mix adjusted<br />
CAHPS measure score is ranked above the 30th percentile (inclusive) <strong>and</strong><br />
the contract’s average CAHPS measure score is below the cutoff defined for<br />
4 stars.<br />
4 Stars: A contract is assigned 4 stars if it does not meet the 5 star criteria, but the<br />
contract’s average case-mix adjusted CAHPS measure score exceeds a<br />
cutoff defined by the 60th percentile of plan means in 2009 CAHPS reports<br />
for the same measure.<br />
5 Stars: A contract is assigned 5 stars if the contract’s average case-mix adjusted<br />
CAHPS measure score is ranked above the 80th percentile <strong>and</strong> the<br />
contract’s average CAHPS measure score is statistically significantly higher<br />
than the national average CAHPS measure score.<br />
(Last Updated 11/04/2010) Page 16 of 26
Measure: C25 - Doctors who Communicate Well<br />
Label for Stars: Doctors Who Communicate Well<br />
Label for Data: Doctors Who Communicate Well<br />
Description: Percent of best possible score the plan earned on how well doctors communicate.<br />
Metric: Mean of CAHPS Composite converted to a scale from 0 to 100 that includes the<br />
following questions:<br />
• In the last 6 months, how often did your personal doctor listen carefully to you?<br />
• In the last 6 months, how often did your personal doctor explain things in a way that<br />
was easy to underst<strong>and</strong>?<br />
• In the last 6 months, how often did your personal doctor show respect for what you had<br />
to say?<br />
• In the last 6 months, how often did your personal doctor spend enough time with you?<br />
Data Source: CAHPS Data Time Frame: Feb - June 2010<br />
Statistical Method: Relative Distribution <strong>and</strong><br />
General Trend: Higher is better<br />
Significance Testing<br />
Data Display: Rate with 2 decimal points<br />
PFFS & MSA Reporting: Required<br />
4 Star Threshold: ≥ 90.1535% All other Orgs Reporting: Required<br />
1 Star: A contract is assigned 1 star if the contract’s average case-mix adjusted<br />
Cut Points: CAHPS measure score is ranked below the 15th percentile <strong>and</strong> the<br />
contract’s average CAHPS measure score is statistically significantly lower<br />
than the national average CAHPS measure score.<br />
2 Stars: A contract is assigned 2 stars if it does not meet the 1 star criteria <strong>and</strong><br />
meets at least one of these two criteria: (a) the contract’s average case-mix<br />
adjusted CAHPS measure score is lower than the 30th percentile OR (b) the<br />
contract’s average CAHPS measure score is statistically significantly lower<br />
than the national average CAHPS measure score.<br />
3 Stars: A contract is assigned 3 stars if the contract’s average case-mix adjusted<br />
CAHPS measure score is ranked above the 30th percentile (inclusive) <strong>and</strong><br />
the contract’s average CAHPS measure score is below the cutoff defined for<br />
4 stars.<br />
4 Stars: A contract is assigned 4 stars if it does not meet the 5 star criteria, but the<br />
contract’s average case-mix adjusted CAHPS measure score exceeds a<br />
cutoff defined by the 60th percentile of plan means in 2009 CAHPS reports<br />
for the same measure.<br />
5 Stars: A contract is assigned 5 stars if the contract’s average case-mix adjusted<br />
CAHPS measure score is ranked above the 80th percentile <strong>and</strong> the<br />
contract’s average CAHPS measure score is statistically significantly higher<br />
than the national average CAHPS measure score.<br />
(Last Updated 11/04/2010) Page 17 of 26
Measure: C26 - Getting Appointments <strong>and</strong> Care Quickly<br />
Label for Stars: Getting Appointments <strong>and</strong> Care Quickly<br />
Label for Data: Getting Appointments <strong>and</strong> Care Quickly<br />
Description: Percent of best possible score the plan earned on how quickly members get<br />
appointments <strong>and</strong> care.<br />
Metric: Mean of CAHPS Composite converted to a scale from 0 to 100 that includes the<br />
following questions:<br />
• In the last 6 months, when you needed care right away, how often did you get care as<br />
soon as you thought you needed?<br />
• In the last 6 months, not counting the times when you needed health care right away,<br />
how often did you get an appointment for your health care at a doctor's office or clinic as<br />
soon as you thought you needed?<br />
Data Source: CAHPS Data Time Frame: Feb - June 2010<br />
Statistical Method: Relative Distribution <strong>and</strong><br />
General Trend: Higher is better<br />
Significance Testing<br />
Data Display: Rate with 2 decimal points<br />
PFFS & MSA Reporting: Required<br />
4 Star Threshold: ≥ 75.3601% All other Orgs Reporting: Required<br />
1 Star: A contract is assigned 1 star if the contract’s average case-mix adjusted<br />
Cut Points: CAHPS measure score is ranked below the 15th percentile <strong>and</strong> the<br />
contract’s average CAHPS measure score is statistically significantly lower<br />
than the national average CAHPS measure score.<br />
2 Stars: A contract is assigned 2 stars if it does not meet the 1 star criteria <strong>and</strong><br />
meets at least one of these two criteria: (a) the contract’s average case-mix<br />
adjusted CAHPS measure score is lower than the 30th percentile OR (b) the<br />
contract’s average CAHPS measure score is statistically significantly lower<br />
than the national average CAHPS measure score.<br />
3 Stars: A contract is assigned 3 stars if the contract’s average case-mix adjusted<br />
CAHPS measure score is ranked above the 30th percentile (inclusive) <strong>and</strong><br />
the contract’s average CAHPS measure score is below the cutoff defined for<br />
4 stars.<br />
4 Stars: A contract is assigned 4 stars if it does not meet the 5 star criteria, but the<br />
contract’s average case-mix adjusted CAHPS measure score exceeds a<br />
cutoff defined by the 60th percentile of plan means in 2009 CAHPS reports<br />
for the same measure.<br />
5 Stars: A contract is assigned 5 stars if the contract’s average case-mix adjusted<br />
CAHPS measure score is ranked above the 80th percentile <strong>and</strong> the<br />
contract’s average CAHPS measure score is statistically significantly higher<br />
than the national average CAHPS measure score.<br />
(Last Updated 11/04/2010) Page 18 of 26
Measure: C27 - Customer Service<br />
Label for Stars: Customer Service<br />
Label for Data: Customer Service<br />
Description: Percent of best possible score the plan earned on how easy it is to get information <strong>and</strong><br />
help when needed.<br />
Metric: Mean of CAHPS Composite converted to a scale from 0 to 100 that includes the<br />
following questions:<br />
• In the last 6 months, how often did your health plan’s customer service give you the<br />
information or help you needed?<br />
• In the last 6 months, how often did your health plan’s customer service treat you with<br />
courtesy <strong>and</strong> respect?<br />
• In the last 6 months, how often were the forms for your health plan easy to fill out?<br />
Data Source: CAHPS Data Time Frame: Feb - June 2010<br />
Statistical Method: Relative Distribution <strong>and</strong><br />
General Trend: Higher is better<br />
Significance Testing<br />
Data Display: Rate with 2 decimal points<br />
PFFS & MSA Reporting: Required<br />
4 Star Threshold: ≥ 88.4232% All other Orgs Reporting: Required<br />
1 Star: A contract is assigned 1 star if the contract’s average case-mix adjusted<br />
Cut Points: CAHPS measure score is ranked below the 15th percentile <strong>and</strong> the<br />
contract’s average CAHPS measure score is statistically significantly lower<br />
than the national average CAHPS measure score.<br />
2 Stars: A contract is assigned 2 stars if it does not meet the 1 star criteria <strong>and</strong><br />
meets at least one of these two criteria: (a) the contract’s average case-mix<br />
adjusted CAHPS measure score is lower than the 30th percentile OR (b) the<br />
contract’s average CAHPS measure score is statistically significantly lower<br />
than the national average CAHPS measure score.<br />
3 Stars: A contract is assigned 3 stars if the contract’s average case-mix adjusted<br />
CAHPS measure score is ranked above the 30th percentile (inclusive) <strong>and</strong><br />
the contract’s average CAHPS measure score is below the cutoff defined for<br />
4 stars.<br />
4 Stars: A contract is assigned 4 stars if it does not meet the 5 star criteria, but the<br />
contract’s average case-mix adjusted CAHPS measure score exceeds a<br />
cutoff defined by the 60th percentile of plan means in 2009 CAHPS reports<br />
for the same measure.<br />
5 Stars: A contract is assigned 5 stars if the contract’s average case-mix adjusted<br />
CAHPS measure score is ranked above the 80th percentile <strong>and</strong> the<br />
contract’s average CAHPS measure score is statistically significantly higher<br />
than the national average CAHPS measure score.<br />
(Last Updated 11/04/2010) Page 19 of 26
Measure: C28 - Overall Rating of <strong>Health</strong> Care <strong>Quality</strong><br />
Label for Stars: Overall Rating of <strong>Health</strong> Care <strong>Quality</strong><br />
Label for Data: Overall Rating of <strong>Health</strong> Care <strong>Quality</strong><br />
Description: Percent of best possible score the plan earned from plan members who rated the overall<br />
health care received.<br />
Metric: Mean of CAHPS Rating converted to a scale from 0 to 100 for the following question:<br />
• Using any number from 0 to 10, where 0 is the worst health care possible <strong>and</strong> 10 is the<br />
best health care possible, what number would you use to rate all your health care in the<br />
last 6 months?<br />
Data Source: CAHPS Data Time Frame: Feb - June 2010<br />
Statistical Method: Relative Distribution <strong>and</strong><br />
General Trend: Higher is better<br />
Significance Testing<br />
Data Display: Rate with 2 decimal points<br />
PFFS & MSA Reporting: Required<br />
4 Star Threshold: ≥ 85.1088% All other Orgs Reporting: Required<br />
1 Star: A contract is assigned 1 star if the contract’s average case-mix adjusted<br />
Cut Points: CAHPS measure score is ranked below the 15th percentile <strong>and</strong> the<br />
contract’s average CAHPS measure score is statistically significantly lower<br />
than the national average CAHPS measure score.<br />
2 Stars: A contract is assigned 2 stars if it does not meet the 1 star criteria <strong>and</strong><br />
meets at least one of these two criteria: (a) the contract’s average case-mix<br />
adjusted CAHPS measure score is lower than the 30th percentile OR (b) the<br />
contract’s average CAHPS measure score is statistically significantly lower<br />
than the national average CAHPS measure score.<br />
3 Stars: A contract is assigned 3 stars if the contract’s average case-mix adjusted<br />
CAHPS measure score is ranked above the 30th percentile (inclusive) <strong>and</strong><br />
the contract’s average CAHPS measure score is below the cutoff defined for<br />
4 stars.<br />
4 Stars: A contract is assigned 4 stars if it does not meet the 5 star criteria, but the<br />
contract’s average case-mix adjusted CAHPS measure score exceeds a<br />
cutoff defined by the 60th percentile of plan means in 2009 CAHPS reports<br />
for the same measure.<br />
5 Stars: A contract is assigned 5 stars if the contract’s average case-mix adjusted<br />
CAHPS measure score is ranked above the 80th percentile <strong>and</strong> the<br />
contract’s average CAHPS measure score is statistically significantly higher<br />
than the national average CAHPS measure score.<br />
(Last Updated 11/04/2010) Page 20 of 26
Measure: C29 - Overall Rating of <strong>Plan</strong><br />
Label for Stars: Members’ Overall Rating of <strong>Health</strong> <strong>Plan</strong><br />
Label for Data: Members’ Overall Rating of <strong>Health</strong> <strong>Plan</strong><br />
Description: Percent of best possible score the plan earned from plan members who rated the overall<br />
plan.<br />
Metric: Mean of CAHPS Rating converted to a scale from 0 to 100 for the following question:<br />
• Using any number from 0 to 10, where 0 is the worst health plan possible <strong>and</strong> 10 is the<br />
best health plan possible, what number would you use to rate your health plan?<br />
Data Source: CAHPS Data Time Frame: Feb - June 2010<br />
Statistical Method: Relative Distribution <strong>and</strong><br />
General Trend: Higher is better<br />
Significance Testing<br />
Data Display: Rate with 2 decimal points<br />
PFFS & MSA Reporting: Required<br />
4 Star Threshold: ≥ 85.0271% All other Orgs Reporting: Required<br />
1 Star: A contract is assigned 1 star if the contract’s average case-mix adjusted<br />
Cut Points: CAHPS measure score is ranked below the 15th percentile <strong>and</strong> the<br />
contract’s average CAHPS measure score is statistically significantly lower<br />
than the national average CAHPS measure score.<br />
2 Stars: A contract is assigned 2 stars if it does not meet the 1 star criteria <strong>and</strong><br />
meets at least one of these two criteria: (a) the contract’s average case-mix<br />
adjusted CAHPS measure score is lower than the 30th percentile OR (b) the<br />
contract’s average CAHPS measure score is statistically significantly lower<br />
than the national average CAHPS measure score.<br />
3 Stars: A contract is assigned 3 stars if the contract’s average case-mix adjusted<br />
CAHPS measure score is ranked above the 30th percentile (inclusive) <strong>and</strong><br />
the contract’s average CAHPS measure score is below the cutoff defined for<br />
4 stars.<br />
4 Stars: A contract is assigned 4 stars if it does not meet the 5 star criteria, but the<br />
contract’s average case-mix adjusted CAHPS measure score exceeds a<br />
cutoff defined by the 60th percentile of plan means in 2009 CAHPS reports<br />
for the same measure.<br />
5 Stars: A contract is assigned 5 stars if the contract’s average case-mix adjusted<br />
CAHPS measure score is ranked above the 80th percentile <strong>and</strong> the<br />
contract’s average CAHPS measure score is statistically significantly higher<br />
than the national average CAHPS measure score.<br />
(Last Updated 11/04/2010) Page 21 of 26
Domain: 4 - <strong>Health</strong> <strong>Plan</strong> Members' Complaints <strong>and</strong> Appeals<br />
Measure: C30 - Complaints about the <strong>Health</strong> <strong>Plan</strong><br />
Label for Stars: Complaints about the <strong>Health</strong> <strong>Plan</strong><br />
Label for Data: Complaints about the <strong>Health</strong> <strong>Plan</strong> (number of complaints for every 1,000 members)<br />
Description: How many complaints <strong>Medicare</strong> received about the health plan.<br />
Metric: Rate of complaints about the health plan per 1,000 members. For each contract, this<br />
rate is calculated as: [(Total number of all complaints logged into the CTM) / (Average<br />
Contract enrollment)] * 1,000 * 30 / (Number of Days in Period).<br />
• Enrollment numbers used to calculate the complaint rate were based on the average<br />
enrollment for the time period measured for each contract.<br />
• A contract’s failure to follow CMS’ CTM St<strong>and</strong>ard Operating Procedures will not result<br />
in CMS’ adjustment of the data used for these measures.<br />
• Data Exclusions: Some complaints that cannot be clearly attributed to the plan are<br />
excluded. These complaints include the following complaint types: complaints regarding<br />
1-800-MEDICARE, websites, State <strong>Health</strong> Insurance Programs (SHIPs), Social Security<br />
Administration (SSA), or <strong>Medicare</strong> Drug Integrity Contractors (MEDICs); enrollment<br />
reconciliation issues, facilitated enrollment issues; beneficiary loss of LIS<br />
status/eligibility; enrollment exceptions; complaints identified as a CMS issue; or <strong>Part</strong> D<br />
premium overcharge issues.<br />
• Exclusions: Complaint rates are not calculated for plans with enrollment less than 800<br />
beneficiaries.<br />
Data Source: CTM Data Time Frame: 1/1/2010 - 06/30/2010<br />
Statistical Method: Relative Distribution with Clustering<br />
General Trend: Lower is better<br />
Data Display: Rate with 2 decimal points<br />
PFFS & MSA Reporting: Required<br />
4 Star Threshold: Not Predetermined All other Orgs Reporting: Required<br />
1 Star: > 1.51<br />
Cut Points: 2 Stars: > 1.1 <strong>and</strong> ≤ 1.51<br />
3 Stars: > 0.75 <strong>and</strong> ≤ 1.1<br />
4 Stars: > 0.23 <strong>and</strong> ≤ 0.75<br />
5 Stars: ≤ 0.23<br />
Measure: C31 - <strong>Plan</strong> Makes Timely Decisions about Appeals<br />
Label for Stars: <strong>Health</strong> <strong>Plan</strong> Makes Timely Decisions about Appeals<br />
Label for Data: <strong>Health</strong> <strong>Plan</strong> Makes Timely Decisions about Appeals<br />
Description: Percent of plan members who got a timely response when they made a written appeal to<br />
the health plan about a decision to refuse payment or coverage.<br />
Metric: Percent of appeals timely processed by the plan (numerator) out of all the plan’s appeals<br />
cases decided by the IRE (includes only Upheld, Overturned <strong>and</strong> <strong>Part</strong>ially Overturned<br />
cases) (denominator).<br />
Data Source: IRE Maximus Data Time Frame: 1/1/2009 - 12/31/2009<br />
Statistical Method: Relative Distribution with Clustering<br />
General Trend: Higher is better<br />
Data Display: Percentage with no decimal point PFFS & MSA Reporting: Required<br />
4 Star Threshold: ≥ 85% All other Orgs Reporting: Required<br />
1 Star: < 55%<br />
Cut Points: 2 Stars: ≥ 55% <strong>and</strong> < 70%<br />
3 Stars: ≥ 70% <strong>and</strong> < 85%<br />
4 Stars: ≥ 85% <strong>and</strong> < 91%<br />
5 Stars: ≥ 91%<br />
(Last Updated 11/04/2010) Page 22 of 26
Measure: C32 - Reviewing Appeals Decisions<br />
Label for Stars: Fairness of <strong>Health</strong> <strong>Plan</strong>’s Denials to Member Appeals, Based on an Independent<br />
reviewer<br />
Label for Data: Fairness of <strong>Health</strong> <strong>Plan</strong>’s Denials to Member Appeals, Based on an Independent<br />
reviewer<br />
Description: How often an independent reviewer agrees with the plan's decision to deny or say no to<br />
a member’s appeal.<br />
Metric: Percent of appeals cases where a plan’s decision was “upheld” by the IRE (numerator)<br />
out of all the plan’s appeals cases (“upheld”, “overturned” <strong>and</strong> “partially overturned”<br />
cases only) that the IRE reviewed (denominator)<br />
Data Source: IRE Maximus Data Time Frame: 1/1/2009 - 12/31/2009<br />
Statistical Method: Relative Distribution with Clustering<br />
General Trend: Higher is better<br />
Data Display: Percentage with no decimal point PFFS & MSA Reporting: Required<br />
4 Star Threshold: ≥ 87% All other Orgs Reporting: Required<br />
1 Star: < 64%<br />
Cut Points: 2 Stars: ≥ 64% <strong>and</strong> < 74%<br />
3 Stars: ≥ 74% <strong>and</strong> < 87%<br />
4 Stars: ≥ 87% <strong>and</strong> < 92%<br />
5 Stars: ≥ 92%<br />
(Last Updated 11/04/2010) Page 23 of 26
Measure: C33 - Corrective Action <strong>Plan</strong>s<br />
Label for Stars: Beneficiary Access Problems <strong>Medicare</strong> Found During an Audit of the <strong>Health</strong> <strong>Plan</strong> (more<br />
stars are better because they mean fewer serious problems)<br />
Label for Data: Beneficiary Access Problems <strong>Medicare</strong> Found During an Audit of the <strong>Health</strong> <strong>Plan</strong> (on a<br />
scale from 0 to 100; lower numbers are better because they mean fewer serious<br />
problems)<br />
Description: <strong>Medicare</strong> oversees the operations of health plans by auditing. Some plans are selected<br />
at r<strong>and</strong>om for an audit. Other plans are audited because <strong>Medicare</strong> thinks there could be<br />
a problem. Not every plan is audited every year, so “not audited” is neither good nor bad.<br />
<strong>Medicare</strong> gives the plan a rating from 0 to 100 beneficiary access problems found during<br />
an audit. The rating combines how severe the problems were, how many there were,<br />
<strong>and</strong> how much they affect plan members directly.<br />
Metric: 1. This score is based on CMS' audit findings of health <strong>and</strong> drug plans. A health or drug<br />
plan may be audited as part of CMS' routine monitoring <strong>and</strong> oversight activities, or as an<br />
ad-hoc activity due to CMS identifying an issue or concern. St<strong>and</strong>ardized CMS audit<br />
guides are used to review many different areas of a contract’s operations. Only those<br />
elements from CMS' audit guides representing potential harm to beneficiaries either<br />
through financial impact or access to services or medications are included.<br />
• Each element in CMS' audit guides were categorized by the potential harm to<br />
beneficiaries either through financial impact or access to services or medications, or if a<br />
contract did not meet CMS st<strong>and</strong>ards. Each category was then assigned a point value.<br />
The following points were assigned to each category:<br />
i. No beneficiary harm, with no risk of financial impact – 1 point*<br />
ii. No beneficiary harm, with financial impact – 3 points*<br />
iii. Beneficiary harm, with no risk of financial impact - 5 points<br />
iv. Beneficiary harm, with risk of financial impact – 7 points<br />
v. Beneficiary harm, with risk of impact to access to services or medications – 10<br />
points<br />
vi. For each failed ad-hoc audit – additional 10 points<br />
* As of 8/19/10, this category is excluded from this measure’s calculation.<br />
• For contracts audited in the measurement time period, a score was calculated using<br />
the formula: contract score = ((Sum of points for failed elements)/ Sum of points for<br />
audited elements))*100) + (Points from failed ad-hoc audits). The maximum score that<br />
could be received by a contract was 100.<br />
• Contracts that were neither audited in the measurement time period nor had an ad hoc<br />
finding are displayed as, "No data available”. A footnote also states, “No information is<br />
shown because <strong>Medicare</strong> did not audit this plan during the previous year. This is neither<br />
good nor bad, because <strong>Medicare</strong> does not always audit plans every year.”<br />
2. Exclusions: Contracts with 3 or fewer reviewed elements or that were not audited in<br />
the measurement period are not assigned a score.<br />
Data Source: HPMS Audit Modules Data Time Frame: 1/1/2009 - 12/31/2009<br />
Statistical Method: Relative Distribution with Clustering<br />
General Trend: Lower is better<br />
Data Display: Rate with 0 decimal points<br />
PFFS & MSA Reporting: Required<br />
4 Star Threshold: Not Predetermined All other Orgs Reporting: Required<br />
1 Star: > 70<br />
Cut Points: 2 Stars: > 52 <strong>and</strong> ≤ 70<br />
3 Stars: > 33 <strong>and</strong> ≤ 52<br />
4 Stars: > 7 <strong>and</strong> ≤ 33<br />
5 Stars: ≤ 7<br />
(Last Updated 11/04/2010) Page 24 of 26
Domain: 5 - <strong>Health</strong> <strong>Plan</strong> Telephone Customer Service<br />
Measure: C34 - Call Center - Hold Time<br />
Label for Stars: Time on Hold When Customer Calls <strong>Health</strong> <strong>Plan</strong><br />
Label for Data: Time on Hold When Customer Calls <strong>Health</strong> <strong>Plan</strong> (minutes: seconds)<br />
Description: How long members wait on hold when they call the health plan’s customer service<br />
number.<br />
Metric: Hold time - Average number of seconds between IVR or message pickup <strong>and</strong> response<br />
by a CSR.<br />
Data Source: Call Center Data Time Frame: 1/1/2010 - 06/30/2010<br />
Statistical Method: CMS St<strong>and</strong>ard, Relative Distribution<br />
General Trend: Lower is better<br />
<strong>and</strong> Clustering<br />
Data Display: Time<br />
PFFS & MSA Reporting: Required<br />
3 Star Threshold: ≤ 135 Seconds All other Orgs Reporting: Required<br />
1 Star: > 201 seconds<br />
Cut Points: 2 Stars: > 135 <strong>and</strong> ≤ 201 seconds<br />
3 Stars: > 89 <strong>and</strong> ≤ 135 seconds<br />
4 Stars: > 50 <strong>and</strong> ≤ 89 seconds<br />
5 Stars: ≤ 50 seconds<br />
Measure: C35 - Call Center - Information Accuracy<br />
Label for Stars: Accuracy of Information Members Get When They Call the <strong>Health</strong> <strong>Plan</strong><br />
Label for Data: Accuracy of Information Members Get When They Call the <strong>Health</strong> <strong>Plan</strong><br />
Description: Percent of the time members are given correct information by the health plan’s customer<br />
service representative.<br />
Metric: Information accuracy - Percent of the time CSRs answered questions correctly.<br />
Data Source: Call Center Data Time Frame: 1/1/2010 - 06/30/2010<br />
Statistical Method: Relative Distribution with Clustering<br />
General Trend: Higher is better<br />
Data Display: Percentage with no decimal point PFFS & MSA Reporting: Required<br />
4 Star Threshold: Not Predetermined All other Orgs Reporting: Required<br />
1 Star: < 80%<br />
Cut Points: 2 Stars: ≥ 80% <strong>and</strong> < 86%<br />
3 Stars: ≥ 86% <strong>and</strong> < 90%<br />
4 Stars: ≥ 90% <strong>and</strong> < 92%<br />
5 Stars: ≥ 92%<br />
(Last Updated 11/04/2010) Page 25 of 26
Measure: C36 - Call Center - Foreign Language interpreter <strong>and</strong> TTY/TDD availability<br />
Label for Stars: Availability of TTY/TDD Services <strong>and</strong> Foreign Language Interpretation When Members<br />
Call the <strong>Health</strong> <strong>Plan</strong><br />
Label for Data: Availability of TTY/TDD Services <strong>and</strong> Foreign Language Interpretation When Members<br />
Call the <strong>Health</strong> <strong>Plan</strong><br />
Description: Percent of the time that the TTY/TDD services <strong>and</strong> foreign language interpretation were<br />
available when needed by members who called the health plan’s customer service<br />
phone number.<br />
Metric: Foreign Language interpreter <strong>and</strong> TTY/TDD availability - Percent of the time a foreign<br />
language interpreter or TTY/TDD service was available to callers who spoke a foreign<br />
language or were hearing impaired.<br />
Data Source: Call Center Data Time Frame: 1/1/2010 - 06/30/2010<br />
Statistical Method: Relative Distribution with Clustering<br />
General Trend: Higher is better<br />
Data Display: Percentage with no decimal point PFFS & MSA Reporting: Required<br />
4 Star Threshold: Not Predetermined All other Orgs Reporting: Required<br />
1 Star: < 31%<br />
Cut Points: 2 Stars: ≥ 31% <strong>and</strong> < 56%<br />
3 Stars: ≥ 56% <strong>and</strong> < 72%<br />
4 Stars: ≥ 72% <strong>and</strong> < 80%<br />
5 Stars: ≥ 80%<br />
(Last Updated 11/04/2010) Page 26 of 26
Methodology for Calculating Star <strong>Ratings</strong><br />
Attachment A: Methodology<br />
CMS will release <strong>Part</strong>s C <strong>and</strong> D <strong>Plan</strong> <strong>Ratings</strong> for the CY<strong>2011</strong> annual enrollment period this<br />
fall. There are a total of 9 topic areas (domains) comprised of 53 individual measures. MA<br />
only plans are measured on 5 topic areas (36 measures). PDPs are measured on 4 topic<br />
areas (17 measures). MA-PD plans are measured on both sets of topic areas (53<br />
measures).<br />
For each individual measure, CMS assigns a star-rating based on a 5 star scale. CMS also<br />
assigns a star-rating for each of the 9 topic areas <strong>and</strong> an overall summary rating for each<br />
contract.<br />
Calculating Individual Measure Scores:<br />
CMS assigns stars for each measure by applying one of three different methods: relative<br />
distribution <strong>and</strong> clustering; relative distribution <strong>and</strong> significance testing; <strong>and</strong> CMS st<strong>and</strong>ard,<br />
relative distribution, <strong>and</strong> clustering. Each method is described in detail below.<br />
A. Relative Distribution <strong>and</strong> Clustering:<br />
This method is applied to the majority of CMS’ plan ratings for star assignments, ranging<br />
from operational <strong>and</strong> process-based measures, as well as HEDIS <strong>and</strong> other clinical care<br />
measures. The following sequential statistical steps are taken to derive thresholds based<br />
on the relative distribution of the data. The first step is to assign initial thresholds using an<br />
adjusted percentile approach <strong>and</strong> a two-stage clustering analysis method. These methods<br />
jointly produce initial thresholds to account for gaps in the data <strong>and</strong> the relative number of<br />
contracts with an observed star value. The adjusted percentile approach adjusts the initial<br />
percentile breakpoints created by any regular percentile approach to account for gaps in<br />
the data.<br />
Detailed description:<br />
1. By using Euclidean metric (defined in Attachment D), scale the raw measures to<br />
comparable metrics, <strong>and</strong> group them into clusters. Clusters are defined as contracts<br />
with similar Euclidean distances between their data value to the center data value.<br />
Six different clustering scenarios are tested, where the smallest number of clusters<br />
is 10, <strong>and</strong> the largest number of clusters is 35. The results from each of these<br />
clustering scenarios are evaluated for potential star thresholds. The formula for<br />
scaling a contract’s raw measure value (X) for a measure (M) is the following, where<br />
Scale 0.025 <strong>and</strong> Scale 0. 975:<br />
min<br />
max<br />
Scaled measure value =<br />
( X<br />
min<br />
( Scale<br />
max<br />
Scale<br />
min<br />
) *<br />
Scale<br />
min<br />
( M<br />
max<br />
M<br />
min<br />
)<br />
M<br />
)<br />
2. Determine up to five star groupings <strong>and</strong> their corresponding thresholds from the means<br />
of each cluster derived in the Step 1.<br />
In applying these two steps, goodness of fit analysis using an empirical distribution<br />
function test in an iterative process is performed as needed to test the properties of the<br />
1
Attachment A: Methodology<br />
raw measure data distribution in contrast to various types of continuous distributions.<br />
Additional sub-tests are also applied <strong>and</strong> include: Kolmogorov- Smirnov statistic, Cramervon<br />
Mises statistic, <strong>and</strong> Anderson-Darling statistic. See Appendix 1 for definitions of these<br />
tests.<br />
Following these steps, the estimates of thresholds for star assignments derived from the<br />
adjusted percentile <strong>and</strong> clustering analyses are combined to produce final individual<br />
measure star ratings.<br />
B. Relative Distribution <strong>and</strong> Significance Testing:<br />
This method is applied to determine valid star thresholds for CAHPS measures. In order to<br />
account for the reliability of scores produced from the CAHPS survey, the method<br />
combines evaluating the relative percentile distribution with significance testing. For<br />
example, to obtain 5 stars a contract’s CAHPS measure score needs to be ranked above<br />
the 80 th percentile <strong>and</strong> be statistically significantly higher than the national average CAHPS<br />
measure score. A contract is assigned 4 stars if it does not meet the 5 star criteria, but the<br />
contract’s average CAHPS measure score exceeds a cutoff defined by the 60th percentile<br />
of plan means in 2009 CAHPS reports for the same measure. To obtain 1 star, a contract’s<br />
CAHPS measure score needs to be ranked below the 15 th percentile <strong>and</strong> the contract’s<br />
CAHPS measure score is statistically significantly lower than the national average CAHPS<br />
measure score.<br />
C. CMS St<strong>and</strong>ard, Relative Distribution, <strong>and</strong> Clustering:<br />
For measures with a CMS published st<strong>and</strong>ard, the CMS st<strong>and</strong>ard has been incorporated<br />
into star thresholds. Currently, the only measures in which this method applies are the call<br />
center hold time measures. Contracts meeting or exceeding the CMS st<strong>and</strong>ard are<br />
assigned at least 3 stars. To determine the thresholds of the other star ratings (e.g. 1, 2, 4,<br />
<strong>and</strong> 5 stars), the steps outlined above for relative distribution <strong>and</strong> clustering are applied.<br />
Calculating Summary Scores:<br />
Each contract’s summary score is a number in the range of 1.0 to 5.0 that summarizes all<br />
of the individual performance measures. A simple average of the star ratings for the<br />
individual measures for a contract is computed, <strong>and</strong> then adjusted to account for low<br />
variance <strong>and</strong> high performance across the individual measures. This adjustment enables<br />
CMS to reward contracts for consistently obtaining a high rating for individual measures.<br />
Finally, the summary scores are rounded to the nearest half-star scale ranging up to 5.0<br />
stars.<br />
Detailed description of steps:<br />
1. Calculate the mean <strong>and</strong> the variance of the individual performance measure stars at<br />
the contract level.<br />
2. Categorize the variance into three categories of low, medium, <strong>and</strong> high percentile<br />
groupings.<br />
2
Attachment A: Methodology<br />
3. Add adjustments for variability <strong>and</strong> performance to the mean overall score by<br />
contract. Example adjustments made for MA-only measures are as follows:<br />
0.4 (for contract w/low-variability <strong>and</strong> high-mean (mean >= 85th percentile)<br />
0.3 (for contract w/medium-variability <strong>and</strong> high-mean (mean >= 85th percentile)<br />
0.2 (for contract w/low-variability <strong>and</strong> relatively high-mean (mean >= 65th & <<br />
85th percentile)<br />
0.1 (for contract w/medium-variability <strong>and</strong> relatively high-mean (mean >= 65th &<br />
< 85th percentile)<br />
0.0 (for other types of contracts)<br />
4. Develop final summary score using 0.5 as the star scale (create 10 possible overall<br />
scores as:<br />
0.5, 1.0, 1.5, 2.0, 2.5, 3.0, 3.5, 4.0, 4.5, <strong>and</strong> 5.0).<br />
5. Apply rounding to final summary score such that stars that are within the distance<br />
of .25 above or below any half star scale will be rounded to that half star scale.<br />
3
Attachment B: Case-Mix Adjusters<br />
CAHPS Case-Mix Adjustment<br />
The CAHPS measures are case-mix adjusted to take into account the mix of enrollees. It<br />
includes dual eligibility <strong>and</strong> education among other variables. The table below includes the<br />
case-mix variables <strong>and</strong> shows the case-mix coefficients for each of the CAHPS measures<br />
included in the <strong>Medicare</strong> <strong>Plan</strong> Finder tool. The coefficients indicate how much higher or<br />
lower people with a given characteristic tend to respond compared to others with the<br />
baseline value for that characteristic, on the 0-100 scale used in consumer reports. For<br />
example, for the measure "rating of care", the coefficient for "age 80-84" is +1.00,<br />
indicating that respondents in that age range tends to score their plans 1.00 point higher<br />
than otherwise similar people in the 70-74 age range, the baseline or reference<br />
category. Similarly dual eligibles tend to respond -0.46 points lower on this item than<br />
otherwise similar non-duals. Contracts with more-than-average concentrations of<br />
respondents who are in the 80-84 age range will be adjusted downwards to compensate<br />
for the positive response tendency of their respondents. Similarly, contracts with aboveaverage<br />
concentrations of respondents who are dual eligibles will be adjusted upwards to<br />
compensate for their respondents negative response tendency. The case-mix patterns are<br />
not always consistent across measures.<br />
The composites consist of multiple items, each of which is adjusted separately before<br />
combining the adjusted scores into a composite score. In the table we report the average<br />
of the coefficients for these several items, for each of the categories (rows) of the table, as<br />
a summary of the adjustment for the composite.<br />
<strong>Health</strong> <strong>Plan</strong> CAHPS measures<br />
Rating of<br />
<strong>Plan</strong><br />
Rating of<br />
Care<br />
Getting Care<br />
Quickly<br />
Composite<br />
Getting<br />
Needed Care<br />
Composite<br />
Doctors Who<br />
Communicate<br />
Well<br />
Composite<br />
<strong>Health</strong> <strong>Plan</strong><br />
Customer<br />
Service<br />
Composite<br />
age: 64 <strong>and</strong> younger -2.33 -1.72 -1.99 -2.34 0.22 -1.44<br />
age: 65-69 -0.89 -0.70 -0.02 -0.47 0.13 0.17<br />
age: 70-74(reference) 0.00 0.00 0.00 0.00 0.00 0.00<br />
age: 75-79 1.19 0.14 0.00 0.39 -0.39 1.30<br />
age: 80-84 2.32 1.00 0.21 0.82 -0.34 1.34<br />
age: 85 <strong>and</strong> older 2.48 0.70 0.46 0.08 -0.89 1.10<br />
less than an 8th grade education 1.07 -0.75 -1.94 -0.26 -0.48 -1.37<br />
some high school 1.05 0.06 -0.97 0.40 0.23 -0.02<br />
high school graduate(reference) 0.00 0.00 0.00 0.00 0.00 0.00<br />
some college -1.79 -1.09 -0.40 -1.57 -0.71 -1.79<br />
college graduate -3.02 -1.27 -0.32 -2.61 -0.86 -2.39<br />
more than a bachelor's degree -3.44 -2.01 -0.32 -3.12 -0.87 -3.29<br />
general health rating_excellent 4.07 4.20 3.13 3.44 2.52 1.95<br />
general health rating_very good 2.03 2.20 1.82 1.59 1.57 1.32<br />
general health rating_good(reference) 0.00 0.00 0.00 0.00 0.00 0.00<br />
general health rating_fair -1.69 -2.44 -1.32 -1.87 -1.29 -1.11<br />
general health rating_poor -3.60 -3.98 -1.41 -3.11 -2.63 -2.69<br />
4
Attachment B: Case-Mix Adjusters<br />
Rating of<br />
<strong>Plan</strong><br />
Rating of<br />
Care<br />
Getting Care<br />
Quickly<br />
Composite<br />
Getting<br />
Needed Care<br />
Composite<br />
Doctors Who<br />
Communicate<br />
Well<br />
Composite<br />
<strong>Health</strong> <strong>Plan</strong><br />
Customer<br />
Service<br />
Composite<br />
mental health rating_excellent 3.41 4.69 3.70 4.81 4.33 2.33<br />
mental health rating_very good 1.25 2.02 1.35 2.07 1.61 1.07<br />
mental health rating_good(reference) 0.00 0.00 0.00 0.00 0.00 0.00<br />
mental health rating_fair -1.47 -1.67 -0.94 -1.71 -1.65 -1.18<br />
mental health rating_poor -3.35 -2.85 -1.39 -2.49 -1.39 -1.80<br />
proxy_helped -1.80 -2.08 -1.76 -1.16 -0.34 -1.34<br />
proxy_answered -1.94 -1.37 0.00 -0.47 -0.51 -1.48<br />
Medicaid dual eligible 2.97 -0.46 -0.61 -0.91 -0.23 0.55<br />
Low Income Subsidy(LIS) 0.75 -0.50 -1.21 -1.54 -0.28 -0.98<br />
Prescription Drug CAHPS Measures<br />
Rate PD plan<br />
Getting needed<br />
prescription drugs<br />
Getting information from PD<br />
plan about prescription drugs<br />
age: 64 <strong>and</strong> younger -3.26 -2.66 -1.35<br />
age: 65-69 -1.05 -0.36 0.65<br />
age: 70-74(reference) 0.00 0.00 0.00<br />
age: 75-79 1.62 0.16 0.06<br />
age: 80-84 3.35 0.44 0.46<br />
age: 85 <strong>and</strong> older 4.12 0.07 0.58<br />
less than an 8th grade education 0.94 -2.35 -5.18<br />
some high school 1.21 -0.80 -2.49<br />
high school graduate(reference) 0.00 0.00 0.00<br />
some college -2.16 -1.01 -0.81<br />
college graduate -2.94 -1.25 -0.49<br />
more than a bachelor's degree -3.62 -2.20 -1.32<br />
general health rating_excellent 4.50 1.08 4.18<br />
general health rating_very good 2.12 1.15 2.66<br />
general health rating_good(reference) 0.00 0.00 0.00<br />
general health rating_fair -1.58 -1.23 -1.39<br />
general health rating_poor -3.01 -2.75 -4.24<br />
mental health rating_excellent 2.84 2.97 4.02<br />
mental health rating_very good 1.16 1.52 2.04<br />
mental health rating_good(reference) 0.00 0.00 0.00<br />
mental health rating_fair -1.21 -1.40 -1.99<br />
mental health rating_poor -3.50 -2.53 -1.77<br />
proxy_helped -3.29 0.40 1.35<br />
proxy_answered -2.87 1.55 1.75<br />
Medicaid dual eligible 6.33 0.39 0.18<br />
Low Income Subsidy(LIS) 5.31 -0.02 -2.04<br />
5
Attachment C: National Averages for Individual Measures<br />
Measure<br />
ID<br />
Measure Name<br />
National<br />
Average<br />
C01 Breast Cancer Screening 68%<br />
C02 Colorectal Cancer Screening 51%<br />
C03 Cholesterol Screening for Patients with Heart Disease 88%<br />
C04 Cholesterol Screening for Patients with Diabetes 87%<br />
C05 Glaucoma Testing 63%<br />
C06 Monitoring of Patients Taking Long-term Medications 89%<br />
C07 Annual Flu Vaccine 65%<br />
C08 Pneumonia Vaccine 65.64%<br />
C09 Improving or Maintaining Physical <strong>Health</strong> 66.74%<br />
C10 Improving or Maintaining Mental <strong>Health</strong> 77%<br />
C11 Osteoporosis Testing 69%<br />
C12 Monitoring Physical Activity 47%<br />
C13 At Least One Primary Care Doctor Visit in the Last Year 96%<br />
C14 Osteoporosis Management 20%<br />
C15 Eye exam to check for damage from diabetes 62%<br />
C16 Kidney function testing for members with diabetes 88%<br />
C17 <strong>Plan</strong> Members with Diabetes whose blood sugar is under control 68%<br />
C18 <strong>Plan</strong> Members with Diabetes whose Cholesterol Is Under Control 48%<br />
C19 Controlling Blood Pressure 59%<br />
C20 Rheumatoid Arthritis Management 73%<br />
C21 Testing to Confirm Chronic Obstructive Pulmonary Disorder 28%<br />
C22 Improving Bladder Control 36%<br />
C23 Reducing the Risk of Falling 57%<br />
C24 Ease of Getting Needed Care <strong>and</strong> Seeing Specialists 84.13%<br />
C25 Doctors Who Communicate Well 89.36%<br />
C26 Getting Appointments <strong>and</strong> Care Quickly 73.90%<br />
C27 Customer Service 87.48%<br />
C28 Overall Rating of <strong>Health</strong> Care <strong>Quality</strong> 84.13%<br />
C29 Overall Rating of <strong>Plan</strong> 82.79%<br />
C30 Complaints about the <strong>Health</strong> <strong>Plan</strong> (number of complaints for every 1,000 members) 0.63<br />
C31 <strong>Health</strong> <strong>Plan</strong> Makes Timely Decisions about Appeals 87%<br />
C32 Fairness of <strong>Health</strong> <strong>Plan</strong>’s Denials to Member Appeals, Based on an Independent reviewer 75%<br />
C33 Beneficiary Access Problems <strong>Medicare</strong> Found During an Audit of the <strong>Health</strong> <strong>Plan</strong> 40<br />
C34 Time on Hold When Customer Calls <strong>Health</strong> <strong>Plan</strong> (minutes : seconds) 0:53<br />
C35 Accuracy of Information Members Get When They Call the <strong>Health</strong> <strong>Plan</strong> 89%<br />
C36 Availability of TTY/TDD Services <strong>and</strong> Foreign Language Interpretation When Members Call the<br />
<strong>Health</strong> <strong>Plan</strong><br />
69%<br />
6
Attachment D: Glossary<br />
Glossary of Statistical Terms<br />
Euclidean metric is the ordinary distance between two points that one would measure<br />
with a ruler.<br />
Kolmogorov-Smirnov test (K–S test) uses a non-parametric technique <strong>and</strong> determines if<br />
two datasets are significantly different. It compares a sample with a reference probability<br />
distribution (one-sample K–S test), or compares two samples (two-sample K–S test).<br />
Cramér-von-Mises criteria is used to judge the goodness of fit of a probability distribution,<br />
compared to a given empirical distribution function or to compare two empirical<br />
distributions.<br />
Anderson–Darling test compares the similarity of an observed cumulative distribution<br />
function to an expected cumulative distribution function.<br />
7


