MDO4000 Series Mixed Domain Oscilloscopes Datasheet - Tektronix
MDO4000 Series Mixed Domain Oscilloscopes Datasheet - Tektronix
MDO4000 Series Mixed Domain Oscilloscopes Datasheet - Tektronix

You also want an ePaper? Increase the reach of your titles
YUMPU automatically turns print PDFs into web optimized ePapers that Google loves.
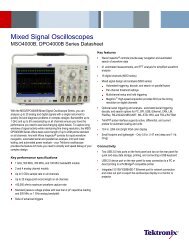
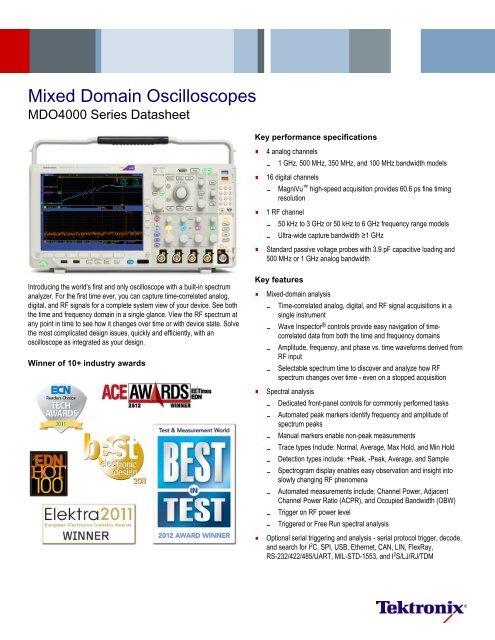
<strong>Mixed</strong> <strong>Domain</strong> <strong>Oscilloscopes</strong><br />
<strong>MDO4000</strong> <strong>Series</strong> <strong>Datasheet</strong><br />
Key performance specifications<br />
4 analog channels<br />
1 GHz, 500 MHz, 350 MHz, and 100 MHz bandwidth models<br />
16 digital channels<br />
MagniVu high-speed acquisition provides 60.6 ps fine timing<br />
resolution<br />
1 RF channel<br />
50 kHz to 3 GHz or 50 kHz to 6 GHz frequency range models<br />
Ultra-wide capture bandwidth ≥1 GHz<br />
Standard passive voltage probes with 3.9 pF capacitive loading and<br />
500 MHz or 1 GHz analog bandwidth<br />
Introducing the world's first and only oscilloscope with a built-in spectrum<br />
analyzer. For the first time ever, you can capture time-correlated analog,<br />
digital, and RF signals for a complete system view of your device. See both<br />
the time and frequency domain in a single glance. View the RF spectrum at<br />
any point in time to see how it changes over time or with device state. Solve<br />
the most complicated design issues, quickly and efficiently, with an<br />
oscilloscope as integrated as your design.<br />
Winner of 10+ industry awards<br />
Key features<br />
<strong>Mixed</strong>-domain analysis<br />
Time-correlated analog, digital, and RF signal acquisitions in a<br />
single instrument<br />
Wave Inspector ® controls provide easy navigation of timecorrelated<br />
data from both the time and frequency domains<br />
Amplitude, frequency, and phase vs. time waveforms derived from<br />
RF input<br />
Selectable spectrum time to discover and analyze how RF<br />
spectrum changes over time - even on a stopped acquisition<br />
Spectral analysis<br />
Dedicated front-panel controls for commonly performed tasks<br />
Automated peak markers identify frequency and amplitude of<br />
spectrum peaks<br />
Manual markers enable non-peak measurements<br />
Trace types Include: Normal, Average, Max Hold, and Min Hold<br />
Detection types include: +Peak, -Peak, Average, and Sample<br />
Spectrogram display enables easy observation and insight into<br />
slowly changing RF phenomena<br />
Automated measurements include: Channel Power, Adjacent<br />
Channel Power Ratio (ACPR), and Occupied Bandwidth (OBW)<br />
Trigger on RF power level<br />
Triggered or Free Run spectral analysis<br />
Optional serial triggering and analysis - serial protocol trigger, decode,<br />
and search for I 2 C, SPI, USB, Ethernet, CAN, LIN, FlexRay,<br />
RS-232/422/485/UART, MIL-STD-1553, and I 2 S/LJ/RJ/TDM
<strong>Datasheet</strong><br />
10.4 in. (264 mm) bright XGA color display<br />
Small footprint and lightweight - Only 5.8 in. (147 mm) deep and 11 lb.<br />
(5 kg)<br />
Connectivity<br />
Two USB 2.0 host ports on the front panel and two on the rear panel for<br />
quick and easy data storage, printing, and connecting a USB keyboard<br />
USB 2.0 device port on the rear panel for easy connection to a PC or<br />
direct printing to a PictBridge ® -compatible printer<br />
Integrated 10/100/1000BASE-T Ethernet port for network connection<br />
and video out port to export the oscilloscope display to a monitor or<br />
projector<br />
Optional application support<br />
Advanced RF triggering<br />
Power analysis<br />
Limit and mask testing<br />
HDTV and custom video analysis<br />
Introducing the <strong>Mixed</strong> <strong>Domain</strong> Oscilloscope<br />
Based on the industry-standard MSO4000B Oscilloscope <strong>Series</strong>, you can<br />
now use your tool of choice, the oscilloscope, to look at the frequency<br />
domain rather than having to find and re-learn a spectrum analyzer.<br />
However, the power of the <strong>MDO4000</strong> <strong>Series</strong> goes well beyond simply<br />
observing the frequency domain as you would on a spectrum analyzer. The<br />
real power is in its ability to correlate events in the frequency domain with<br />
the time domain phenomena that caused them.<br />
When both the RF channel and any analog or digital channels are on, the<br />
oscilloscope display is split into two views. The upper half of the display is a<br />
traditional oscilloscope view of the Time <strong>Domain</strong>. The lower half of the<br />
display is a Frequency <strong>Domain</strong> view of the RF input. Note that the<br />
Frequency <strong>Domain</strong> view is not simply an FFT of the analog or digital<br />
channels in the instrument, but is the spectrum acquired from the RF input.<br />
Another key difference is that with traditional oscilloscope FFTs, you can<br />
typically either get the desired view of the FFT display, or the desired view<br />
of your other time domain signals of interest, but never both at the same<br />
time. This is because traditional oscilloscopes only have a single acquisition<br />
system with a single set of user settings such as record length, sample rate,<br />
and time per division that drive all data views. But with the <strong>MDO4000</strong><br />
<strong>Series</strong>, the RF input has its own acquisition system that is independent, but<br />
time correlated, to the analog and digital channel acquisition systems. This<br />
allows each domain to be configured optimally, providing a complete time<br />
correlated system view of all analog, digital, and RF signals of interest.<br />
The spectrum shown in the Frequency <strong>Domain</strong> view is taken from the<br />
period of time indicated by the short orange bar in the time domain view –<br />
known as the Spectrum Time. With the <strong>MDO4000</strong> <strong>Series</strong>, Spectrum Time<br />
can be moved through the acquisition to investigate how the RF spectrum<br />
changes over time. And this can be done while the oscilloscope is live and<br />
running or on a stopped acquisition.<br />
The upper half of the <strong>MDO4000</strong> <strong>Series</strong> display shows the Time <strong>Domain</strong> view of the<br />
analog and digital channels, while the lower half shows the Frequency <strong>Domain</strong> view of<br />
the RF channel. The orange bar - Spectrum Time - shows the period of time used to<br />
calculate the RF spectrum.<br />
Figures 1 through 4 show a simple everyday application – tuning of a PLL.<br />
This application illustrates the powerful connection between the time<br />
domain and the frequency domain that the <strong>MDO4000</strong> <strong>Series</strong> provides. With<br />
its wide capture bandwidth and ability to move Spectrum Time throughout<br />
the acquisition, this single capture includes the same spectral content as<br />
approximately 1,500 unique test setups and acquisitions on a traditional<br />
spectrum analyzer. For the first time ever, correlating events, observing<br />
interactions, or measuring timing latencies between the two domains is<br />
exceptionally easy, giving you quick insight to your design’s operation.<br />
Figure 1 - Time and Frequency <strong>Domain</strong> view showing the turn-on of a PLL. Channel 1<br />
(yellow) is probing a control signal that enables the VCO. Channel 2 (cyan) is probing the<br />
VCO tune voltage. The SPI bus which is programming the PLL with the desired<br />
frequency is probed with three digital channels and automatically decoded. Notice<br />
Spectrum Time is placed after the VCO was enabled and coincident with the command<br />
on the SPI bus telling the PLL the desired frequency.<br />
2 www.tektronix.com
<strong>Mixed</strong> <strong>Domain</strong> <strong>Oscilloscopes</strong> — <strong>MDO4000</strong> <strong>Series</strong><br />
Figure 2 - Spectrum Time is moved about 60 μs to the right. At this point, the spectrum<br />
shows that the PLL is in the process of tuning to the correct frequency (2.400 GHz). It<br />
has made it up to 2.3168 GHz.<br />
Figure 4 - The PLL eventually settles on the correct 2.400 GHz frequency about 340 μs<br />
after the VCO was enabled.<br />
Visualizing changes in your RF signal<br />
The time domain graticule on the <strong>MDO4000</strong> <strong>Series</strong> display provides support<br />
for three RF time domain traces that are derived from the underlying I and Q<br />
data of the RF input including:<br />
Amplitude - The instantaneous amplitude of the RF input vs. time<br />
Frequency - The instantaneous frequency of the RF input, relative to<br />
the center frequency vs. time<br />
Phase - The instantaneous phase of the RF input, relative to the center<br />
frequency vs. time<br />
Each of these traces may be turned on and off independently, and all three<br />
may be displayed simultaneously. RF time domain traces make it easy to<br />
understand what's happening with a time-varying RF signal.<br />
Figure 3 - Spectrum Time is moved another 120 μs to the right. At this point the spectrum<br />
shows that the PLL has actually overshot the correct frequency and gone all the way to<br />
2.4164 GHz.<br />
www.tektronix.com 3
<strong>Datasheet</strong><br />
Fast and accurate spectral analysis<br />
When using the RF input by itself, the <strong>MDO4000</strong> <strong>Series</strong> display becomes a<br />
full-screen Frequency <strong>Domain</strong> view.<br />
Key spectral parameters such as Center Frequency, Span, Reference<br />
Level, and Resolution Bandwidth are all adjusted quickly and easily using<br />
the dedicated front-panel menus and keypad.<br />
The orange waveform in the Time <strong>Domain</strong> view is the frequency vs. time trace derived<br />
from the RF input signal. Notice that Spectrum Time is positioned during a transition from<br />
the highest frequency to the lowest frequency, so the energy is spread across a number<br />
of frequencies. With the frequency vs. time trace, you can easily see the different<br />
frequency hops, simplifying characterization of how the device switches between<br />
frequencies.<br />
Advanced triggering with RF, analog, and<br />
digital channels<br />
In order to deal with the time-varying nature of modern RF applications, the<br />
<strong>MDO4000</strong> <strong>Series</strong> provides a triggered acquisition system that is fully<br />
integrated with the RF, analog, and digital channels. This means that a<br />
single trigger event coordinates acquisition across all channels, allowing<br />
you to capture a spectrum at the precise point in time where an interesting<br />
time domain event is occurring. A comprehensive set of time domain<br />
triggers are available, including Edge, Sequence, Pulse Width, Timeout,<br />
Runt, Logic, Setup/Hold Violation, Rise/Fall Time, Video, and a variety of<br />
parallel and serial bus packet triggers. In addition, you can trigger on the<br />
power level of the RF input. For example, you can trigger on your RF<br />
transmitter turning on.<br />
The optional MDO4TRIG application module provides advanced RF<br />
triggering. This module enables the RF input power level to be used as a<br />
source for Sequence, Pulse Width, Timeout, Runt, and Logic trigger types.<br />
For example, you can trigger on a RF pulse of a specific length or use the<br />
RF channel as an input to a logic trigger, enabling the oscilloscope to trigger<br />
only when the RF is on while other signals are active.<br />
<strong>MDO4000</strong> frequency domain display.<br />
Key spectral parameters are adjusted quickly with the dedicated front-panel menus and<br />
keypad.<br />
4 www.tektronix.com
<strong>Mixed</strong> <strong>Domain</strong> <strong>Oscilloscopes</strong> — <strong>MDO4000</strong> <strong>Series</strong><br />
Intelligent, efficient markers<br />
In a traditional spectrum analyzer, it can be a very tedious task to turn on<br />
and place enough markers to identify all your peaks of interest. The<br />
<strong>MDO4000</strong> <strong>Series</strong> makes this process far more efficient by automatically<br />
placing markers on peaks that indicate both the frequency and the<br />
amplitude of each peak. You can adjust the criteria that the oscilloscope<br />
uses to automatically find the peaks.<br />
The highest amplitude peak is referred to as the reference marker and is<br />
shown in red. Marker readouts can be switched between Absolute and<br />
Delta readouts. When Delta is selected, marker readouts show each peak's<br />
delta frequency and delta amplitude from the reference marker.<br />
Two manual markers are also available for measuring non-peak portions of<br />
the spectrum. When enabled, the reference marker is attached to one of the<br />
manual markers, enabling delta measurements from anywhere in the<br />
spectrum. In addition to frequency and amplitude, manual marker readouts<br />
also include noise density and phase noise readouts depending on whether<br />
Absolute or Delta readouts are selected. A "Reference Marker to Center"<br />
function instantly moves the frequency indicated by the reference marker to<br />
center frequency.<br />
stopped, you can scroll back through the spectrogram to look at any<br />
individual spectrum slice.<br />
Spectrogram display illustrates slowly moving RF phenomena. As shown here, a signal<br />
that has multiple peaks is being monitored. As the peaks change in both frequency and<br />
amplitude over time, the changes are easily seen in the Spectrogram display.<br />
Triggered versus Free Run operation<br />
When both the time and frequency domains are displayed, the spectrum<br />
shown is always triggered by the system trigger event and is time correlated<br />
with the active time-domain traces. However, when only the frequency<br />
domain is displayed, the RF input can be set to Free Run. This is useful<br />
when the frequency domain data is continuous and unrelated to events<br />
occurring in the time domain.<br />
Automated peak markers identify critical information at a glance. As shown here, the five<br />
highest amplitude peaks that meet the threshold and excursion criteria are automatically<br />
marked along with the peak's frequency and amplitude.<br />
Spectrogram<br />
The <strong>MDO4000</strong> <strong>Series</strong> includes a spectrogram display which is ideal for<br />
monitoring slowly changing RF phenomena. The x-axis represents<br />
frequency, just like a typical spectrum display. However, the y-axis<br />
represents time, and color is used to indicate amplitude.<br />
Spectrogram slices are generated by taking each spectrum and "flipping it<br />
up on its edge" so that it's one pixel row tall, and then assigning colors to<br />
each pixel based on the amplitude at that frequency. Cold colors (blue,<br />
green) are low amplitude and hotter colors (yellow, red) are higher<br />
amplitude. Each new acquisition adds another slice at the bottom of the<br />
spectrogram and the history moves up one row. When acquisitions are<br />
Ultra-wide capture bandwidth<br />
Today's wireless communications vary significantly with time, using<br />
sophisticated digital modulation schemes and, often, transmission<br />
techniques that involve bursting the output. These modulation schemes can<br />
have very wide bandwidth as well. Traditional swept or stepped spectrum<br />
analyzers are ill equipped to view these types of signals as they are only<br />
able to look at a small portion of the spectrum at any one time.<br />
The amount of spectrum acquired in one acquisition is called the capture<br />
bandwidth. Traditional spectrum analyzers sweep or step the capture<br />
bandwidth through the desired span to build the requested image. As a<br />
result, while the spectrum analyzer is acquiring one portion of the spectrum,<br />
the event you care about may be happening in another portion of the<br />
spectrum. Most spectrum analyzers on the market today have 10 MHz<br />
capture bandwidths, sometimes with expensive options to extend that to 20,<br />
40, or even 140 MHz in some cases.<br />
In order to address the bandwidth requirements of modern RF, the<br />
<strong>MDO4000</strong> <strong>Series</strong> provides ≥1 GHz of capture bandwidth. At span settings<br />
of 1 GHz and below, there is no requirement to sweep the display. The<br />
spectrum is generated from a single acquisition, thus guaranteeing you'll<br />
see the events you're looking for in the frequency domain.<br />
www.tektronix.com 5
<strong>Datasheet</strong><br />
RF measurements<br />
The <strong>MDO4000</strong> <strong>Series</strong> includes three automated RF measurements -<br />
Channel Power, Adjacent Channel Power Ratio, and Occupied Bandwidth.<br />
When one of these RF measurements is activated, the oscilloscope<br />
automatically turns on the Average spectrum trace and sets the detection<br />
method to Average for optimal measurement results.<br />
Spectral display of a bursted communication both into a device through Zigbee at 900<br />
MHz and out of the device through Bluetooth at 2.4 GHz, captured with a single<br />
acquisition.<br />
Spectrum traces<br />
The <strong>MDO4000</strong> <strong>Series</strong> offers four different traces or views of the RF input<br />
including Normal, Average, Max Hold, and Min Hold. You can set the<br />
detection method used for each trace type independently or you can leave<br />
the oscilloscope in the default Auto mode that sets the detection type<br />
optimally for the current configuration. Detection types include +Peak, -<br />
Peak, Average, and Sample.<br />
Automated Channel Power measurement<br />
Advanced RF measurements<br />
The <strong>MDO4000</strong> can save the baseband I and Q data from RF acquisitions to<br />
a .TIQ file. These files can then be imported into <strong>Tektronix</strong>' SignalVu-PC<br />
and RSAVu analysis packages for further modulation analysis on many<br />
wireless standards.<br />
RF probing<br />
Signal input methods on spectrum analyzers are typically limited to cabled<br />
connections or antennas. But with the optional TPA-N-VPI adapter, any<br />
active, 50 Ω TekVPI probe can be used with the RF input on the <strong>MDO4000</strong><br />
<strong>Series</strong>. This enables additional flexibility when hunting for noise sources<br />
and enables easier spectral analysis by using true signal browsing on an RF<br />
input.<br />
In addition, an optional preamplifier accessory assists in the investigation of<br />
lower-amplitude signals. The TPA-N-PRE preamplifier provides 12 dB<br />
nominal gain across the 9 kHz - 6 GHz frequency range.<br />
Normal, Average, Max Hold, and Min Hold spectrum traces<br />
6 www.tektronix.com
<strong>Mixed</strong> <strong>Domain</strong> <strong>Oscilloscopes</strong> — <strong>MDO4000</strong> <strong>Series</strong><br />
Built on the award-winning MSO4000B <strong>Series</strong><br />
of <strong>Mixed</strong> Signal <strong>Oscilloscopes</strong><br />
The <strong>MDO4000</strong> <strong>Series</strong> provides you with the same comprehensive set of<br />
features available in the MSO4000B <strong>Mixed</strong> Signal Oscilloscope <strong>Series</strong>. This<br />
robust set of tools will help you speed through every stage of debugging<br />
your design - from quickly discovering an anomaly and capturing it, to<br />
searching your waveform record for the event and analyzing its<br />
characteristics and your device's behavior.<br />
The optional TPA-N-VPI adapter enables any active, 50 Ω TekVPI probe to be<br />
connected to the RF input.<br />
Discover<br />
To debug a design problem, first you must know it exists. Every design<br />
engineer spends time looking for problems in their design, a timeconsuming<br />
and frustrating task without the right debug tools.<br />
The industry’s most complete visualization of signals provides fast insight<br />
into the real operation of your device. A fast waveform capture rate –<br />
greater than 50,000 waveforms per second – enables you to see glitches<br />
and other infrequent transients within seconds, revealing the true nature of<br />
device faults. A digital phosphor display with intensity grading shows the<br />
history of a signal’s activity by intensifying areas of the signal that occur<br />
more frequently, providing a visual display of just how often anomalies<br />
occur.<br />
The TPA-N-PRE preamplifier provides 12 dB nominal gain across the 9 kHz - 6 GHz<br />
frequency range.<br />
Discover ‒ Fast waveform capture rate - over 50,000 wfm/s - maximizes the probability<br />
of capturing elusive glitches and other infrequent events.<br />
Capture<br />
Discovering a device fault is only the first step. Next, you must capture the<br />
event of interest to identify root cause.<br />
Accurately capturing any signal of interest begins with proper probing. Lowcapacitance<br />
probes are included with the oscilloscope, one for each analog<br />
channel. These industry-first high-impedance passive voltage probes have<br />
less than 4 pF of capacitive loading to minimize the affect of the probe on<br />
your circuit's operation, offering the performance of an active probe with the<br />
flexibility of a passive probe.<br />
A complete set of triggers - including runt, timeout, logic, pulse width/glitch,<br />
setup/hold violation, serial packet, and parallel data - help you quickly find<br />
www.tektronix.com 7
<strong>Datasheet</strong><br />
your event. With up to a 20M point record length, you can capture many<br />
events of interest, even thousands of serial packets, in a single acquisition<br />
for further analysis while maintaining high resolution to zoom in on fine<br />
signal details.<br />
From triggering on specific packet content to automatic decode in multiple<br />
data formats, the oscilloscope provides integrated support for the industry's<br />
broadest range of serial buses - I 2 C, SPI, USB, Ethernet, CAN, LIN,<br />
FlexRay, RS-232/422/485/UART, MIL-STD-1553, and I 2 S/LJ/RJ/TDM. The<br />
ability to decode up to four serial and/or parallel buses simultaneously<br />
means you gain insight into system-level problems quickly.<br />
To further help troubleshoot system-level interactions in complex embedded<br />
systems, the oscilloscope offers 16 digital channels in addition to its analog<br />
channels. Since the digital channels are fully integrated into the<br />
oscilloscope, you can trigger across all input channels, automatically time<br />
correlating all analog, digital, serial, and RF signals. The MagniVu highspeed<br />
acquisition on these channels enables you to acquire fine signal<br />
detail (up to 60.6 ps resolution) around the trigger point for precision timing<br />
measurements. MagniVu is essential for making accurate timing<br />
measurements for setup and hold, clock delay, signal skew, and glitch<br />
characterization.<br />
Along the way it will automatically mark every occurrence of your defined<br />
event so you can quickly move between events.<br />
Search ‒ RS-232 decode showing results from a Wave Inspector search for data value<br />
"n". Wave Inspector controls provide unprecedented efficiency in viewing and navigating<br />
waveform data.<br />
Capture - Triggering on a specific transmit data packet going across a SPI bus. A<br />
complete set of triggers, including triggers for specific serial packet content, ensures you<br />
quickly capture your event of interest.<br />
Analyze<br />
Verifying that your prototype’s performance matches simulations and meets<br />
the project’s design goals requires analyzing its behavior. Tasks can range<br />
from simple checks of rise times and pulse widths to sophisticated power<br />
loss analysis and investigation of noise sources.<br />
The oscilloscope offers a comprehensive set of integrated analysis tools<br />
including waveform- and screen-based cursors, automated measurements,<br />
advanced waveform math including arbitrary equation editing, spectral<br />
math, FFT analysis, and trend plots for visually determining how a<br />
measurement is changing over time. Specialized application support for<br />
serial bus analysis, power supply design, and video design and<br />
development is also available.<br />
For extended analysis, National Instrument’s LabVIEW SignalExpress ®<br />
<strong>Tektronix</strong> Edition provides over 200 built-in functions including time and<br />
frequency domain analysis, limit testing, data logging, and customizable<br />
reports.<br />
Search<br />
Finding your event of interest in a long waveform record can be time<br />
consuming without the right search tools. With today’s record lengths<br />
pushing beyond a million data points, locating your event can mean<br />
scrolling through thousands of screens of signal activity.<br />
The innovative Wave Inspector ® controls give you the industry’s most<br />
comprehensive search and waveform navigation capability. These controls<br />
speed panning and zooming through your record. With a unique forcefeedback<br />
system, you can move from one end of your record to the other in<br />
just seconds. User marks allow you to mark any location that you may want<br />
to reference later for further investigation. Or, automatically search your<br />
record for criteria you define. Wave Inspector will instantly search your<br />
entire record, including analog, digital, serial-bus, and RF-versus-time data.<br />
8 www.tektronix.com
<strong>Mixed</strong> <strong>Domain</strong> <strong>Oscilloscopes</strong> — <strong>MDO4000</strong> <strong>Series</strong><br />
Analyze – Waveform histogram of a falling edge showing the distribution of edge position<br />
(jitter) over time. Included are numeric measurements made on the waveform histogram<br />
data. A comprehensive set of integrated analysis tools speeds verification of your<br />
design's performance.<br />
www.tektronix.com 9
<strong>Datasheet</strong><br />
Specifications<br />
All specifications apply to all models unless noted otherwise.<br />
Model overview<br />
MDO4014-3 MDO4034-3 MDO4054-3 MDO4054-6 MDO4104-3 MDO4104-6<br />
Analog channels 4 4 4 4 4 4<br />
Analog channel bandwidth 100 MHz 350 MHz 500 MHz 500 MHz 1 GHz 1 GHz<br />
Rise time 3.5 ns 1 ns 700 ps 700 ps 350 ps 350 ps<br />
Sample rate (1 ch) 2.5 GS/s 2.5 GS/s 2.5 GS/s 2.5 GS/s 5 GS/s 5 GS/s<br />
Sample rate (2 ch) 2.5 GS/s 2.5 GS/s 2.5 GS/s 2.5 GS/s 5 GS/s 5 GS/s<br />
Sample rate (4 ch) 2.5 GS/s 2.5 GS/s 2.5 GS/s 2.5 GS/s 2.5 GS/s 2.5 GS/s<br />
Record length (1 ch) 20M 20M 20M 20M 20M 20M<br />
Record length (2 ch) 20M 20M 20M 20M 20M 20M<br />
Record length (4 ch) 20M 20M 20M 20M 20M 20M<br />
Digital channels 16 16 16 16 16 16<br />
RF channels 1 1 1 1 1 1<br />
RF channel frequency range 50 kHz - 3 GHz 50 kHz - 3 GHz 50 kHz - 3 GHz 50 kHz - 6 GHz 50 kHz - 3 GHz 50 kHz - 6 GHz<br />
RF channel<br />
Real-time capture bandwidth<br />
Span<br />
Resolution bandwidth<br />
Reference level<br />
Vertical scale<br />
Vertical position<br />
Vertical units<br />
≥1 GHz<br />
1 kHz - 3 GHz or 1 kHz - 6 GHz, in a 1-2-5 sequence<br />
20 Hz - 10 MHz in a 1-2-3-5 sequence<br />
-140 dBm to +30 dBm in steps of 5 dBm<br />
1 dB/div to 20 dB/div in a 1-2-5 sequence<br />
-10 divs to +10 divs<br />
dBm, dBmV, dBµV, dBµW, dBmA, dBµA<br />
Displayed average noise level<br />
(DANL)<br />
50 kHz - 5 MHz < -130 dBm/Hz (< -134 dBm/Hz typical)<br />
5 MHz - 3 GHz < -148 dBm/Hz (< -152 dBm/Hz typical)<br />
3 GHz - 6 GHz < -140 dBm/Hz (< -143 dBm/Hz typical)<br />
Spurious response<br />
2nd and 3rd harmonic<br />
distortion (>30 MHz)<br />
2nd order intermodulation<br />
distortion<br />
3rd order intermodulation<br />
distortion<br />
Other A/D spurs<br />
Image and IF Rejection<br />
Residual response<br />
< -55 dBc (< -60 dBc typical)<br />
< -55 dBc (< -60 dBc typical)<br />
< -60 dBc (< -63 dBc typical)<br />
< -55 dBc (< -60 dBc typical)<br />
< -50 dBc (< -55 dBc typical)<br />
< -78 dBm<br />
10 www.tektronix.com
<strong>Mixed</strong> <strong>Domain</strong> <strong>Oscilloscopes</strong> — <strong>MDO4000</strong> <strong>Series</strong><br />
Crosstalk to RF channel from<br />
oscilloscope channels<br />
≤1 GHz input frequencies<br />
>1 GHz - 2 GHz input<br />
frequencies<br />
< -68 dB from ref level<br />
< -48 dB from ref level<br />
Phase noise at 2 GHz CW<br />
10 kHz < -90 dBc/Hz, < -95 dBc/Hz (typical)<br />
100 kHz < -95 dBc/Hz, < -98 dBc/Hz (typical)<br />
1 MHz < -113 dBc/Hz, < -118 dBc/Hz (typical)<br />
Level measurement uncertainty for input level +10 dBm to - 50 dBm<br />
20 °C - 30 °C < ±1 dB (< ±0.5 dB typical)<br />
Over operating range<br />
< ±1.5 dB<br />
Residual FM<br />
≤100 Hz peak-to-peak in 100 ms<br />
Maximum operating input level<br />
Average continuous power +30 dBm (1 W)<br />
DC maximum before damage<br />
Maximum power before<br />
damage (CW)<br />
Maximum power before<br />
damage (pulse)<br />
Power level trigger<br />
Frequency range<br />
Amplitude range<br />
Limits<br />
±40 V DC<br />
+33 dBm (2 W)<br />
+45 dBm (32 W) (
<strong>Datasheet</strong><br />
RF acquisition length Span Maximum RF acquisition time<br />
>2 GHz 2.5 ms<br />
>1 GHz - 2 GHz 5 ms<br />
>800 MHz - 1 GHz 10 ms<br />
>500 MHz - 800 MHz 12.5 ms<br />
>400 MHz - 500 MHz 20 ms<br />
>250 MHz - 400 MHz 25 ms<br />
>200 MHz - 250 MHz 40 ms<br />
>160 MHz - 200 MHz 50 ms<br />
>125 MHz - 160 MHz 62.5 ms<br />
100 MHz up to the rated bandwidth<br />
Offset range Volts/div setting Offset range<br />
1 MΩ input 50 Ω<br />
1 mV/div to 50 mV/div ±1 V ±1 V<br />
50.5 mV/div to 99.5 mV/div ±0.5 V ±0.5 V<br />
100 mV/div to 500 mV/div ±10 V ±10V<br />
505 mV/div to 995 mV/div ±5 V ±5 V<br />
1 V/div to 5 V/div ±100 V ±5 V<br />
5.05 V/div to 10 V/div ±50 V NA<br />
12 www.tektronix.com
<strong>Mixed</strong> <strong>Domain</strong> <strong>Oscilloscopes</strong> — <strong>MDO4000</strong> <strong>Series</strong><br />
Vertical system digital channels<br />
Input channels 16 digital (D15 to D0)<br />
Thresholds<br />
Threshold selections<br />
User-defined threshold range<br />
Threshold accuracy<br />
Maximum input voltage<br />
Input dynamic range<br />
Minimum voltage swing<br />
Probe loading<br />
Vertical resolution<br />
Per-channel thresholds<br />
TTL, CMOS, ECL, PECL, User Defined<br />
±40 V<br />
±[100 mV + 3% of threshold setting]<br />
±42 V peak<br />
30 V p-p ≤200 MHz<br />
10 V p-p >200 MHz<br />
400 mV<br />
100 kΩ in parallel with 3 pF<br />
1 bit<br />
Horizontal system analog channels<br />
Time base range<br />
1 GHz models 400 ps to 1000 s<br />
≤ 500 MHz models<br />
Maximum duration at highest<br />
sample rate (all/half channels)<br />
1 GHz models 8/4 ms<br />
≤ 500 MHz models<br />
1 ns to 1000 s<br />
8/8 ms<br />
Time-base delay time range<br />
Channel-to-channel deskew range<br />
Time base accuracy<br />
-10 divisions to 5000 s<br />
±125 ns<br />
±5 ppm over any ≥1 ms interval<br />
Horizontal system digital channels<br />
Maximum sample rate (Main)<br />
Maximum record length (Main)<br />
Maximum sample rate (MagniVu)<br />
Maximum record length (MagniVu)<br />
Minimum detectable pulse width<br />
(typical)<br />
Channel-to-channel skew (typical)<br />
Maximum input toggle rate<br />
500 MS/s (2 ns resolution)<br />
20M points<br />
16.5 GS/s (60.6 ps resolution)<br />
10k points centered around the trigger<br />
1 ns<br />
200 ps<br />
500 MHz (Maximum frequency sine wave that can accurately be reproduced as a logic square wave. Requires the use of a short<br />
ground extender on each channel. This is the maximum frequency at the minimum swing amplitude. Higher toggle rates can be<br />
achieved with higher amplitudes.)<br />
www.tektronix.com 13
<strong>Datasheet</strong><br />
Trigger system<br />
Trigger modes<br />
Trigger coupling<br />
Trigger holdoff range<br />
Auto, Normal, and Single<br />
DC, AC, HF reject (attenuates >50 kHz), LF reject (attenuates ,
<strong>Mixed</strong> <strong>Domain</strong> <strong>Oscilloscopes</strong> — <strong>MDO4000</strong> <strong>Series</strong><br />
USB: Full speed (optional)<br />
USB: High speed (optional) 1<br />
Ethernet (optional) 2<br />
CAN (optional)<br />
LIN (optional)<br />
FlexRay (optional)<br />
Trigger on Sync, Reset, Suspend, Resume, End of Packet, Token (Address) Packet, Data Packet, Handshake Packet, Special<br />
Packet, Error.<br />
Token packet trigger - Any token type, SOF, OUT, IN, SETUP; Address can be specified for Any Token, OUT, IN, and SETUP<br />
token types. Address can be further specified to trigger on ≤, , ≥, ≠ a particular value, or inside or outside of a range. Frame<br />
number can be specified for SOF token using binary, hex, unsigned decimal and don't care digits.<br />
Data packet trigger - Any data type, DATA0, DATA1; Data can be further specified to trigger on ≤, , ≥, ≠ a particular data<br />
value, or inside or outside of a range.<br />
Handshake packet trigger - Any handshake type, ACK, NAK, STALL.<br />
Special packet trigger - Any special type, PRE, Reserved.<br />
Error trigger - PID Check, CRC5 or CRC16, Bit Stuffing.<br />
Trigger on Sync, Reset, Suspend, Resume, End of Packet, Token (Address) Packet, Data Packet, Handshake Packet, Special<br />
Packet, Error.<br />
Token packet trigger - Any token type, SOF, OUT, IN, SETUP; Address can be specified for Any Token, OUT, IN, and SETUP<br />
token types. Address can be further specified to trigger on ≤, , ≥, ≠ a particular value, or inside or outside of a range. Frame<br />
number can be specified for SOF token using binary, hex, unsigned decimal and don't care digits.<br />
Data packet trigger - Any data type, DATA0, DATA1, DATA2, MDATA; Data can be further specified to trigger on ≤, , ≥, ≠ a<br />
particular data value, or inside or outside of a range.<br />
Handshake packet trigger - Any handshake type, ACK, NAK, STALL, NYET.<br />
Special packet trigger - Any special type, ERR, SPLIT, PING, Reserved. SPLIT packet components that can be specified include:<br />
▪ Hub Address<br />
▪ Start/Complete - Don't Care, Start (SSPLIT), Complete (CSPLIT)<br />
▪ Port Address<br />
▪ Start and End bits - Don't Care, Control/Bulk/Interrupt (Full-speed Device, Low-speed Device), Isochronous (Data is Middle, Data<br />
is End, Data is Start, Data is All)<br />
▪ Endpoint Type - Don't Care, Control, Isochronous, Bulk, Interrupt<br />
Error trigger - PID Check, CRC5 or CRC16.<br />
10BASE-T and 100BASE-TX: Trigger on Start Frame Delimiter, MAC Addresses, MAC Q-Tag Control Information, MAC Length/<br />
Type, IP Header, TCP Header, TCP/IPv4/MAC Client Data, End of Packet, and FCS (CRC) Error.<br />
100BASE-TX: Idle.<br />
MAC Addresses - Trigger on Source and Destination 48-bit address values.<br />
MAC Q-Tag Control Information - Trigger on Q-Tag 32-bit value.<br />
MAC Length/Type - Trigger on ≤, , ≥, ≠ a particular 16-bit value, or inside or outside of a range.<br />
IP Header - Trigger on IP Protocol 8-bit value, Source Address, Destination Address.<br />
TCP Header - Trigger on Source Port, Destination Port, Sequence Number, and Ack Number.<br />
TCP/IPv4/MAC Client Data - Trigger on ≤, , ≥, ≠ a particular data value, or inside or outside of a range. Selectable number of<br />
bytes to trigger on from 1-16. Byte offset options of Don't Care, 0-1499.<br />
Trigger on Start of Frame, Frame Type (data, remote, error, overload), Identifier (standard or extended), Data, Identifier and Data,<br />
End of Frame, Missing ACK, or Bit Stuffing Error on CAN signals up to 1 Mb/s. Data can be further specified to trigger on ≤, ,<br />
≥, or ≠ a specific data value. User-adjustable sample point is set to 50% by default.<br />
Trigger on Sync, Identifier, Data, Identifier and Data, Wakeup Frame, Sleep Frame, Errors such as Sync, Parity, or Checksum<br />
Errors up to 100 kb/s (by LIN definition, 20 kb/s).<br />
Trigger on Start of Frame, Type of Frame (Normal, Payload, Null, Sync, Startup), Identifier, Cycle Count, Complete Header Field,<br />
Data, Identifier and Data, End of Frame or Errors such as Header CRC, Trailer CRC, Null Frame, Sync Frame, or Startup Frame<br />
Errors up to 100 Mb/s.<br />
1 High-speed support only available on models with 1 GHz analog channel bandwidth.<br />
2 ≥350 MHz bandwidth models are recommended for 100BASE-TX<br />
www.tektronix.com 15
<strong>Datasheet</strong><br />
MIL-STD-1553 (optional)<br />
I 2 S/LJ/RJ/TDM (optional)<br />
Parallel<br />
Trigger on Sync, Word Type 3 (Command, Status, Data), Command Word (set RT Address, T/R, Sub-address/Mode, Data Word<br />
Count/Mode Code, and Parity individually), Status Word (set RT Address, Message Error, Instrumentation, Service Request Bit,<br />
Broadcast Command Received, Busy, Subsystem Flag, Dynamic Bus Control Acceptance (DBCA), Terminal Flag, and Parity<br />
individually), Data Word (user-specified 16-bit data value), Error (Sync, Parity, Manchester, Non-contiguous data), Idle Time<br />
(minimum time selectable from 2 µs to 100 µs; maximum time selectable from 2 µs to 100 µs; trigger on < minimum, > maximum,<br />
inside range, outside range). RT Address can be further specified to trigger on =, ≠, , ≤, ≥ a particular value, or inside or outside<br />
of a range.<br />
Trigger on Word Select, Frame Sync, or Data. Data can be further specified to trigger on ≤, , ≥, ≠ a specific data value, or<br />
inside or outside of a range. Maximum data rate for I 2 S/LJ/RJ is 12.5 Mb/s. Maximum data rate for TDM is 25 Mb/s.<br />
Trigger on a parallel bus data value. Parallel bus can be from 1 to 20 bits (from the digital and analog channels) in size. Binary and<br />
Hex radices are supported.<br />
Acquisition system<br />
Acquisition Modes<br />
Sample<br />
Peak Detect<br />
Averaging<br />
Envelope<br />
Hi Res<br />
Roll<br />
Acquire sampled values.<br />
Captures glitches as narrow as 800 ps (1 GHz models) or 1.6 ns (≤500 MHz models) at all sweep speeds<br />
From 2 to 512 waveforms included in average.<br />
Min-max envelope reflecting Peak Detect data over multiple acquisitions.<br />
Real-time boxcar averaging reduces random noise and increases vertical resolution.<br />
Scrolls waveforms right to left across the screen at sweep speeds slower than or equal to 40 ms/div.<br />
Waveform measurements<br />
Cursors<br />
Automatic measurements (time<br />
domain)<br />
Automatic Measurements<br />
(frequency domain)<br />
Measurement statistics<br />
Reference levels<br />
Gating<br />
Waveform histogram<br />
Waveform histogram<br />
measurements<br />
Waveform and Screen.<br />
29, of which up to eight can be displayed on-screen at any one time. Measurements include: Period, Frequency, Delay, Rise Time,<br />
Fall Time, Positive Duty Cycle, Negative Duty Cycle, Positive Pulse Width, Negative Pulse Width, Burst Width, Phase, Positive<br />
Overshoot, Negative Overshoot, Peak to Peak, Amplitude, High, Low, Max, Min, Mean, Cycle Mean, RMS, Cycle RMS, Positive<br />
Pulse Count, Negative Pulse Count, Rising Edge Count, Falling Edge Count, Area and Cycle Area.<br />
3, of which one can be displayed on-screen at any one time. Measurements include Channel Power, Adjacent Channel Power Ratio<br />
(ACPR), and Occupied Bandwidth (OBW)<br />
Mean, Min, Max, Standard Deviation.<br />
User-definable reference levels for automatic measurements can be specified in either percent or units.<br />
Isolate the specific occurrence within an acquisition to take measurements on, using either the screen, or waveform cursors.<br />
A waveform histogram provides an array of data values representing the total number of hits inside of a user-defined region of the<br />
display. A waveform histogram is both a visual graph of the hit distribution as well as a numeric array of values that can be<br />
measured.<br />
Sources - Channel 1, Channel 2, Channel 3, Channel 4, Ref 1, Ref 2, Ref 3, Ref 4, Math<br />
Types - Vertical, Horizontal<br />
Waveform Count, Hits in Box, Peak Hits, Median, Max, Min, Peak-to-Peak, Mean, Standard Deviation, Sigma 1, Sigma 2, Sigma 3<br />
3 Trigger selection of Command Word will trigger on Command and ambiguous Command/Status words. Trigger selection of Status Word will trigger on Status and ambiguous Command/Status words.<br />
16 www.tektronix.com
<strong>Mixed</strong> <strong>Domain</strong> <strong>Oscilloscopes</strong> — <strong>MDO4000</strong> <strong>Series</strong><br />
Waveform math<br />
Arithmetic<br />
Math functions<br />
FFT<br />
Spectrum math<br />
Advanced math<br />
Add, subtract, multiply, and divide waveforms.<br />
Integrate, Differentiate, FFT.<br />
Spectral magnitude. Set FFT Vertical Scale to Linear RMS or dBV RMS, and FFT Window to Rectangular, Hamming, Hanning, or<br />
Blackman-Harris.<br />
Add or subtract frequency-domain traces.<br />
Define extensive algebraic expressions including waveforms, reference waveforms, math functions (FFT, Intg, Diff, Log, Exp, Sqrt,<br />
Abs, Sine, Cosine, Tangent, Rad, Deg), scalars, up to two user-adjustable variables and results of parametric measurements<br />
(Period, Freq, Delay, Rise, Fall, PosWidth, NegWidth, BurstWidth, Phase, PosDutyCycle, NegDutyCycle, PosOverShoot,<br />
NegOverShoot, PeakPeak, Amplitude, RMS, CycleRMS, High, Low, Max, Min, Mean, CycleMean, Area, CycleArea, and trend<br />
plots), e.g.,(Intg(Ch1 - Mean(Ch1)) × 1.414 × VAR1).<br />
Power measurements (optional)<br />
Power Quality Measurements<br />
Switching loss measurements<br />
Power loss<br />
Energy loss<br />
Harmonics<br />
V RMS , V Crest Factor , Frequency, I RMS , I Crest Factor , True Power, Apparent Power, Reactive Power, Power Factor, Phase Angle.<br />
T on , T off , Conduction, Total.<br />
T on , T off , Conduction, Total.<br />
THD-F, THD-R, RMS measurements. Graphical and table displays of harmonics. Test to IEC61000-3-2 Class A and MIL-<br />
STD-1399, Section 300A.<br />
Ripple measurements V Ripple and I Ripple .<br />
Modulation Analysis<br />
Safe operating area<br />
dV/dt and dI/dt measurements<br />
Graphical display of +Pulse Width, –Pulse Width, Period, Frequency, +Duty Cycle, and –Duty Cycle modulation types.<br />
Graphical display and mask testing of switching device safe operating area measurements.<br />
Cursor measurements of slew rate.<br />
Limit/Mask testing (optional)<br />
Included standard masks 4<br />
Test source<br />
Mask creation<br />
Mask scaling<br />
Test criteria run until<br />
ITU-T, ANSI T1.102, USB<br />
Limit test: Any Ch1 - Ch4 or any R1 - R4<br />
Mask test: Any Ch1 - Ch4<br />
Limit test vertical tolerance from 0 to 1 division in 1 m division increments; Limit test horizontal tolerance from 0 to 500 m division in<br />
1 m division increments<br />
Load standard mask from internal memory<br />
Load custom mask from text file with up to 8 segments<br />
Lock to Source ON (mask automatically re-scales with source-channel settings changes)<br />
Lock to Source OFF (mask does not re-scale with source-channel settings changes)<br />
Minimum number of waveforms (from 1 to 1,000,000; Infinity)<br />
Minimum elapsed time (from 1 second to 48 hours; Infinity)<br />
Violation threshold From 1 to 1,000,000<br />
Actions on test failure<br />
Actions on test complete<br />
Results display<br />
Stop acquisition, save screen image to file, save waveform to file, print screen image, trigger out pulse, set remote interface SRQ<br />
Trigger out pulse, set remote interface SRQ<br />
Test status, total waveforms, number of violations, violation rate, total tests, failed tests, test failure rate, elapsed time, total hits for<br />
each mask segment<br />
4 ≥350 MHz bandwidth models are recommended for mask testing on telecomm standards >55 Mb/s. 1 GHz bandwidth models are recommended for mask testing on high-speed (HS) USB.<br />
www.tektronix.com 17
<strong>Datasheet</strong><br />
Software<br />
NI LabVIEW SignalExpress <br />
<strong>Tektronix</strong> Edition<br />
OpenChoice ® Desktop<br />
IVI driver<br />
e*Scope ® Web-based remote<br />
control<br />
LXI Class C Web interface<br />
A fully interactive measurement software environment optimized for your <strong>Tektronix</strong> oscilloscope, enables you to instantly acquire,<br />
generate, analyze, compare, import, and save measurement data and signals using an intuitive drag-and-drop user interface that<br />
does not require any programming.<br />
Standard support for acquiring, controlling, viewing, and exporting your live analog-channel signal data is permanently available<br />
through the software. The full version (SIGEXPTE) adds additional signal processing, advanced analysis, mixed signal, sweeping,<br />
limit testing, and user-defined step capabilities and is available for a 30-day trial period standard with each instrument.<br />
Enables fast and easy communication between a Windows PC and your oscilloscope using USB or LAN. Transfer and save<br />
settings, waveforms, measurements, and screen images. Included Word and Excel toolbars automate the transfer of acquisition<br />
data and screen images from the oscilloscope into Word and Excel for quick reporting or further analysis.<br />
Provides a standard instrument programming interface for common applications such as LabVIEW, LabWindows/CVI,<br />
Microsoft .NET, and MATLAB.<br />
Enables control of the oscilloscope over a network connection through a standard web browser. Simply enter the IP address or<br />
network name of the oscilloscope and a web page will be served to the browser.<br />
Connect to the oscilloscope through a standard Web browser by simply entering the oscilloscope's IP address or network name in<br />
the address bar of the browser. The Web interface enables viewing of instrument status and configuration, status and modification<br />
of network settings, and instrument control through the e*Scope Web-based remote control. All Web interaction conforms to LXI<br />
Class C specification, version 1.3.<br />
Display system<br />
Display type<br />
Display resolution<br />
Interpolation<br />
Waveform styles<br />
Graticules<br />
Format<br />
Maximum waveform capture rate<br />
10.4 in. (264 mm) liquid-crystal TFT color display<br />
1,024 horizontal × 768 vertical pixels (XGA)<br />
Sin(x)/x<br />
Vectors, Dots, Variable Persistence, Infinite Persistence.<br />
Full, Grid, Cross Hair, Frame, IRE and mV.<br />
YT and simultaneous XY/YT<br />
>50,000 wfm/s.<br />
Input/output ports<br />
USB 2.0 high-speed host port<br />
USB 2.0 device port<br />
LAN port<br />
Video out port<br />
Probe compensator output voltage<br />
and frequency<br />
Amplitude<br />
Frequency<br />
Auxiliary out<br />
Supports USB mass storage devices, printers and keyboard. Two ports on front and two ports on rear of instrument.<br />
Rear-panel connector allows for communication/control of oscilloscope through USBTMC or GPIB (with a TEK-USB-488), and<br />
direct printing to all PictBridge-compatible printers.<br />
RJ-45 connector, supports 10/100/1000 Mb/s<br />
DB-15 female connector, connect to show the oscilloscope display on an external monitor or projector. XGA resolution.<br />
Front-panel pins<br />
0 to 2.5 V<br />
1 kHz<br />
Rear-panel BNC connector<br />
V OUT (Hi): ≥2.5 V open circuit, ≥1.0 V 50 Ω to ground<br />
V OUT (Lo): ≤0.7 V into a load of ≤4 mA; ≤0.25 V 50 Ω to ground<br />
Output can be configured to provide a pulse out signal when the oscilloscope triggers, the internal oscilloscope reference clock out,<br />
or an event out for limit/mask testing.<br />
External reference input Time-base system can phase lock to an external 10 MHz reference (10 MHz ±1%)<br />
18 www.tektronix.com
<strong>Mixed</strong> <strong>Domain</strong> <strong>Oscilloscopes</strong> — <strong>MDO4000</strong> <strong>Series</strong><br />
Kensington-style lock<br />
VESA mount<br />
Rear-panel security slot connects to standard Kensington-style lock.<br />
Standard (MIS-D 100) 100 mm VESA mounting points on rear of instrument.<br />
LAN eXtensions for Instrumentation (LXI)<br />
Class<br />
LXI Class C<br />
Version V1.3<br />
Power source<br />
Power source voltage 100 to 240 V ±10%<br />
Power source frequency 50 to 60 Hz ±10% at 100 to 240 V ±10%<br />
400 Hz ±10% at 115 V ±13%<br />
Power consumption<br />
225 W maximum<br />
Physical characteristics<br />
Dimensions mm in.<br />
Height 229 9.0<br />
Width 439 17.3<br />
Depth 147 5.8<br />
Weight kg lb.<br />
Net 5 11<br />
Shipping 10.7 23.6<br />
Rackmount configuration<br />
Cooling clearance<br />
5U<br />
2 in. (51 mm) required on left side and rear of instrument<br />
EMC, environment, and safety<br />
Temperature<br />
Operating<br />
Nonoperating<br />
Humidity<br />
Operating<br />
Nonoperating<br />
Altitude<br />
Operating<br />
Nonoperating<br />
Regulatory<br />
Electromagnetic compatibility<br />
Safety<br />
0 ºC to +50 ºC (+32 ºF to 122 ºF)<br />
-20 ºC to +60 ºC (-4 ºF to 140 ºF)<br />
High: 40 ºC to 50 ºC, 10% to 60% relative humidity Low: 0 ºC to 40 ºC, 10% to 90% relative humidity<br />
High: 40 ºC to 60 ºC, 5%to 60% relative humidity Low: 0 ºC to 40 ºC, 5% to 90% relative humidity<br />
3,000 meters (9,843 feet)<br />
9,144 meters (30,000 feet)<br />
EC Council Directive 2004/108/EC<br />
UL61010-1:2004, CAN/CSA-C22.2 No. 61010.1: 2004, Low Voltage Directive 2006/95/EC and EN61010-1:2001,<br />
IEC 61010-1:2001, ANSI 61010-1-2004, ISA 82.02.01<br />
www.tektronix.com 19
<strong>Datasheet</strong><br />
Ordering information<br />
<strong>MDO4000</strong> family<br />
MDO4014-3<br />
MDO4034-3<br />
MDO4054-3<br />
MDO4054-6<br />
MDO4104-3<br />
MDO4104-6<br />
<strong>Mixed</strong> <strong>Domain</strong> Oscilloscope with (4) 100 MHz analog channels, (16) digital channels, and (1) 3 GHz RF input<br />
<strong>Mixed</strong> <strong>Domain</strong> Oscilloscope with (4) 350 MHz analog channels, (16) digital channels, and (1) 3 GHz RF input<br />
<strong>Mixed</strong> <strong>Domain</strong> Oscilloscope with (4) 500 MHz analog channels, (16) digital channels, and (1) 3 GHz RF input<br />
<strong>Mixed</strong> <strong>Domain</strong> Oscilloscope with (4) 500 MHz analog channels, (16) digital channels, and (1) 6 GHz RF input<br />
<strong>Mixed</strong> <strong>Domain</strong> Oscilloscope with (4) 1 GHz analog channels, (16) digital channels, and (1) 3 GHz RF input<br />
<strong>Mixed</strong> <strong>Domain</strong> Oscilloscope with (4) 1 GHz analog channels, (16) digital channels, and (1) 6 GHz RF input<br />
Standard accessories<br />
Probes<br />
≤ 500 MHz models<br />
TPP0500, 500 MHz bandwidth, 10X, 3.9 pF. One passive voltage probe per analog channel.<br />
1 GHz models TPP1000, 1 GHz bandwidth, 10X, 3.9 pF. One passive voltage probe per analog channel.<br />
All models<br />
One P6616 16-channel logic probe and a logic probe accessory kit (020-2662-xx).<br />
Accessories<br />
200-5130-xx<br />
Front cover<br />
103-0045-00 N-to-BNC adapter<br />
063-4367-xx<br />
016-2030-xx<br />
Documentation CD<br />
Accessory bag<br />
— User manual<br />
— Power cord<br />
— OpenChoice ® Desktop Software<br />
— NI LabVIEW SignalExpress <strong>Tektronix</strong> Edition Software<br />
— Calibration certificate documenting traceability to National Metrology Institute(s) and ISO9001 quality system registration<br />
Warranty<br />
Three-year warranty covering all parts and labor, excluding probes.<br />
20 www.tektronix.com
<strong>Mixed</strong> <strong>Domain</strong> <strong>Oscilloscopes</strong> — <strong>MDO4000</strong> <strong>Series</strong><br />
Application Modules<br />
Application modules have licenses which can be transferred between an application module and an oscilloscope. The license may be contained in the module; allowing the<br />
module to be moved from one instrument to another. Or, the license can be contained in the oscilloscope; allowing the module to be removed and stored for safekeeping.<br />
Transferring the license to an oscilloscope and removing the module permits the use of more than 4 applications simultaneously.<br />
DPO4AERO<br />
DPO4AUDIO<br />
DPO4AUTO<br />
DPO4AUTOMAX<br />
DPO4COMP<br />
DPO4EMBD<br />
Aerospace Serial Triggering and Analysis Module. Enables triggering on packet-level information on MIL-STD-1553 buses as well<br />
as analytical tools such as digital views of the signal, bus views, packet decoding, search tools, and packet decode tables with timestamp<br />
information.<br />
Signal Inputs - Any Ch1 - Ch4, Math, Ref1 - Ref4<br />
Recommended Probing - Differential or single ended (only one single-ended signal required)<br />
Audio Serial Triggering and Analysis Module. Enables triggering on packet-level information on I 2 S, LJ, RJ, and TDM audio buses<br />
as well as analytical tools such as digital views of the signal, bus views, packet decoding, search tools, and packet decode tables<br />
with time-stamp information.<br />
Signal Inputs - Any Ch1 - Ch4, any D0 - D15<br />
Recommended Probing - Single ended<br />
Automotive Serial Triggering and Analysis Module. Enables triggering on packet-level information on CAN and LIN buses as well as<br />
analytical tools such as digital views of the signal, bus views, packet decoding, search tools, and packet decode tables with timestamp<br />
information.<br />
Signal Inputs - LIN: Any Ch1 - Ch4, any D0 - D15; CAN: Any Ch1 - Ch4, any D0 - D15<br />
Recommended Probing - LIN: Single ended; CAN: Single ended or differential<br />
Extended Automotive Serial Triggering and Analysis Module. Enables triggering on packet-level information on CAN, LIN, and<br />
FlexRay buses as well as analytical tools such as digital views of the signal, bus views, packet decoding, search tools, packet<br />
decode tables with time-stamp information, and eye diagram analysis software.<br />
Signal Inputs - LIN: Any Ch1 - Ch4, any D0 - D15; CAN: Any Ch1 - Ch4, any D0 - D15; FlexRay: Any Ch1 - Ch4, any D0 - D15<br />
Recommended Probing - LIN: Single ended; CAN, FlexRay: Single ended or differential<br />
Computer Serial Triggering and Analysis Module. Enables triggering on packet-level information on RS-232/422/485/UART buses<br />
as well as analytical tools such as digital views of the signal, bus views, packet decoding, search tools, and packet decode tables<br />
with time-stamp information.<br />
Signal Inputs - Any Ch1 - Ch4, any D0 - D15<br />
Recommended Probing - RS-232/UART: Single ended; RS-422/485: Differential<br />
Embedded Serial Triggering and Analysis Module. Enables triggering on packet-level information on I 2 C and SPI buses as well as<br />
analytical tools such as digital views of the signal, bus views, packet decoding, search tools, and packet decode tables with timestamp<br />
information.<br />
Signal Inputs - I 2 C: Any Ch1 - Ch4, any D0 - D15; SPI: Any Ch1 - Ch4, any D0 - D15<br />
Recommended Probing - Single ended<br />
DPO4ENET Ethernet Serial Triggering and Analysis Module. Enables triggering on packet-level information on 10BASE-T and 100BASE-TX 5<br />
buses as well as analytical tools such as digital views of the signal, bus views, packet decoding, search tools, and packet decode<br />
tables with time-stamp information.<br />
Signal Inputs - Any Ch1 - Ch4, Math, Ref1 - Ref4<br />
Recommended Probing - 10BASE-T: Single ended or differential; 100BASE-TX: Differential<br />
5 ≥350 MHz bandwidth models are recommended for 100BASE-TX<br />
www.tektronix.com 21
<strong>Datasheet</strong><br />
DPO4USB<br />
DPO4PWR<br />
DPO4LMT<br />
DPO4VID<br />
MDO4TRIG<br />
USB Serial Triggering and Analysis Module. Enables triggering on packet-level content for low-speed, full-speed, and high-speed<br />
USB serial buses. Also enables analytical tools such as digital views of the signal, bus views, packet decoding, search tools, and<br />
packet decode tables with time-stamp information for low-speed, full-speed, and high-speed USB serial buses. 6<br />
Signal Inputs - Low-speed and Full-speed: Any Ch1 - Ch4, any D0 - D15; Low-speed, Full-speed, and High-speed: Any Ch1 - Ch4,<br />
Math, Ref1 - Ref4<br />
Recommended Probing - Low-speed and Full-speed: Single ended or differential; High-speed: Differential<br />
Power Analysis Application Module. Enables quick and accurate analysis of power quality, switching loss, harmonics, safe<br />
operating area (SOA), modulation, ripple, and slew rate (dI/dt, dV/dt).<br />
Limit and Mask Testing Application Module. Enables testing against limit templates generated from "golden" waveforms and mask<br />
testing using custom or standard telecommunications or computer masks. 7<br />
HDTV and Custom (nonstandard) Video Triggering Module.<br />
Advanced RF Power Level Triggering Module. Enables the power level on the RF input to be used as a source in the following<br />
trigger types: Pulse Width, Runt, Timeout, Logic, and Sequence.<br />
Instrument options<br />
Power cord and plug options<br />
Opt. A0<br />
Opt. A1<br />
Opt. A2<br />
Opt. A3<br />
Opt. A5<br />
Opt. A6<br />
Opt. A10<br />
Opt. A11<br />
Opt. A12<br />
Opt. A99<br />
North America power plug (115 V, 60 Hz)<br />
Universal Euro power plug (220 V, 50 Hz)<br />
United Kingdom power plug (240 V, 50 Hz)<br />
Australia power plug (240 V, 50 Hz)<br />
Switzerland power plug (220 V, 50 Hz)<br />
Japan power plug (100 V, 110/120 V, 60 Hz)<br />
China power plug (50 Hz)<br />
India power plug (50 Hz)<br />
Brazil power plug (60 Hz)<br />
No power cord<br />
Language options<br />
Opt. L0<br />
Opt. L1<br />
Opt. L2<br />
Opt. L3<br />
Opt. L4<br />
Opt. L5<br />
Opt. L6<br />
Opt. L7<br />
Opt. L8<br />
English manual<br />
French manual<br />
Italian manual<br />
German manual<br />
Spanish manual<br />
Japanese manual<br />
Portuguese manual<br />
Simplified Chinese manual<br />
Traditional Chinese manual<br />
6 USB high-speed supported only on models with 1 GHz analog channel bandwidth.<br />
7 ≥350 MHz bandwidth models are recommended for mask testing on telecomm standards >55 Mb/s. 1 GHz bandwidth models are recommended for mask testing on high-speed (HS) USB.<br />
22 www.tektronix.com
<strong>Mixed</strong> <strong>Domain</strong> <strong>Oscilloscopes</strong> — <strong>MDO4000</strong> <strong>Series</strong><br />
Opt. L9<br />
Opt. L10<br />
Korean manual<br />
Russian manual<br />
Opt. L99<br />
No manual<br />
Language options include translated front-panel overlay for the selected language(s).<br />
Service options<br />
Opt. C3<br />
Opt. C5<br />
Opt. D1<br />
Calibration Service 3 Years<br />
Calibration Service 5 Years<br />
Calibration Data Report<br />
Opt. D3 Calibration Data Report 3 Years (with Opt. C3)<br />
Opt. D5 Calibration Data Report 5 Years (with Opt. C5)<br />
Opt. G3<br />
Opt. G5<br />
Opt. R5<br />
Complete Care 3 Years (includes loaner, scheduled calibration, and more)<br />
Complete Care 5 Years (includes loaner, scheduled calibration, and more)<br />
Repair Service 5 Years (including warranty)<br />
Opt. SILV900<br />
Standard warranty extended to 5 years<br />
Probes and accessories are not covered by the oscilloscope warranty and service offerings. Refer to the datasheet of each probe and accessory model for its unique warranty<br />
and calibration terms.<br />
Recommended accessories<br />
Probes<br />
<strong>Tektronix</strong> offers over 100 different probes to meet your application needs. For a comprehensive listing of available probes, please visit www.tektronix.com/probes.<br />
TPP0500<br />
TPP0502<br />
TPP0850<br />
TPP1000<br />
TAP1500<br />
TAP2500<br />
TAP3500<br />
TCP0030<br />
TCP0150<br />
TDP0500<br />
TDP1000<br />
TDP1500<br />
TDP3500<br />
THDP0200<br />
THDP0100<br />
TMDP0200<br />
500 MHz, 10X TekVPI ® passive voltage probe with 3.9 pF input capacitance<br />
500 MHz, 2X TekVPI passive voltage probe with 12.7 pF input capacitance<br />
2.5 kV, 800 MHz, 50X TekVPI passive high-voltage probe<br />
1 GHz, 10X TekVPI passive voltage probe with 3.9 pF input capacitance<br />
1.5 GHz TekVPI active single-ended voltage probe<br />
2.5 GHz TekVPI active single-ended voltage probe<br />
3.5 GHz TekVPI active single-ended voltage probe<br />
120 MHz TekVPI 30 Ampere AC/DC current probe<br />
20 MHz TekVPI 150 Ampere AC/DC current probe<br />
500 MHz TekVPI differential voltage probe with ±42 V differential input voltage<br />
1 GHz TekVPI differential voltage probe with ±42 V differential input voltage<br />
1.5 GHz TekVPI differential voltage probe with ±8.5 V differential input voltage<br />
3.5 GHz TekVPI differential voltage probe with ±2 V differential input voltage<br />
±1.5 kV, 200 MHz TekVPI high-voltage differential probe<br />
±6 kV, 100 MHz TekVPI high-voltage differential probe<br />
±750 V, 200 MHz TekVPI high-voltage differential probe<br />
www.tektronix.com 23
<strong>Datasheet</strong><br />
P5100A<br />
P5200A<br />
2.5 kV, 500 MHz, 100X high-voltage passive probe<br />
1.3 kV, 50 MHz high-voltage differential probe<br />
Accessories<br />
TPA-N-PRE<br />
Preamplifier, 12 dB nominal Gain, 9 kHz - 6 GHz<br />
119-4146-00 Near field probe set, 100 kHz - 1 GHz<br />
119-6609-00 Flexible monopole antenna<br />
TPA-N-VPI<br />
077-0585-xx<br />
TPA-BNC<br />
TEK-DPG<br />
067-1686-xx<br />
SIGEXPTE<br />
FPGAView-A-MSO<br />
FPGAView-X-MSO<br />
TEK-USB-488<br />
ACD4000B<br />
HCTEK54<br />
RMD5000<br />
N-to-TekVPI adapter<br />
Service manual (English only)<br />
TekVPI ® to TekProbe BNC adapter<br />
TekVPI Deskew pulse generator signal source<br />
Power measurement deskew and calibration fixture<br />
National Instruments LabVIEW Signal Express <strong>Tektronix</strong> Edition software – full version<br />
Support for Altera FPGAs<br />
Support for Xilinx FPGAs<br />
GPIB-to-USB adapter<br />
Soft transit case<br />
Hard transit case (requires ACD4000B)<br />
Rackmount kit<br />
<strong>Tektronix</strong> is registered to ISO 9001 and ISO 14001 by SRI Quality System Registrar.<br />
Product(s) complies with IEEE Standard 488.1-1987, RS-232-C, and with <strong>Tektronix</strong> Standard Codes and Formats.<br />
24 www.tektronix.com
<strong>Mixed</strong> <strong>Domain</strong> <strong>Oscilloscopes</strong> — <strong>MDO4000</strong> <strong>Series</strong><br />
www.tektronix.com 25
<strong>Datasheet</strong><br />
ASEAN / Australasia (65) 6356 3900 Austria 00800 2255 4835* Balkans, Israel, South Africa and other ISE Countries +41 52 675 3777<br />
Belgium 00800 2255 4835* Brazil +55 (11) 3759 7627 Canada 1 800 833 9200<br />
Central East Europe and the Baltics +41 52 675 3777 Central Europe & Greece +41 52 675 3777 Denmark +45 80 88 1401<br />
Finland +41 52 675 3777 France 00800 2255 4835* Germany 00800 2255 4835*<br />
Hong Kong 400 820 5835 India 000 800 650 1835 Italy 00800 2255 4835*<br />
Japan 81 (3) 6714 3010 Luxembourg +41 52 675 3777 Mexico, Central/South America & Caribbean 52 (55) 56 04 50 90<br />
Middle East, Asia, and North Africa +41 52 675 3777 The Netherlands 00800 2255 4835* Norway 800 16098<br />
People's Republic of China 400 820 5835 Poland +41 52 675 3777 Portugal 80 08 12370<br />
Republic of Korea 001 800 8255 2835 Russia & CIS +7 (495) 7484900 South Africa +41 52 675 3777<br />
Spain 00800 2255 4835* Sweden 00800 2255 4835* Switzerland 00800 2255 4835*<br />
Taiwan 886 (2) 2722 9622 United Kingdom & Ireland 00800 2255 4835* USA 1 800 833 9200<br />
* European toll-free number. If not accessible, call: +41 52 675 3777 Updated 10 February 2011<br />
For Further Information. <strong>Tektronix</strong> maintains a comprehensive, constantly expanding collection of application notes, technical briefs and other resources to help engineers working on the cutting edge of technology. Please visit www.tektronix.com.<br />
Copyright © <strong>Tektronix</strong>, Inc. All rights reserved. <strong>Tektronix</strong> products are covered by U.S. and foreign patents, issued and pending. Information in this publication supersedes that in all previously published material. Specification and price<br />
change privileges reserved. TEKTRONIX and TEK are registered trademarks of <strong>Tektronix</strong>, Inc. All other trade names referenced are the service marks, trademarks, or registered trademarks of their respective companies.<br />
1 Aug 2012 48W-26875-4<br />
www.tektronix.com