Utah schools directory - USOE - Utah.gov
Utah schools directory - USOE - Utah.gov
Utah schools directory - USOE - Utah.gov

Create successful ePaper yourself
Turn your PDF publications into a flip-book with our unique Google optimized e-Paper software.
UTAH STATE OFFICE OF EDUCATION 250 East 500 South/P.O. Box 144200 Salt Lake City, UT 84114-4200<br />
Patti Harrington, Ed.D., , State Superintendent of Public Instruction www.<strong>schools</strong>.utah.<strong>gov</strong><br />
2008–09 Public School<br />
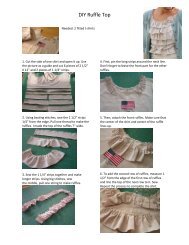
ENROLLMENT DEMOGRAPHICS<br />
Demographic Number Percent<br />
American Indian 7,570 1.4%<br />
Asian 9,593 1.7%<br />
Black 7,955 1.4%<br />
Hispanic 79,400 14.4%<br />
Pacifi c Islander 8,548 1.6%<br />
Unknown Race 3,023 0.5%<br />
White 434,924 79.0%<br />
Total 551,013 100.0%<br />
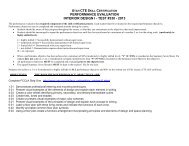
2008 PUBLIC EDUCATION<br />
GENERAL FUND<br />
Funding by Source<br />
7.11% Federal<br />
State<br />
71.05%<br />
Expenditures by Function<br />
70.82%<br />
Instruction<br />
3.39% Local Tuition, Fees,<br />
and Investments<br />
18.45% Property Taxes<br />
21.84% Total Local<br />
Total Revenue = $3,268,363,530<br />
8.46% Support Services<br />
(Students and Staff)<br />
7.39% District and School<br />
Administration<br />
9.46% Plant Operation and<br />
Maintenance<br />
3.70% Student Transportation<br />
.17% Other<br />
Total<br />
Expenditures = $3,059,413,791<br />
PUBLIC SCHOOLS BY<br />
GRADE LEVEL, 2008–09<br />
Type of School Number<br />
Elementary Schools 514<br />
Middle/Junior High Schools 147<br />
High Schools 113<br />
Special Ed. Schools 51<br />
Alternative Schools 46<br />
Charter Schools 66<br />
Vocational Schools 6<br />
Youth in Custody Schools 45<br />
Virtual Schools 6<br />
Total 994<br />
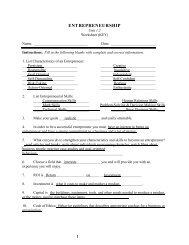
PUBLIC SCHOOL<br />
ENROLLMENT<br />
(October 2008 Enrollment = 551,370)<br />
District Enrollment District Enrollment<br />
Alpine 61,223 No. Sanpete 2,329<br />
Beaver 1,577 No. Summit 988<br />
Box Elder 11,132 Ogden 12,884<br />
Cache 14,579 Park City 4,477<br />
Carbon 3,502 Piute 319<br />
Daggett 142 Provo 13,288<br />
Davis 65,014 Rich 450<br />
Duchesne 4,355 Salt Lake 23,678<br />
Emery 2,256 San Juan 2,889<br />
Garfield 911 Sevier 4,511<br />
Grand 1,498 So. Sanpete 2,955<br />
Granite 68,403 So. Summit 1,427<br />
Iron 8,344 Tintic 232<br />
Jordan 81,017 Tooele 13,406<br />
Juab 2,203 Uintah 6,408<br />
Kane 1,202 Wasatch 4,745<br />
Logan 5,960 Washington 25,775<br />
Millard 2,829 Wayne 531<br />
Morgan 2,276 Weber 29,879<br />
Murray 6,458 Charter Schs. 27,369<br />
Nebo 27,592 USDB* 357<br />
* <strong>Utah</strong> Schools for the Deaf and the Blind<br />
© 2009 JupiterImages Corporation<br />
VALUE OF THE WPU<br />
2008–09 School Year<br />
Weighted Pupil Unit = $2,577 per Pupil<br />
The weighted pupil unit (WPU) is the basic<br />
source of funding for public education and<br />
accounts for about half of all school funding. It<br />
is paid to districts according to enrollments.<br />
Number of Licensed<br />
EDUCATORS<br />
Classroom Teachers 24,333.15<br />
Educator Specialists 2,788.01<br />
District and School<br />
Administrators 1,434.05<br />
Total FTEs 28,555.21<br />
Average Teacher Salary<br />
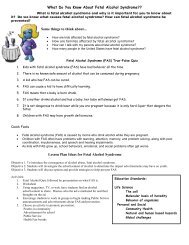
CORE CRT LANGUAGE ARTS<br />
TESTING, 2008<br />
CORE CRT MATHEMATICS<br />
TESTING, 2008<br />
<strong>Utah</strong> (2005–06) $41,359<br />
Nation (2005–06) $50,379<br />
Pupil-Teacher Ratio<br />
<strong>Utah</strong> (2005) 22.1 students<br />
Nation (2005) 15.7 students<br />
Source: National Center for Education Statistics<br />
PER PUPIL SPENDING<br />
in Perspective, 2006<br />
Nation <strong>Utah</strong> Rank<br />
Total $9,154 $5,464 51<br />
Instruction $5,583 $3,453 51<br />
Pupil Support $476 $202 51<br />
Staff Support $446 $256 48<br />
School Admin $515 $332 50<br />
District Admin $182 $64 51<br />
U.S. Census Bureau<br />
Demographic # Students % Passing<br />
Total 404,789 78.22<br />
Female 197,348 81.71<br />
Male 207,441 74.90<br />
American Indian 5,923 53.79<br />
Asian 6,980 80.20<br />
Black 5,851 58.95<br />
Hispanic 56,745 55.14<br />
Pacific Islander 6,163 67.03<br />
White 321,413 83.30<br />
Econ. Disadvantaged 133,638 64.14<br />
Non-Economically<br />
Disadvantaged 271,151 85.16<br />
Limited English Prof. 32,361 41.99<br />
Native English Ability 372,428 81.37<br />
Students With<br />
Disabilities 49,061 44.16<br />
Non-Students With<br />
Disabilities 355,728 82.92<br />
Demographic # Students % Passing<br />
Total 354,817 71.42<br />
Female 172,623 71.25<br />
Male 182,194 71.59<br />
American Indian 5,346 47.31<br />
Asian 5,834 77.31<br />
Black 5,349 48.94<br />
Hispanic 52,629 48.90<br />
Pacifi c Islander 5,560 59.48<br />
White 278,538 76.71<br />
Econ. Disadvantaged 123,585 58.81<br />
Non-Economically<br />
Disadvantaged 231,232 78.17<br />
Limited English Prof. 30,676 41.41<br />
Native English Ability 324,141 74.26<br />
Students With<br />
Disabilities 45,659 43.81<br />
Non-Students With<br />
Disabilities 309,158 75.50<br />
1