LAB 1: INTRODUCTION TO MOTION
LAB 1: INTRODUCTION TO MOTION
LAB 1: INTRODUCTION TO MOTION

Create successful ePaper yourself
Turn your PDF publications into a flip-book with our unique Google optimized e-Paper software.
Lab 1: Uniform Motion<br />
INVESTIGATION 1: POSITION-TIME GRAPHS<br />
Activity 1-1: Producing Position-Time Graphs as You Move<br />
The purpose of this activity is to learn how to relate graphs of position versus time to the<br />
motions they represent.<br />
You will need Pasco’s Data Studio software, CI-750 Interface and a Motion detector. You<br />
will also need a two-meter stick or tape on floor placed at one meter intervals.<br />
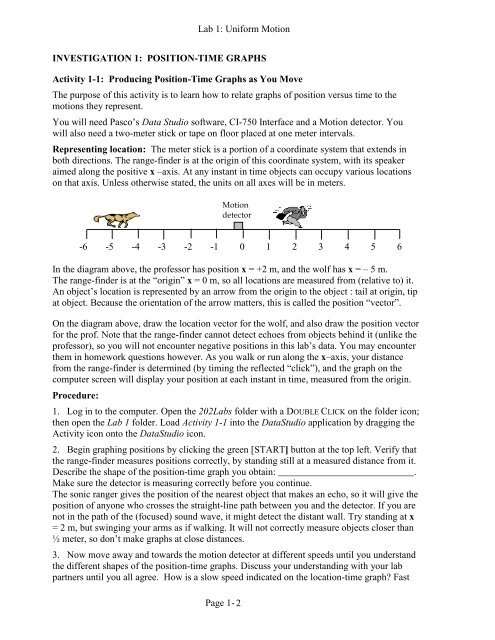
Representing location: The meter stick is a portion of a coordinate system that extends in<br />
both directions. The range-finder is at the origin of this coordinate system, with its speaker<br />
aimed along the positive x –axis. At any instant in time objects can occupy various locations<br />
on that axis. Unless otherwise stated, the units on all axes will be in meters.<br />
Motion<br />
detector<br />
-6 -5 -4 -3 -2 -1 0 1 2 3 4 5 6<br />
In the diagram above, the professor has position x = +2 m, and the wolf has x = – 5 m.<br />
The range-finder is at the “origin” x = 0 m, so all locations are measured from (relative to) it.<br />
An object’s location is represented by an arrow from the origin to the object : tail at origin, tip<br />
at object. Because the orientation of the arrow matters, this is called the position “vector”.<br />
On the diagram above, draw the location vector for the wolf, and also draw the position vector<br />
for the prof. Note that the range-finder cannot detect echoes from objects behind it (unlike the<br />
professor), so you will not encounter negative positions in this lab’s data. You may encounter<br />
them in homework questions however. As you walk or run along the x–axis, your distance<br />
from the range-finder is determined (by timing the reflected “click”), and the graph on the<br />
computer screen will display your position at each instant in time, measured from the origin.<br />
Procedure:<br />
1. Log in to the computer. Open the 202Labs folder with a DOUBLE CLICK on the folder icon;<br />
then open the Lab 1 folder. Load Activity 1-1 into the DataStudio application by dragging the<br />
Activity icon onto the DataStudio icon.<br />
2. Begin graphing positions by clicking the green [START] button at the top left. Verify that<br />
the range-finder measures positions correctly, by standing still at a measured distance from it.<br />
Describe the shape of the position-time graph you obtain: ____________________________.<br />
Make sure the detector is measuring correctly before you continue.<br />
The sonic ranger gives the position of the nearest object that makes an echo, so it will give the<br />
position of anyone who crosses the straight-line path between you and the detector. If you are<br />
not in the path of the (focused) sound wave, it might detect the distant wall. Try standing at x<br />
= 2 m, but swinging your arms as if walking. It will not correctly measure objects closer than<br />
½ meter, so don’t make graphs at close distances.<br />
3. Now move away and towards the motion detector at different speeds until you understand<br />
the different shapes of the position-time graphs. Discuss your understanding with your lab<br />
partners until you all agree. How is a slow speed indicated on the location-time graph? Fast<br />
Page 1- 2