LAB 1: INTRODUCTION TO MOTION
LAB 1: INTRODUCTION TO MOTION
LAB 1: INTRODUCTION TO MOTION
Create successful ePaper yourself
Turn your PDF publications into a flip-book with our unique Google optimized e-Paper software.
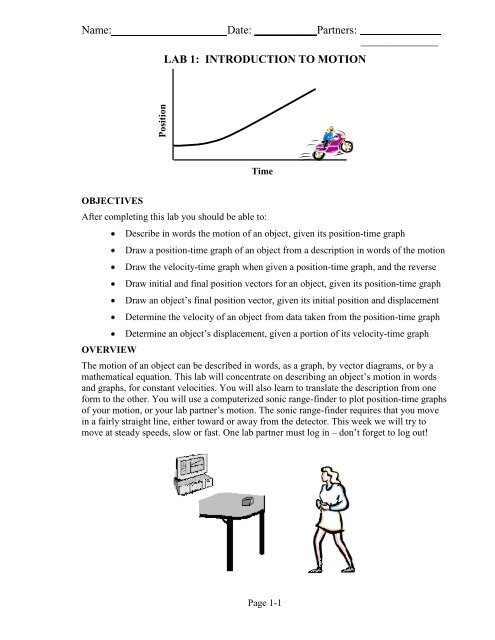
Position<br />
Name:<br />
Date: ___________Partners: ________________<br />
________________<br />
<strong>LAB</strong> 1: <strong>INTRODUCTION</strong> <strong>TO</strong> <strong>MOTION</strong><br />
Time<br />
OBJECTIVES<br />
After completing this lab you should be able to:<br />
OVERVIEW<br />
Describe in words the motion of an object, given its position-time graph<br />
Draw a position-time graph of an object from a description in words of the motion<br />
Draw the velocity-time graph when given a position-time graph, and the reverse<br />
Draw initial and final position vectors for an object, given its position-time graph<br />
Draw an object’s final position vector, given its initial position and displacement<br />
Determine the velocity of an object from data taken from the position-time graph<br />
Determine an object’s displacement, given a portion of its velocity-time graph<br />
The motion of an object can be described in words, as a graph, by vector diagrams, or by a<br />
mathematical equation. This lab will concentrate on describing an object’s motion in words<br />
and graphs, for constant velocities. You will also learn to translate the description from one<br />
form to the other. You will use a computerized sonic range-finder to plot position-time graphs<br />
of your motion, or your lab partner’s motion. The sonic range-finder requires that you move<br />
in a fairly straight line, either toward or away from the detector. This week we will try to<br />
move at steady speeds, slow or fast. One lab partner must log in – don’t forget to log out!<br />
Page 1-1
Lab 1: Uniform Motion<br />
INVESTIGATION 1: POSITION-TIME GRAPHS<br />
Activity 1-1: Producing Position-Time Graphs as You Move<br />
The purpose of this activity is to learn how to relate graphs of position versus time to the<br />
motions they represent.<br />
You will need Pasco’s Data Studio software, CI-750 Interface and a Motion detector. You<br />
will also need a two-meter stick or tape on floor placed at one meter intervals.<br />
Representing location: The meter stick is a portion of a coordinate system that extends in<br />
both directions. The range-finder is at the origin of this coordinate system, with its speaker<br />
aimed along the positive x –axis. At any instant in time objects can occupy various locations<br />
on that axis. Unless otherwise stated, the units on all axes will be in meters.<br />
Motion<br />
detector<br />
-6 -5 -4 -3 -2 -1 0 1 2 3 4 5 6<br />
In the diagram above, the professor has position x = +2 m, and the wolf has x = – 5 m.<br />
The range-finder is at the “origin” x = 0 m, so all locations are measured from (relative to) it.<br />
An object’s location is represented by an arrow from the origin to the object : tail at origin, tip<br />
at object. Because the orientation of the arrow matters, this is called the position “vector”.<br />
On the diagram above, draw the location vector for the wolf, and also draw the position vector<br />
for the prof. Note that the range-finder cannot detect echoes from objects behind it (unlike the<br />
professor), so you will not encounter negative positions in this lab’s data. You may encounter<br />
them in homework questions however. As you walk or run along the x–axis, your distance<br />
from the range-finder is determined (by timing the reflected “click”), and the graph on the<br />
computer screen will display your position at each instant in time, measured from the origin.<br />
Procedure:<br />
1. Log in to the computer. Open the 202Labs folder with a DOUBLE CLICK on the folder icon;<br />
then open the Lab 1 folder. Load Activity 1-1 into the DataStudio application by dragging the<br />
Activity icon onto the DataStudio icon.<br />
2. Begin graphing positions by clicking the green [START] button at the top left. Verify that<br />
the range-finder measures positions correctly, by standing still at a measured distance from it.<br />
Describe the shape of the position-time graph you obtain: ____________________________.<br />
Make sure the detector is measuring correctly before you continue.<br />
The sonic ranger gives the position of the nearest object that makes an echo, so it will give the<br />
position of anyone who crosses the straight-line path between you and the detector. If you are<br />
not in the path of the (focused) sound wave, it might detect the distant wall. Try standing at x<br />
= 2 m, but swinging your arms as if walking. It will not correctly measure objects closer than<br />
½ meter, so don’t make graphs at close distances.<br />
3. Now move away and towards the motion detector at different speeds until you understand<br />
the different shapes of the position-time graphs. Discuss your understanding with your lab<br />
partners until you all agree. How is a slow speed indicated on the location-time graph? Fast<br />
Page 1- 2
Position (m)<br />
Position (m)<br />
Position (m)<br />
Position (m)<br />
Lab 1: Uniform Motion<br />
speed? What does the graph look like when you move toward the detector? Away from it?<br />
Note it is better to use the terms away and towards, rather than forward and backward, since<br />
the latter might be confused with the walker’s orientation as they move. After completing this<br />
activity you should be able to look at a distance-time graph and describe the motion of an<br />
object. You should also be able to look at the motion of an object and sketch a graph<br />
representing that motion. The next step is to give you some practice in doing this.<br />
4. On the axes below, predict the shape of the position-time graphs for each of the described<br />
motions with a broken line. Then check your predictions by moving in the described way and<br />
draw the actual curve with a solid line.<br />
a. Use broken line first predict a distancetime<br />
graph, walking away from the<br />
detector (origin) slowly and steadily.<br />
Now check your prediction and draw it<br />
with a solid line.<br />
b. Use broken line first predict a distancetime<br />
graph, walking away from the<br />
detector (origin) medium fast and steadily.<br />
Now check your prediction and draw it<br />
with a solid line.<br />
Time (s)<br />
c. Use broken line first predict a distancetime<br />
graph, walking toward the detector<br />
(origin) slowly and steadily. Now check<br />
your prediction and draw it with a solid<br />
line.<br />
Time (s)<br />
d. Use broken line first predict a distancetime<br />
graph, walking away from the<br />
detector (origin) starting off medium fast<br />
and slowing down to a stop. Now check<br />
your prediction and draw it with a solid<br />
line.<br />
Time (s)<br />
Time (s)<br />
Question 1-1: What is the difference between the graph made by walking away from the<br />
detector slowly and steadily and the one made walking away quickly and steadily?<br />
Question 1-2: What is the difference between the graph made by walking steadily toward the<br />
motion detector and one made walking steadily away from the motion detector?<br />
Page 1- 3
Lab 1: Uniform Motion<br />
Question 1-3: What is the difference between the graph made by walking away from the<br />
detector at constant speed and one where the person walks away but slows down?<br />
Activity 1-2: Describing and Matching Position-Time Graphs of Your Motion<br />
By now you might be pretty good at predicting the shapes of a position-time graph. But can<br />
you do things the other way around? Can you read a position-time graph, and figure out what<br />
motions would reproduce it? You will describe the desired motion in words, then test your<br />
description by moving that way, to see how well your graph matches the original graph.<br />
Procedure:<br />
1. Open the experiment file L1A1-2a. A position-time graph similar to this will appear.<br />
2. Describe how you would move to produce this graph<br />
3. Now move in front of the motion sensor so as to match the graph on the computer screen.<br />
Each partner should try a turn at this. Teamwork! Get the times right; get the distances right!<br />
Question 1-4: What was the difference in the speed in the differently sloped parts of the<br />
graph, a-b, b-c and c-d?<br />
Question 1-5: What was the difference in the direction in the differently sloped parts of the<br />
graph, b-c and c-d?<br />
Page 1- 4
Lab 1: Uniform Motion<br />
INVESTIGATION 2: MEASURING DISPLACEMENT<br />
The velocity of an object is defined as the rate of change in position. So it is important to<br />
understand how change in position is measured. The change of position is given by the<br />
difference in the final and initial coordinates, or x f - x i , and is called the displacement. You<br />
will see that displacement is a quantity that has both magnitude, or size, and direction. Such<br />
quantities are common in physics, and are called vector quantities. Vector quantities are often<br />
given bold type.<br />
Representing Displacement: Let’s revisit the wolf and the professor - both have undergone<br />
a displacement since we last looked. An arrow drawn from the initial position to the final<br />
position can be used to represent the displacement of each.<br />
x<br />
Motion Detector<br />
x<br />
-6 -5 -4 -3 -2 -1 0 1 2 3 4 5 6<br />
The symbol , Delta, is usually used to denote “change in__”. So the displacements are:<br />
x prof = x f - x i = (4) - (2) = +2m<br />
x wolf = x f - x i = _________________<br />
Because of the choice of positive and negative x values, x f >x i for both the professor and the<br />
wolf, so both displacements are positive. Note that the wolf first moves towards the origin<br />
(motion detector) and then away, but it has a positive velocity throughout! Since the motion<br />
detector detects objects on the positive x-axis only, detector motion away from the detector is<br />
always positive and moving towards is always negative. For an object or person on the<br />
negative x-axis this is not the case. For example the wolf in the above diagram, moves<br />
towards and then away from the origin, but is moving in the positive x direction throughout.<br />
Examine the diagram to confirm this statement. Now figure out how you could move towards<br />
then away from the origin and be moving in the –x direction throughout.<br />
Activity 2-1: Drawing Vector Diagrams<br />
Vector Representation and Vector Diagrams: The change in position of the Prof. can be<br />
illustrated in a vector diagram where “arrows” drawn to scale represent the initial and final<br />
positions, and also the change in position. Adding the change in position vector to the initial<br />
position vector gives the final position vector. Mathematically:<br />
Procedure:<br />
x = x f - x i so x f = x i + x<br />
1. Vector Diagram. Examine the vector representation of the initial. x i , and final position, x f ,<br />
of the professor relative to the origin in the diagram below. Note that vector arrows that<br />
start at the origin are used to represent the initial and final positions in a vector diagram. A<br />
point on the x-axis is not sufficient.<br />
Page 1- 5
Lab 1: Uniform Motion<br />
2. In a vector diagram where there is a change in position, there must also be a displacement<br />
vector arrow x which when added “head–to-tail” to the initial position vector, x i , must<br />
give the final position vector, x f . In the vector diagram above, draw the change in position<br />
vector. It should agree with x drawn in the diagram of the professor on the previous<br />
page.<br />
Does the displacement vector you have drawn above, x, agree with the displacement<br />
vector of the professor drawn in the above diagram of the professor and the wolf?<br />
3. The situation for the displacement of the wolf is a little more complicated, since its initial<br />
position is in the negative direction, but once again x i and x added head-to-tail give x f .<br />
Vector Diagram. Add a displacement vector arrow x to the initial position vector so that<br />
it gives the final position of the wolf.<br />
Does it agree with displacement vector of the wolf drawn in the above diagram of the wolf<br />
chasing the professor?<br />
4. From this it is clear that the direction of the change in position for both the Prof. and the<br />
wolf are both in the positive x direction. For that reason both velocities are positive.<br />
5. What if the motion is in the opposite direction? In the situation shown below, calculate the<br />
displacement of the lady and her dog in the short time since the leash was pulled out of<br />
her hand.<br />
x<br />
x<br />
-6 -5 -4 -3 -2 -1 0 1 2 3 4 5 6<br />
Substitute initial and final positions into the equations below to get x.<br />
x lady = x f - x i = _______________<br />
x dog = x f - x i = _______________<br />
6. You will notice that both displacements in this case are in the negative x direction. Does<br />
this agree with the sign of the displacements calculated above? Explain.<br />
Page 1- 6
Velocity (m/s)<br />
Lab 1: Uniform Motion<br />
7. Draw vector diagrams for the lady to obtain the displacement vector. First draw the initial<br />
and final position vectors, and then draw the displacement vector. Make sure your result<br />
corresponds to the x lady in the diagram above. Do the same for the lady’s dog.<br />
Vector diagram for lady<br />
8.<br />
Origin<br />
Vector diagram for dog<br />
Origin<br />
Measuring Velocity: Velocity is defined as the change in position, or displacement, divided<br />
by the change in time.<br />
Just like the displacement, velocity has magnitude and direction and is a vector quantity.<br />
Thus, when the displacement is positive, x f >x i , the velocity is positive. If x f
Lab 1: Uniform Motion<br />
can walk steadily without the sudden changes of speed that occur as you push off with one<br />
foot and then stop with the other.<br />
3. Check your prediction using the motion detector. Make sure you are already moving<br />
slowly and steadily when you start to record so that you don’t record the motion as you speed<br />
up from a standing start. We will look at that motion later on. Repeat until you get a graph<br />
you're satisfied with. Note that it is difficult to obtain a smooth line since you don’t really<br />
move smoothly when you walk, so ignore the smaller bumps that are mostly due to your<br />
steps. You will get a smoother graph if you shuffle rather than taking big steps.<br />
4. On the same set of axes, predict the velocity-time graph you will get walking in the<br />
positive x direction medium fast and steadily. Check your prediction.<br />
5. On the same set of axes, predict the velocity-time graph you will get walking in the<br />
negative x direction medium fast and steadily. Check your prediction.<br />
Question 2-1: What is the most important difference between the velocity-time graph made<br />
by walking slowly and one made by walking away more quickly?<br />
Question 2-2: How are the velocity-time graphs different for motion in the positive x<br />
direction and the negative x direction?<br />
Question 2-3: Can you tell, from a velocity-time graph, your position when you started<br />
walking and where you were when you stopped walking? Explain.<br />
Activity 2-3: Position-Time and Velocity-Time Graphs of the Same Motion<br />
Prediction: Using a dashed line draw the position-time and velocity-time graphs you would<br />
expect if you were to:<br />
1. walk away from the detector slowly and steadily for about 5 seconds, then<br />
2. stand still for about 5 seconds and then<br />
3. walk toward the detector steadily about twice as fast as before<br />
Once again, assume you can walk steadily without sudden changes of speed as you push<br />
off with one foot and then stop with the other.<br />
Page 1- 8
Lab 1: Uniform Motion<br />
Compare your predictions and see if you can all agree.<br />
Procedure: Open the experiment file L1A2-3 and test your prediction. Draw the best graph<br />
on the axes above using a solid line. Be sure the 5-second stop shows clearly.<br />
Question 2-4: The velocity is the slope of the position-time graph. Explain how this is<br />
demonstrated from your graphs.<br />
Question 2-5: In producing the above velocity-time graph, did it matter where you started i.e.<br />
your initial position? Did you have any difficulty with walking the full 5s after the stop?<br />
Explain.<br />
Measuring the Velocity from the Slope of the Position-Time Graph: As you are now<br />
aware the position-time graph for an object traveling at constant velocity is a straight line.<br />
And, as you have observed, the faster you move, the more inclined is your position-time<br />
graph. The slope of a position-time graph is displacement divided by change in time. It is a<br />
Page 1- 9
Position (X)<br />
Position (X)<br />
Lab 1: Uniform Motion<br />
quantitative measure of this incline, and therefore gives the velocity of the object.<br />
(t2,x2)<br />
(x2- x1)<br />
(t1,x1) v =<br />
(x2 - x1)<br />
(t2 – t1)<br />
Time (t)<br />
(t2 - t1)<br />
Note that if the graph slopes downward, then x 2
Lab 1: Uniform Motion<br />
Results from position-time graph:<br />
Use the Smart Cursor button, , to read the position and time coordinates on the graph for<br />
two typical points while you were moving. You will have to drag the cursor to the point that<br />
you want to measure. For the better accuracy, use two points on the line that are far apart but<br />
still typical of the motion. These need not be the same points used in measuring the velocity<br />
directly with a stopwatch, and t 1 ≠ 0s since t =0 when you start recording data with the motion<br />
sensor. Don’t forget to put in units!<br />
Measurement<br />
Position 1 x 1 =<br />
Position 2 x 2 =<br />
Data and results<br />
Displacement x =(x 2 - x i ) =<br />
Time 1 t 1 =<br />
Time 2 t 2 =<br />
Time interval t = (t 2 - t i ) =<br />
Velocity x / t =<br />
Question 2-6: Was your displacement positive or negative? Why? Was the velocity positive<br />
or negative? Is this what you expected from the direction of your motion? Why?<br />
Question 2-7: Does the velocity you calculated from the position-time graph agree exactly<br />
with the velocity you calculated directly using the stopwatch? Do you expect them to agree<br />
exactly? Why? How would you account for any differences?<br />
Page 1- 11
Lab 1: Uniform Motion<br />
Vector Representation of Velocity: Velocity implies both speed and direction. How fast<br />
you move is your speed. The rate of change of position with respect to time is velocity which<br />
may or may not have the same numerical value as speed. As you have seen, for motion along<br />
a line (e.g., the x axis) the sign (+ or -) of the velocity indicates the direction. If you move in<br />
the positive x direction your displacement and therefore your velocity is positive. The faster<br />
you move in the positive x direction, the larger positive number. If you move in the negative x<br />
direction your displacement and therefore your velocity is negative. The faster you move in<br />
the negative x direction, the "larger" the negative number.<br />
These two ideas of direction and speed can be combined and represented by vectors. An<br />
arrow pointing in the direction of motion represents a velocity vector. A single “tick” is used<br />
to distinguish it from the displacement vector. The velocity vector is usually drawn above the<br />
object, and the length of the arrows are drawn in proportional to the velocity at that instant, so<br />
the greater the velocity the longer the arrow. This can be illustrated for the case of the Wolf<br />
and the Prof. The wolf moves three times farther than the Prof. in the same time, so has it<br />
three times the velocity.<br />
x<br />
x<br />
-6 -5 -4 -3 -2 -1 0 1 2 3 4 5 6<br />
Draw the velocity vectors for the lady and her rapidly disappearing dog. You have already<br />
calculated the displacement in the same time interval, so you know the relative speeds of the<br />
dog and the lady. The length of the vectors should be approximately in the same ratio as those<br />
speeds.<br />
x<br />
x<br />
-6 -5 -4 -3 -2 -1 0 1 2 3 4 5 6<br />
Page 1- 12
Lab 1: Uniform Motion<br />
Conclusion:<br />
(Approximately 1 page in length. Use Separate sheet of paper.)<br />
Questions:<br />
1. In the space provided, describe how you would move to create the following<br />
position-time graphs. To distinguish between different shapes and slopes, you<br />
must use the terms moving steadily when the speed is constant and faster or<br />
slower where there are different the speeds in a single graph. Also use towards<br />
or away from the detector. Don’t use backwards or forwards since moving<br />
backwards or forwards while moving away from the detector produces the<br />
same graph.<br />
2. Standing on a bridge above an expressway, you noticed that at 4:30pm a truck is<br />
+350m from the bridge (the origin in your chosen reference frame). At 4:31pm, it is -<br />
250m on the opposite side of the bridge. Calculate the velocity of the truck.<br />
Page 1- 13
Lab 1: Uniform Motion<br />
Now from the origin draw vectors to represent both the initial and final positions and a<br />
vector that gives the displacement vector.<br />
Does the direction of the vector arrow x agree with the sign of the velocity<br />
calculated above? Explain.<br />
3. Use the numerical values on the axes to draw the exact velocity graphs for an<br />
object whose motion produced the position time graphs shown below on the<br />
left. Position is in meters and velocity in meters per second.<br />
Page 1- 14


