(SAV) User Guide 15020619 D - Illumina
(SAV) User Guide 15020619 D - Illumina
(SAV) User Guide 15020619 D - Illumina

You also want an ePaper? Increase the reach of your titles
YUMPU automatically turns print PDFs into web optimized ePapers that Google loves.
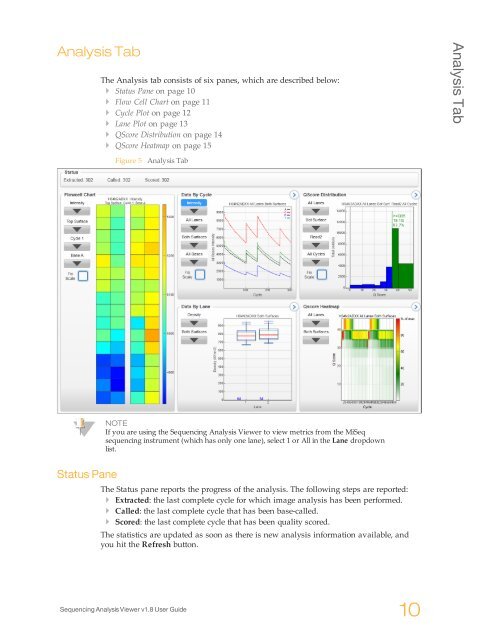
Analysis Tab<br />
The Analysis tab consists of six panes, which are described below:<br />
} Status Pane on page 10<br />
} Flow Cell Chart on page 11<br />
} Cycle Plot on page 12<br />
} Lane Plot on page 13<br />
} QScore Distribution on page 14<br />
} QScore Heatmap on page 15<br />
Analysis Tab<br />
Figure 5 Analysis Tab<br />
NOTE<br />
If you are using the Sequencing Analysis Viewer to view metrics from the MiSeq<br />
sequencing instrument (which has only one lane), select 1 or All in the Lane dropdown<br />
list.<br />
Status Pane<br />
The Status pane reports the progress of the analysis. The following steps are reported:<br />
} Extracted: the last complete cycle for which image analysis has been performed.<br />
} Called: the last complete cycle that has been base-called.<br />
} Scored: the last complete cycle that has been quality scored.<br />
The statistics are updated as soon as there is new analysis information available, and<br />
you hit the Refresh button.<br />
Sequencing Analysis Viewer v1.8 <strong>User</strong> <strong>Guide</strong><br />
10