(SAV) User Guide 15020619 D - Illumina
(SAV) User Guide 15020619 D - Illumina
(SAV) User Guide 15020619 D - Illumina

Create successful ePaper yourself
Turn your PDF publications into a flip-book with our unique Google optimized e-Paper software.
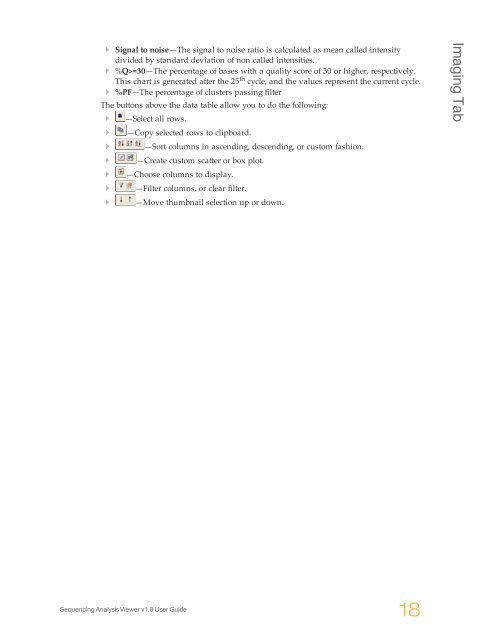
} Signal to noise—The signal to noise ratio is calculated as mean called intensity<br />
divided by standard deviation of non called intensities.<br />
} %Q>=30—The percentage of bases with a quality score of 30 or higher, respectively.<br />
This chart is generated after the 25 th cycle, and the values represent the current cycle.<br />
} %PF—The percentage of clusters passing filter<br />
The buttons above the data table allow you to do the following:<br />
} —Select all rows.<br />
} —Copy selected rows to clipboard.<br />
} —Sort columns in ascending, descending, or custom fashion.<br />
} —Create custom scatter or box plot.<br />
} —Choose columns to display.<br />
} —Filter columns, or clear filter.<br />
} —Move thumbnail selection up or down.<br />
Imaging Tab<br />
Sequencing Analysis Viewer v1.8 <strong>User</strong> <strong>Guide</strong><br />
18