Development and Characterization of ... - Sciensage.info
Development and Characterization of ... - Sciensage.info
Development and Characterization of ... - Sciensage.info

Create successful ePaper yourself
Turn your PDF publications into a flip-book with our unique Google optimized e-Paper software.
Korsmeyer-peppas release model<br />
The release rate data were fitted into the following<br />
equation,<br />
n<br />
Mt/M (Q) K.t …. (15)<br />
where, Mt/M∞ is the fraction <strong>of</strong> drug released, “K” is the<br />
release constant, “t” is the release time, <strong>and</strong> “n” is the diffusion<br />
exponent for the drug released that is dependent on the shape<br />
<strong>of</strong> the matrix dosage form.<br />
When the data are plotted as log <strong>of</strong> drug released versus log<br />
time, it yields a straight line with a slope equal to “n” <strong>and</strong> the<br />
“K” value can be obtained from Y intercept:<br />
n<br />
Q Kt ….. (16)<br />
When n approximates 0.5, a Fickian/diffusion control release<br />
Santhosh Kumar Mankala et al, J Adv Scient Res, 2011; 2(4): 34-45 39<br />
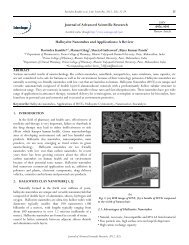
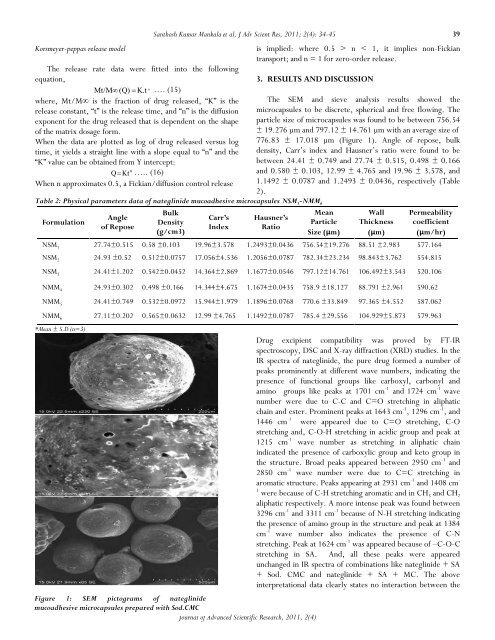
Figure 1: SEM pictograms <strong>of</strong> nateglinide<br />
mucoadhesive microcapsules prepared with Sod.CMC<br />
Journal <strong>of</strong> Advanced Scientific Research, 2011, 2(4)<br />
is implied: where 0.5 > n < 1, it implies non-Fickian<br />
transport; <strong>and</strong> n = 1 for zero-order release.<br />
3. RESULTS AND DISCUSSION<br />
Table 2: Physical parameters data <strong>of</strong> nateglinide mucoadhesive microcapsules NSM 1 -NMM 6<br />
Bulk<br />
Mean<br />
Angle<br />
Carr’s Hausner’s<br />
Formulation<br />
Density<br />
Particle<br />
<strong>of</strong> Repose<br />
Index Ratio<br />
(g/cm3)<br />
Size (μm)<br />
The SEM <strong>and</strong> sieve analysis results showed the<br />
microcapsules to be discrete, spherical <strong>and</strong> free flowing. The<br />
particle size <strong>of</strong> microcapsules was found to be between 756.54<br />
± 19.276 µm <strong>and</strong> 797.12 ± 14.761 µm with an average size <strong>of</strong><br />
776.83 ± 17.018 µm (Figure 1). Angle <strong>of</strong> repose, bulk<br />
density, Carr‟s index <strong>and</strong> Hausner‟s ratio were found to be<br />
between 24.41 ± 0.749 <strong>and</strong> 27.74 ± 0.515, 0.498 ± 0.166<br />
<strong>and</strong> 0.580 ± 0.103, 12.99 ± 4.765 <strong>and</strong> 19.96 ± 3.578, <strong>and</strong><br />
1.1492 ± 0.0787 <strong>and</strong> 1.2493 ± 0.0436, respectively (Table<br />
2).<br />
Wall<br />
Thickness<br />
(μm)<br />
Permeability<br />
coefficient<br />
(μm/hr)<br />
NSM 1 27.74±0.515 0.58 ±0.103 19.96±3.578 1.2493±0.0436 756.54±19.276 88.51 ±2.983 577.164<br />
NSM 2 24.93 ±0.52 0.512±0.0757 17.056±4.536 1.2056±0.0787 782.34±23.234 98.843±3.762 554.815<br />
NSM 3 24.41±1.202 0.542±0.0452 14.364±2.869 1.1677±0.0546 797.12±14.761 106.492±3.543 520.106<br />
NMM 4 24.93±0.302 0.498 ±0.166 14.344±4.675 1.1674±0.0435 758.9 ±18.127 88.791 ±2.961 590.62<br />
NMM 5 24.41±0.749 0.532±0.0972 15.944±1.979 1.1896±0.0768 770.6 ±33.849 97.365 ±4.552 587.062<br />
NMM 6 27.11±0.202 0.565±0.0632 12.99 ±4.765 1.1492±0.0787 785.4 ±29.556 104.929±5.873 579.963<br />
*Mean ± S.D (n=3)<br />
Drug excipient compatibility was proved by FT-IR<br />
spectroscopy, DSC <strong>and</strong> X-ray diffraction (XRD) studies. In the<br />
IR spectra <strong>of</strong> nateglinide, the pure drug formed a number <strong>of</strong><br />
peaks prominently at different wave numbers, indicating the<br />
presence <strong>of</strong> functional groups like carboxyl, carbonyl <strong>and</strong><br />
amino groups like peaks at 1701 cm -1 <strong>and</strong> 1724 cm -1 wave<br />
number were due to C-C <strong>and</strong> C=O stretching in aliphatic<br />
chain <strong>and</strong> ester. Prominent peaks at 1643 cm -1 , 1296 cm -1 , <strong>and</strong><br />
1446 cm -1 were appeared due to C=O stretching, C-O<br />
stretching <strong>and</strong>, C-O-H stretching in acidic group <strong>and</strong> peak at<br />
1215 cm -1 wave number as stretching in aliphatic chain<br />
indicated the presence <strong>of</strong> carboxylic group <strong>and</strong> keto group in<br />
the structure. Broad peaks appeared between 2950 cm -1 <strong>and</strong><br />
2850 cm -1 wave number were due to C=C stretching in<br />
aromatic structure. Peaks appearing at 2931 cm -1 <strong>and</strong> 1408 cm -<br />
1 were because <strong>of</strong> C-H stretching aromatic <strong>and</strong> in CH 3 <strong>and</strong> CH 2<br />
aliphatic respectively. A more intense peak was found between<br />
3296 cm -1 <strong>and</strong> 3311 cm -1 because <strong>of</strong> N-H stretching indicating<br />
the presence <strong>of</strong> amino group in the structure <strong>and</strong> peak at 1384<br />
cm -1 wave number also indicates the presence <strong>of</strong> C-N<br />
stretching. Peak at 1624 cm -1 was appeared because <strong>of</strong> –C-O-C<br />
stretching in SA. And, all these peaks were appeared<br />
unchanged in IR spectra <strong>of</strong> combinations like nateglinide + SA<br />
+ Sod. CMC <strong>and</strong> nateglinide + SA + MC. The above<br />
interpretational data clearly states no interaction between the