Development and Characterization of ... - Sciensage.info
Development and Characterization of ... - Sciensage.info
Development and Characterization of ... - Sciensage.info

You also want an ePaper? Increase the reach of your titles
YUMPU automatically turns print PDFs into web optimized ePapers that Google loves.
Santhosh Kumar Mankala et al, J Adv Scient Res, 2011; 2(4): 34-45 34<br />
Journal <strong>of</strong> Advanced Scientific Research<br />
Available online through http://www.sciensage.<strong>info</strong>/jasr<br />
ISSN<br />
0976-9595<br />
Research Article<br />
<strong>Development</strong> <strong>and</strong> <strong>Characterization</strong> <strong>of</strong> Mucoadhesive Microcapsules <strong>of</strong> Nateglinide: Ionic Orifice<br />
Gelation Technique<br />
Santhosh Kumar Mankala* 1 , Appanna Chowdary Korla 2 , Sammaiah Gade 3<br />
1 Department <strong>of</strong> Pharmaceutics, Vaageswari College <strong>of</strong> Pharmacy, Karimnagar, Andhra Pradesh, India.<br />
2 Department <strong>of</strong> Pharmaceutics, Rol<strong>and</strong> Institute <strong>of</strong> Pharmaceutical Sciences, Khodasingh, Berhampur, Orissa, India.<br />
3 Department <strong>of</strong> Pharmaceutical Chemistry, University College <strong>of</strong> Pharmaceutical Sciences, Kakatiya University, Warangal, Andhra Pradesh, India.<br />
*Corresponding author: inspiration.santosh@gmail.com<br />
ABSTRACT<br />
Type-2 diabetes is a metabolic disorder where the body is unable to automatically regulate blood glucose levels, resulting in<br />
hyperglycemia because the pancreatic β-cell does not produce enough insulin. This produces the classical symptoms <strong>of</strong> Polyuria<br />
(frequent urination), polydipsia (increased thirst) <strong>and</strong> polyphagia (increased hunger). Nateglinide is a meglitinide short-acting nonsulfonylurea,<br />
pancreatic, beta-cell-selective, KATP potassium channel blocker that improves overall glycemic control in type-2<br />
diabetes. Nateglinide binds rapidly to the sulfonylurea SUR 1 receptor with rapid association <strong>and</strong> dissociation gives nateglinide a<br />
unique "fast on-fast <strong>of</strong>f" effect. Nateglinide has short biological half-life <strong>of</strong> 1.5-2.5 h <strong>and</strong> therefore a sustained release medication is<br />
required to get prolonged effect <strong>and</strong> to reduce fluctuations in drug plasma concentration levels. Microencapsulation is an accepted<br />
process used to achieve controlled release <strong>and</strong> drug targeting for many years. Mucoadhesion has been a topic <strong>of</strong> interest in the design<br />
<strong>of</strong> drug delivery systems to prolong its intestinal residence time. Mucoadhesion facilitates the intimate contact <strong>of</strong> the dosage form<br />
with the underlying absorption surface for improved bioavailability <strong>of</strong> drugs. Nateglinide microcapsules were prepared employing<br />
SA (sodium alginate) as the coat material in combination with some mucoadhesive polymers such as (sodium carboxy<br />
methylcellulose) Sod. CMC <strong>and</strong> (methyl cellulose) MC (drug:SA:polymer at ratios 2:2:1, 2:3:1 <strong>and</strong> 2:4:1) following orifice-ionic<br />
gelation technique. Infrared (IR) spectroscopy, differential scanning calorimetry <strong>and</strong> X-ray diffraction studies proved the<br />
compositions were compatible without any interaction between the drug <strong>and</strong> excepients. The prepared microcapsules were<br />
evaluated for various physical <strong>and</strong> release parameters. The resulted microcapsules were found to be discrete <strong>and</strong> spherical in<br />
scanning electron microscopy studies <strong>and</strong> free flowing in rheological studies. The size <strong>of</strong> microcapsules was found to be around<br />
756.54 ± 19.276 µm to 797.12 ± 14.761 µm. The microencapsulation efficiency <strong>and</strong> swelling index was found to be higher in Sod.<br />
CMC than in MC containing formulations. The microcapsules with MC exhibited good mucoadhesive property in the in vitro wash<strong>of</strong>f<br />
test. In vitro drug release studies <strong>of</strong> nateglinide microcapsules were carried out up to 24 h <strong>and</strong> they followed zero-order release<br />
kinetics with Super case II mechanism. The drug release from the microcapsules was sustained over a prolonged period with greater<br />
retardation in drug:SA:Sod.CMC (2:4:1) containing microcapsules <strong>and</strong> this proved to be the best formulation.<br />
Keywords: Nateglinide, controlled release, ionic-orifice gelation, microencapsulation, mucoadhesion.<br />
1. INTRODUCTION<br />
Diabetes is a clinically <strong>and</strong> genetically heterogeneous group<br />
<strong>of</strong> disorders/metabolic disorder affecting the metabolism <strong>of</strong><br />
carbohydrates, lipids, <strong>and</strong> proteins. The characteristic feature<br />
<strong>of</strong> diabetes is an abnormal elevation in blood glucose levels<br />
(Hyperglycemia), is due to a deficiency <strong>of</strong> insulin secretion<br />
caused by pancreatic β-cell dysfunction <strong>and</strong>/or insulin<br />
resistance in liver <strong>and</strong> muscle. Diabetes is a syndrome in which<br />
chronic hyperglycemia leads to long-term damage to various<br />
organs including the heart, eyes, kidneys, nerves, <strong>and</strong> vascular<br />
system. This high blood sugar produces the classical symptoms<br />
<strong>of</strong> Polyuria (frequent urination), polydipsia (increased thirst)<br />
<strong>and</strong> polyphagia (increased hunger). This metabolic<br />
dysregulation is <strong>of</strong>ten associated with alterations in adipocyte<br />
metabolism. The current classification <strong>of</strong> diabetes is based upon<br />
the pathophysiology <strong>of</strong> each form <strong>of</strong> the disease. Type-1<br />
diabetes results from cellular mediated autoimmune<br />
destruction <strong>of</strong> pancreatic b-cells, usually leading to total loss <strong>of</strong><br />
insulin secretion. Type-1 diabetes is usually present in children<br />
<strong>and</strong> adolescents, although some studies demonstrated 15% to<br />
30% <strong>of</strong> all cases being diagnosed after 30 years <strong>of</strong> age. The lack<br />
<strong>of</strong> insulin production in patients with type-1 diabetes makes the<br />
use <strong>of</strong> exogenous insulin necessary to sustain life, hence the<br />
Journal <strong>of</strong> Advanced Scientific Research, 2011, 2(4)
former name „„insulin-dependent diabetes.‟‟ In the absence <strong>of</strong><br />
insulin, these patients develop ketoacidosis, a life-threatening<br />
condition. Type-2 diabetes, previously called non–<br />
insulindependent diabetes, results from insulin resistance,<br />
which alters the use <strong>of</strong> endogenously produced insulin at the<br />
target cells. Type-2 patients have altered insulin production as<br />
well; however, autoimmune destruction <strong>of</strong> b-cells does not<br />
occur as it does in type-1, <strong>and</strong> patients retain the capacity for<br />
some insulin production. Because the type-2 patient still<br />
produces insulin, the incidence <strong>of</strong> ketoacidosis is very low<br />
compared to type-1 as insulin secretion becomes insufficient to<br />
compensate for insulin resistance. Although type-2 patients do<br />
not need insulin treatment to survive, insulin is <strong>of</strong>ten taken as<br />
part <strong>of</strong> the medical management <strong>of</strong> type-2 diabetes [1].<br />
Nateglinide is a metglinide short-acting, pancreatic, betacell-selective,<br />
KATP potassium channel blocker that improves<br />
overall glycemic control in type-2 diabetes. Although<br />
nateglinide's mechanism <strong>of</strong> action is related to that <strong>of</strong><br />
sulphonyl-ureas, important differences do exist. Nateglinide<br />
binds rapidly to the sulfonylurea SUR 1 receptor with a<br />
relatively low affinity, <strong>and</strong> it dissociates from it extremely<br />
rapidly in a manner <strong>of</strong> seconds. This rapid association <strong>and</strong><br />
dissociation gives nateglinide a unique "fast on-fast <strong>of</strong>f" effect.<br />
Thus, nateglinide has a rapid onset <strong>and</strong> short duration <strong>of</strong> action<br />
on beta cells in stimulating insulin secretion in vivo <strong>and</strong><br />
providing good control <strong>of</strong> postpr<strong>and</strong>ial hyperglycemia when<br />
taken immediately prior to meals. This hypoglycemic effect <strong>of</strong><br />
nateglinide leads to improved glycemic control, while the short<br />
duration avoids delayed hyperinsulinemia <strong>and</strong> hypoglycemia<br />
after meals. Nateglinide is not a sulfonylurea, but it shares the<br />
mechanism <strong>of</strong> action <strong>of</strong> commonly used oral hypoglycemic<br />
agents such as glibenclamide <strong>and</strong> glipizide. Like the recently<br />
introduced, short-acting agent, repaglinide, it does not<br />
incorporate a sulfonylurea moiety. Compounds with such a<br />
pr<strong>of</strong>ile should not only achieve improved overall glucose<br />
control, but also reduce the risk <strong>of</strong> vascular complications<br />
which is the most important feature <strong>of</strong> nateglinide. Nateglinide<br />
is both effective <strong>and</strong> well tolerated in the treatment <strong>of</strong> type-2<br />
diabetes. The reported overall pr<strong>of</strong>ile <strong>of</strong> adverse effects appears<br />
to be superior to that <strong>of</strong> other KATP potassium channel<br />
blockers, the glucose modulator metformin <strong>and</strong> PPAR-gamma<br />
agonists such as troglitazone. Clinical comparisons <strong>of</strong> these<br />
agents have shown nateglinide to be more effective in<br />
attenuating postpr<strong>and</strong>ial glucose than any other oral<br />
hypoglycemic agent, <strong>and</strong> that treatment with nateglinide<br />
provides effects that afford improved control <strong>of</strong> plasma glucose<br />
levels. The administration regimen for nateglinide,<br />
immediately prior to meals, also facilitates patient compliance<br />
[2].<br />
Several studies have reported on controlled drug delivery<br />
systems in the form <strong>of</strong> tablets, films, patches, <strong>and</strong> gels for oral,<br />
buccal, nasal, ocular, <strong>and</strong> topical routes. Nateglinide is made<br />
available as many forms in the market like conventional <strong>and</strong><br />
Santhosh Kumar Mankala et al, J Adv Scient Res, 2011; 2(4): 34-45 35<br />
simple sustained release tablets, but microencapsulation is a<br />
technique used to deliver the medicament at controlled rate by<br />
targeting. Microcapsules have more advantages over<br />
conventional <strong>and</strong> simple sustained release tablet formulations,<br />
such as targeting, less dosing frequency, zero-order release <strong>and</strong><br />
high margin <strong>of</strong> safety, which are not possible with the existing<br />
formulations. Amongst the polymers used for<br />
microencapsulation, alginate has gained much attention since it<br />
is non toxic, biodegradable <strong>and</strong> can be prepared by a safe<br />
technique avoiding organic solvents. Hence orifice-ionic<br />
gelation technique was developed as an alternative approach<br />
even though so many other techniques are available like single<br />
<strong>and</strong> double emulsification techniques, normal <strong>and</strong> interfacial<br />
polymerization, coacervation phase separation, spray drying,<br />
spray congealing, etc. [3].<br />
Microcapsules can be defined as solid, approximately<br />
spherical particles made <strong>of</strong> polymeric, waxy or other<br />
protective materials ranging in size from 1 to 1000 μm.<br />
Microencapsulation is a process used to achieve controlled<br />
release <strong>and</strong> drug targeting. Mucoadhesion has been a topic <strong>of</strong><br />
interest in the design <strong>of</strong> drug delivery systems to prolong the<br />
residence time <strong>of</strong> the dosage form in (gastrointestinal tract)<br />
GIT, which facilitates the intimate contact with the absorption<br />
surface to enhance the bioavailability <strong>of</strong> drugs [4].<br />
Mucoadhesion is the process by which a natural or a synthetic<br />
polymer can be adhered to a (biological substrate) mucosal<br />
layer, <strong>and</strong> the phenomenon is known as mucoadhesion. The<br />
substrate possessing mucoadhesive property can help in<br />
devising a delivery system capable <strong>of</strong> delivering a drug for a<br />
prolonged period <strong>of</strong> time at a specific delivery site <strong>and</strong> <strong>of</strong>fers<br />
several advantages over other oral controlled systems by virtue<br />
<strong>of</strong> prolongation <strong>of</strong> residence <strong>of</strong> the drug in GIT. Mucoadhesive<br />
microcapsules provide the needed continuous therapy in the<br />
management <strong>of</strong> type-2 diabetes with high margin <strong>of</strong> safety by<br />
evaluating pre- <strong>and</strong> post-formulation parameters [5-6].<br />
There are numerous drugs for treating type-2 diabetes, The<br />
objective <strong>of</strong> the present work was to develop, characterize<br />
(pre- <strong>and</strong> post-formulation parameters) <strong>and</strong> evaluate<br />
nateglinide mucoadhesive microcapsules by following orificeionic<br />
gelation technique using (Sod. Alginate) SA as the release<br />
rate retarding polymer, with (sodium carboxy methylcellulose)<br />
Sod. CMC <strong>and</strong> (methylcellulose) MC as mucoadhesive<br />
polymers. Sod. CMC,<strong>and</strong> MC are economic <strong>and</strong> easily<br />
available synthetic hydrophilic polymers, <strong>and</strong> these can be<br />
extensively used for designing mucoadhesive delivery systems<br />
due to their ability to exhibit strong hydrogen bonding with the<br />
mucin present in the mucosal layer as compared to thiolated<br />
polymers, lectin-based polymers <strong>and</strong> other natural polymers.<br />
Basically, polymers <strong>of</strong> natural source containing<br />
polysaccharides, carbohydrates <strong>and</strong> cystine are be less stable as<br />
compared to those containing synthetic polymers as these are<br />
highly prone for microbial degradation [7].<br />
Journal <strong>of</strong> Advanced Scientific Research, 2011, 2(4)
2. MATERIALS AND METHODS<br />
Santhosh Kumar Mankala et al, J Adv Scient Res, 2011; 2(4): 34-45 36<br />
Nateglinide pure drug was obtained as a gift sample from<br />
M/s Hetero Drugs Ltd., Hyderabad, (AndhraPradesh, India).<br />
Sod. CMC <strong>and</strong> MC were procured from M/s Central Drug<br />
House (P) Ltd., (New Delhi, India). SA (having a viscosity <strong>of</strong><br />
5.5 cps in a 1% w/v aqueous solution at 25 O C), calcium<br />
chloride <strong>and</strong> petroleum ether were procured from M/s S. D.<br />
Fine Chemicals Pvt. Ltd., Mumbai, (Maharastra, India).<br />
2.1. Preparation <strong>of</strong> Nateglinide Mucoadhesive<br />
Microcapsules<br />
Nateglinide mucoadhesive microcapsules were prepared by<br />
employing SA as the coat material in combination with four<br />
mucoadhesive polymers such as Sod. CMC <strong>and</strong> MC<br />
(drug:SA:polymer at ratios 2:2:1, 2:3:1 <strong>and</strong> 2:4:1) by<br />
following orifice-ionic gelation process. SA (2.0 g, 3.0 g <strong>and</strong><br />
4.0 g) <strong>and</strong> the mucoadhesive polymer (1.0 g) were dissolved in<br />
purified water (25 ml) to form a homogenous polymer solution<br />
to which core material; nateglinide (2.0 g) was added <strong>and</strong><br />
mixed thoroughly to get smooth viscous dispersion (Table 1).<br />
The resulting dispersion was then added drop wisely into 100<br />
ml calcium chloride (10% w/v) solution through a syringe<br />
with a needle <strong>of</strong> No. 22 size. The added droplets were<br />
retained in the calcium chloride solution for 15 min to<br />
complete the curing reaction <strong>and</strong> to produce spherical rigid<br />
microcapsules. The microcapsules were separated by<br />
decantation <strong>and</strong> the product was washed with water <strong>and</strong><br />
petroleum ether <strong>and</strong> dried at 45º C for 12 h. [8-10]. The<br />
stated ratios were fixed as per the results obtained in manual<br />
optimization <strong>of</strong> SA <strong>and</strong> mucoadhesive polymer. When<br />
drug:SA:polymer was less than 2:2:1, the formulation was<br />
found to disintegrate within a short time, <strong>and</strong> when the ratio<br />
was more than 2:4:1, the dosage form weight was increased to<br />
more than 1100 mg, making it difficult to fill in a capsule <strong>and</strong><br />
the release was also retarded for more than 24 h. When the<br />
ratio <strong>of</strong> mucoadhesive polymer was decreased less than the<br />
fixed ratio formulations became non-adhesive, <strong>and</strong> when it was<br />
increased more than the fixed ratio, all the microcapsules<br />
became sticky <strong>and</strong> this also led to drying problem.<br />
Table 1: Composition <strong>of</strong> various batches <strong>of</strong> nateglinide mucoadhesive microcapsules<br />
S.<br />
No<br />
Ingredients<br />
Qty used in formulations (g)<br />
NSM 1 NSM 2 NSM 3 NMM 4 NMM 5 NMM 6<br />
1. Nateglinide 2 2 2 2 2 2<br />
2. Sod.Alginate 2 3 4 2 3 4<br />
3. Sod. CMC 1 1 1 - - -<br />
4. MC - - - 1 1 1<br />
Total Weight 5 6 7 5 6 7<br />
Drug:SA:Polymer 2:2:1 2:3:1 2:4:1 2:2:1 2:3:1 2:4:1<br />
2.2. Evaluation <strong>of</strong> Prepared Microcapsules<br />
2.2.1. Particle size analysis<br />
All the batches prepared were analyzed for particle size<br />
where the microcapsules were placed on a set <strong>of</strong> st<strong>and</strong>ard<br />
sieves ranging from sieve No. 16# to 60#, using an<br />
electromagnetic sieve shaker (Electro Lab, EMS-8). The sieves<br />
were arranged in such a way that they were in a descending<br />
order with the mesh size 16# on the top <strong>and</strong> 60# mesh in the<br />
bottom. The microcapsules passed through the set <strong>of</strong> sieves <strong>and</strong><br />
the amount retained on each sieve was weighed <strong>and</strong> the average<br />
mean diameter was determined <strong>and</strong> considered as mean<br />
particle size [11]:<br />
Mean ParticleSize <strong>of</strong> the Fraction X Weight Fraction<br />
<br />
Weight Fraction<br />
…. (1)<br />
Mean ParticleSize<br />
2.2.2. Bulk density<br />
Accurately weighed microcapsules (M) were transferred<br />
into a 100 ml graduated cylinder to measure the apparent<br />
volumes or bulk volume (V b ). The measuring cylinder was<br />
tapped for a fixed period <strong>of</strong> time <strong>and</strong> tapped volume (V t )<br />
occupied in the cylinder was measured. The bulk density <strong>and</strong><br />
tapped/true density were calculated in gram per milliliter by<br />
the following formula [12]:<br />
Weight <strong>of</strong> Microcapsules(g)(M)<br />
Bulk Density(ρ<br />
b<br />
) ….…. (2)<br />
Bulk Volume(ml)(V<br />
b<br />
)<br />
Weight <strong>of</strong> Microcapsules(g)(M)<br />
True/Tappe dDensity(ρ<br />
t<br />
) .... (3)<br />
Tapped Volume(ml)(V<br />
t<br />
)<br />
Where, M = mass <strong>of</strong> the powder, V b = bulk volume <strong>of</strong> the<br />
powder <strong>and</strong> V t = tapped volume <strong>of</strong> the powder.<br />
Journal <strong>of</strong> Advanced Scientific Research, 2011, 2(4)
2.2.3. Carr’s index <strong>and</strong> Hausner’s ratio<br />
Santhosh Kumar Mankala et al, J Adv Scient Res, 2011; 2(4): 34-45 37<br />
2.2.7. Microencapsulation efficiency<br />
The static angle <strong>of</strong> repose was measured according to the<br />
fixed funnel <strong>and</strong> free st<strong>and</strong>ing cone method. The bulk density<br />
<strong>of</strong> the mixed microcapsules was calculated for determining the<br />
Hausner‟s ratio <strong>and</strong> Carr‟s index from the poured <strong>and</strong> tapped<br />
bulk densities <strong>of</strong> a know weight <strong>of</strong> sample using a measuring<br />
cylinder [13-14]. The following equations were used for the<br />
calculations:<br />
Carr' s Index<br />
Tapped<br />
Density Bulk Density <br />
<br />
100 …. (4)<br />
Tapped Density <br />
ρT<br />
Hausner' s Ratio ...…. (5)<br />
ρB<br />
2.2.4. Angle <strong>of</strong> repose<br />
A funnel was fixed in a st<strong>and</strong> in such a way that the top <strong>of</strong><br />
the funnel was at a height <strong>of</strong> 6 cm from the surface. The<br />
microcapsules were passed from the funnel so that they formed<br />
a pile. The height <strong>and</strong> the radius <strong>of</strong> the heap were measured<br />
<strong>and</strong> the angle <strong>of</strong> repose was calculated using the equation [12,<br />
15].<br />
h<br />
<br />
Tan -1 ………. (6)<br />
θ <br />
r<br />
2.2.5. Scanning Electron Microscopy (SEM)<br />
<br />
<br />
The surface, morphology, microcapsules size,<br />
microcapsules shape, etc., were determined by using Scanning<br />
Electron Microscopy (BIOMETRICS: SEM-CS491Q/790Q).<br />
Dry microcapsules were placed on an electron microscope<br />
brass stub that was coated with gold (thickness 200 nm) in an<br />
ion sputter. Pictures <strong>of</strong> microcapsules were taken by r<strong>and</strong>om<br />
scanning <strong>of</strong> the stub under the reduced pressure (0.001 torr).<br />
2.2.6. % Drug content evaluation<br />
Nateglinide content in the microcapsules was estimated by<br />
UV-spectrophotometric method at a wavelength <strong>of</strong> 227 nm in<br />
phosphate buffer <strong>of</strong> pH 7.4, with 10% methanol (Elico, SL-<br />
158). The method obeyed Beer‟s law in the concentration<br />
range 10-50 g/ml. Microcapsules containing equivalent to<br />
100 mg <strong>of</strong> nateglinide were crushed as fine powder, extracted<br />
with 10 ml <strong>of</strong> methanol, <strong>and</strong> made up to 100 ml with pH 7.4<br />
phosphate buffer. One milliliter <strong>of</strong> the sample solution was<br />
taken <strong>and</strong> made up to the volume to 10 ml with phosphate<br />
buffer pH 7.4, <strong>and</strong> the absorbance was measured at wavelength<br />
227 nm. The procedure was repeated with pure nateglinide.<br />
The absorbance values from the pure drug nateglinide <strong>and</strong><br />
microcapsules were treated <strong>and</strong> the %drug content was<br />
calculated. The method was validated for linearity, accuracy<br />
<strong>and</strong> precision.<br />
Microencapsulation efficiency was calculated using the<br />
following formula [16]:<br />
Estimated percentage drug content <br />
Microencapsulation efficiency<br />
<br />
100<br />
Theoratical percentage drug content <br />
<br />
<br />
2.2.8. Determination <strong>of</strong> wall thickness<br />
…. (7)<br />
Wall thickness <strong>of</strong> microcapsules was determined by using<br />
the equation [17]:<br />
Γ(1<br />
P)d1<br />
h …. (8)<br />
3(Pd2<br />
1<br />
P)d1<br />
Where, h = wall thickness, Г = arithmetic mean radius <strong>of</strong><br />
microcapsules, d 1 <strong>and</strong> d 2 are densities <strong>of</strong> core <strong>and</strong> coat material<br />
respectively, <strong>and</strong> P is the proportion <strong>of</strong> medicament in<br />
microcapsules. All the experimental units were studied in<br />
triplicate (n = 3).<br />
2.2.9. Swelling index<br />
Pre-weighed nateglinide microcapsules (W 0 ) formulated<br />
with mucoadhesive polymers by employing different coat: core<br />
ratios were placed in pH 7.4 phosphate buffer maintained at<br />
37ºC. After the 3 rd hour, the microcapsules were collected <strong>and</strong><br />
blotted to remove excess water <strong>and</strong> weighed (W t ). The<br />
swelling index was calculated with the following formulae [18]:<br />
Wt<br />
- W0<br />
Swelling Index 100<br />
…. (9)<br />
W0<br />
where W t = weight <strong>of</strong> microcapsules observed at the 3 rd h <strong>and</strong><br />
W 0 = the initial weight <strong>of</strong> microcapsules.<br />
2.2.10. Permeability studies<br />
The permeability constant P m <strong>of</strong> the microcapsules was<br />
calculated using the equation [19]:<br />
K VH<br />
Pm<br />
…. (10)<br />
AC<br />
s<br />
Where, V is the volume <strong>of</strong> the dissolution medium (cm 3 ), H<br />
the wall thickness <strong>of</strong> the microcapsules (mm), A the surface<br />
area <strong>of</strong> the microcapsules (cm 2 ), C s the solubility <strong>of</strong> the core<br />
material (mg) in the dissolution medium <strong>and</strong> K is the release<br />
rate constant (mg/h -1 or h -1 ).<br />
For a given microcapsule <strong>and</strong> under st<strong>and</strong>ard testing<br />
conditions the values <strong>of</strong> V, A <strong>and</strong> C s remains constant <strong>and</strong><br />
hence the equation can be written as:<br />
P m<br />
KH<br />
…. (11)<br />
where K is the release rate constant <strong>and</strong> H is the wall thickness<br />
<strong>of</strong> the microcapsule.<br />
Journal <strong>of</strong> Advanced Scientific Research, 2011, 2(4)
2.2.11. Fourier Transform Infrared studies<br />
Fourier Transform Infrared (FT-IR) analysis measurements<br />
<strong>of</strong> pure drug, carrier <strong>and</strong> drug-loaded microcapsules<br />
formulations were obtained using a Perkin-Elmer system<br />
200FT-IR spectrophotometer. The pellets were prepared on<br />
KBr-press under a hydraulic pressure <strong>of</strong> 150 kg/cm 2 ; the<br />
spectra were scanned over the wave number range <strong>of</strong> 4000-<br />
400 cm -1 at the ambient temperature.<br />
2.2.12. Differential scanning calorimetry (DSC)<br />
Differential scanning calorimetry (DSC) was performed on<br />
nateglinide drug loaded microcapsules using Seiko (Japan) DSC<br />
model 220C. Samples were sealed in aluminum pans <strong>and</strong> the<br />
DSC thermograms were reported at a heating rate <strong>of</strong><br />
10°C/min from 20 to 260°C.<br />
2.2.13. X-ray diffraction studies<br />
Different samples were evaluated by X-ray powder<br />
diffraction. Diffraction patterns were obtained using X-ray<br />
diffractometer with a radius <strong>of</strong> 240 mm. The Cu Ka radiation<br />
was Ni filtered. A system <strong>of</strong> diverging <strong>and</strong> receiving slits <strong>of</strong> 1<br />
<strong>and</strong> 0.1mm respectively was used. The pattern was collected<br />
with 40 kV <strong>of</strong> tube voltage <strong>and</strong> 30 mA <strong>of</strong> tube current <strong>and</strong><br />
scanned over the 2Ѳ range <strong>of</strong> 10 0 -80 0 .<br />
2.2.14. In vitro wash-<strong>of</strong>f test for mucoadhesive microcapsules<br />
The mucoadhesive property <strong>of</strong> the microcapsules was<br />
evaluated by an in vitro adhesion testing method known as<br />
wash-<strong>of</strong>f method. A piece <strong>of</strong> goat intestinal mucus (2 × 2 cm)<br />
was mounted onto glass slides <strong>of</strong> (3 × 1 inch) with elastic<br />
b<strong>and</strong>s. Glass slide was connected with a suitable support.<br />
About 50 microcapsules were spread onto each wet tissue<br />
specimen, <strong>and</strong> thereafter the support was hung onto the arm <strong>of</strong><br />
a USP tablet disintegrating test machine (Electro Lab, ED<br />
2AL). The disintegration machine containing tissue specimen<br />
was adjusted for a slow, regular up <strong>and</strong> down moment in a test<br />
fluid at 37 o C taken in a beaker. At the end <strong>of</strong> 1 h <strong>and</strong> later at<br />
hourly intervals up to 8 hours, the machine was stopped <strong>and</strong><br />
the number <strong>of</strong> microcapsules still adhering onto the tissue was<br />
counted. The test was performed in phosphate buffer <strong>of</strong> pH 6.8<br />
[20].<br />
Santhosh Kumar Mankala et al, J Adv Scient Res, 2011; 2(4): 34-45 38<br />
tied in a muslin bag <strong>and</strong> kept in the basket. Five milliliter<br />
samples <strong>of</strong> the dissolution fluid were withdrawn at regular<br />
intervals <strong>and</strong> replaced with fresh quantity <strong>of</strong> dissolution fluid.<br />
The samples were filtered, diluted <strong>and</strong> analyzed, using Elico,<br />
SL-158 Double-beam UV-Visible Spectrophotometer at<br />
wavelength 221 <strong>and</strong> 227 nm respectively. For all the<br />
formulations, the dissolution was carried out in triplicates <strong>and</strong><br />
statistically analyzed using InStat3®. The obtained data were<br />
used to calculate the % drug release <strong>and</strong> to determine the<br />
order <strong>and</strong> mechanism <strong>of</strong> the release [21]. The formulation that<br />
showed best release was prepared 6 times <strong>and</strong> 3 samples from<br />
each batch were evaluated for drug release <strong>and</strong> the results were<br />
statistically analyzed by analysis <strong>of</strong> variance (one factor<br />
ANOVA) [22].<br />
2.2.16. Curve fitting analysis [23-26]<br />
Zero-order release rate kinetics<br />
To study the zero–order release kinetics, the release rate<br />
data are fitted to the following equation:<br />
Q<br />
0<br />
K t …. (12)<br />
where “Q” is the fraction <strong>of</strong> drug released, “K” the release rate<br />
constant <strong>and</strong> “t” is the release time.<br />
First-order kinetics<br />
A first-order release would be predicated by the following<br />
equation:<br />
Kt<br />
LogC LogCo …. (13)<br />
2.303<br />
where; C = amount <strong>of</strong> drug remaining at time “t”, Co = initial<br />
amount <strong>of</strong> the drug <strong>and</strong> K = first-order rate constant (h -1 )<br />
When the data are plotted as cumulative percent drug<br />
remaining versus time, it yields a straight line, indicating that<br />
the release follows first-order kinetics. The constant “K” can be<br />
obtained by multiplying 2.303 with slope.<br />
Higuchi release model<br />
To study the Higuchi release kinetics, the release rate data<br />
were fitted to the following equation:<br />
1/2<br />
Q K.t …. (14)<br />
2.2.15. In vitro drug release studies <strong>of</strong> microcapsules<br />
In vitro drug release studies <strong>of</strong> microcapsules were carried<br />
out using USP XXIII Eight station dissolution rate test<br />
apparatus Type I with a basket stirrer (Electro Lab, EDT 08<br />
LX) at 100 rpm in 900 ml 0.1 N HCl for the 1 st 2 h, then in<br />
phosphate buffer <strong>of</strong> pH 7.4 at 50 rpm <strong>and</strong> temperature 37 +<br />
0.5 o C. Microcapsules equivalent to 100 mg <strong>of</strong> nateglinide were<br />
where, “Q” is the amount <strong>of</strong> drug released, “K” the release rate<br />
constant, <strong>and</strong> “t” is the release time.<br />
When the data are plotted as accumulative drug released versus<br />
square root <strong>of</strong> time, it yields a straight line, indicating that the<br />
drug was released by diffusion mechanism. The slope is equal<br />
to “K”.<br />
Journal <strong>of</strong> Advanced Scientific Research, 2011, 2(4)
Korsmeyer-peppas release model<br />
The release rate data were fitted into the following<br />
equation,<br />
n<br />
Mt/M (Q) K.t …. (15)<br />
where, Mt/M∞ is the fraction <strong>of</strong> drug released, “K” is the<br />
release constant, “t” is the release time, <strong>and</strong> “n” is the diffusion<br />
exponent for the drug released that is dependent on the shape<br />
<strong>of</strong> the matrix dosage form.<br />
When the data are plotted as log <strong>of</strong> drug released versus log<br />
time, it yields a straight line with a slope equal to “n” <strong>and</strong> the<br />
“K” value can be obtained from Y intercept:<br />
n<br />
Q Kt ….. (16)<br />
When n approximates 0.5, a Fickian/diffusion control release<br />
Santhosh Kumar Mankala et al, J Adv Scient Res, 2011; 2(4): 34-45 39<br />
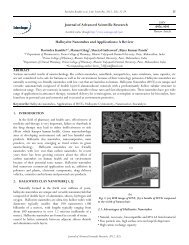
Figure 1: SEM pictograms <strong>of</strong> nateglinide<br />
mucoadhesive microcapsules prepared with Sod.CMC<br />
Journal <strong>of</strong> Advanced Scientific Research, 2011, 2(4)<br />
is implied: where 0.5 > n < 1, it implies non-Fickian<br />
transport; <strong>and</strong> n = 1 for zero-order release.<br />
3. RESULTS AND DISCUSSION<br />
Table 2: Physical parameters data <strong>of</strong> nateglinide mucoadhesive microcapsules NSM 1 -NMM 6<br />
Bulk<br />
Mean<br />
Angle<br />
Carr’s Hausner’s<br />
Formulation<br />
Density<br />
Particle<br />
<strong>of</strong> Repose<br />
Index Ratio<br />
(g/cm3)<br />
Size (μm)<br />
The SEM <strong>and</strong> sieve analysis results showed the<br />
microcapsules to be discrete, spherical <strong>and</strong> free flowing. The<br />
particle size <strong>of</strong> microcapsules was found to be between 756.54<br />
± 19.276 µm <strong>and</strong> 797.12 ± 14.761 µm with an average size <strong>of</strong><br />
776.83 ± 17.018 µm (Figure 1). Angle <strong>of</strong> repose, bulk<br />
density, Carr‟s index <strong>and</strong> Hausner‟s ratio were found to be<br />
between 24.41 ± 0.749 <strong>and</strong> 27.74 ± 0.515, 0.498 ± 0.166<br />
<strong>and</strong> 0.580 ± 0.103, 12.99 ± 4.765 <strong>and</strong> 19.96 ± 3.578, <strong>and</strong><br />
1.1492 ± 0.0787 <strong>and</strong> 1.2493 ± 0.0436, respectively (Table<br />
2).<br />
Wall<br />
Thickness<br />
(μm)<br />
Permeability<br />
coefficient<br />
(μm/hr)<br />
NSM 1 27.74±0.515 0.58 ±0.103 19.96±3.578 1.2493±0.0436 756.54±19.276 88.51 ±2.983 577.164<br />
NSM 2 24.93 ±0.52 0.512±0.0757 17.056±4.536 1.2056±0.0787 782.34±23.234 98.843±3.762 554.815<br />
NSM 3 24.41±1.202 0.542±0.0452 14.364±2.869 1.1677±0.0546 797.12±14.761 106.492±3.543 520.106<br />
NMM 4 24.93±0.302 0.498 ±0.166 14.344±4.675 1.1674±0.0435 758.9 ±18.127 88.791 ±2.961 590.62<br />
NMM 5 24.41±0.749 0.532±0.0972 15.944±1.979 1.1896±0.0768 770.6 ±33.849 97.365 ±4.552 587.062<br />
NMM 6 27.11±0.202 0.565±0.0632 12.99 ±4.765 1.1492±0.0787 785.4 ±29.556 104.929±5.873 579.963<br />
*Mean ± S.D (n=3)<br />
Drug excipient compatibility was proved by FT-IR<br />
spectroscopy, DSC <strong>and</strong> X-ray diffraction (XRD) studies. In the<br />
IR spectra <strong>of</strong> nateglinide, the pure drug formed a number <strong>of</strong><br />
peaks prominently at different wave numbers, indicating the<br />
presence <strong>of</strong> functional groups like carboxyl, carbonyl <strong>and</strong><br />
amino groups like peaks at 1701 cm -1 <strong>and</strong> 1724 cm -1 wave<br />
number were due to C-C <strong>and</strong> C=O stretching in aliphatic<br />
chain <strong>and</strong> ester. Prominent peaks at 1643 cm -1 , 1296 cm -1 , <strong>and</strong><br />
1446 cm -1 were appeared due to C=O stretching, C-O<br />
stretching <strong>and</strong>, C-O-H stretching in acidic group <strong>and</strong> peak at<br />
1215 cm -1 wave number as stretching in aliphatic chain<br />
indicated the presence <strong>of</strong> carboxylic group <strong>and</strong> keto group in<br />
the structure. Broad peaks appeared between 2950 cm -1 <strong>and</strong><br />
2850 cm -1 wave number were due to C=C stretching in<br />
aromatic structure. Peaks appearing at 2931 cm -1 <strong>and</strong> 1408 cm -<br />
1 were because <strong>of</strong> C-H stretching aromatic <strong>and</strong> in CH 3 <strong>and</strong> CH 2<br />
aliphatic respectively. A more intense peak was found between<br />
3296 cm -1 <strong>and</strong> 3311 cm -1 because <strong>of</strong> N-H stretching indicating<br />
the presence <strong>of</strong> amino group in the structure <strong>and</strong> peak at 1384<br />
cm -1 wave number also indicates the presence <strong>of</strong> C-N<br />
stretching. Peak at 1624 cm -1 was appeared because <strong>of</strong> –C-O-C<br />
stretching in SA. And, all these peaks were appeared<br />
unchanged in IR spectra <strong>of</strong> combinations like nateglinide + SA<br />
+ Sod. CMC <strong>and</strong> nateglinide + SA + MC. The above<br />
interpretational data clearly states no interaction between the
Santhosh Kumar Mankala et al, J Adv Scient Res, 2011; 2(4): 34-45 40<br />
pure drug nateglinide <strong>and</strong> other excepients. Therefore, it can be said that the drug <strong>and</strong> excipients are compatible (Figure 2).<br />
Figure 2: FT-IR spectra <strong>of</strong> nateglinide pure drug, nateglinide+SA+Sod.CMC <strong>and</strong> nateglinide+SA+MC.<br />
The melting point <strong>of</strong> pure nateglinide was found to be 135.78<br />
o C <strong>and</strong> followed endothermic type <strong>of</strong> reaction for which the<br />
onset was at 126.30 o C <strong>and</strong> ended at 138.85 o C. The glass<br />
transition lag was found around 12.50 o C <strong>and</strong> the same<br />
endothermic type <strong>of</strong> reactions was found in all combinations<br />
like nateglinide + SA + Sod. CMC <strong>and</strong> nateglinide + SA +<br />
Journal <strong>of</strong> Advanced Scientific Research, 2011, 2(4)
MC. No change was found in the melting point as well as glass<br />
transition lag, but special peaks were found indicating melting<br />
point <strong>of</strong> SA as 219.93 o C, Sod. CMC as 109.71 o C <strong>and</strong> MC as<br />
101.97 o C, <strong>and</strong> the influence <strong>of</strong> excepients was found to be only<br />
in changing on‟s <strong>and</strong> end‟s sets <strong>of</strong> melting point peaks <strong>of</strong><br />
nateglinide by absorbing heat but not by interactions. The<br />
above interpretational data clearly indicate that the crystalline<br />
nature <strong>of</strong> the drug had not been changed <strong>and</strong> it did not undergo<br />
any polymorphism because there was no interaction, which has<br />
been proved by its unchanged melting point in all the<br />
combinational spectra. X-ray diffractogram <strong>of</strong> nateglinide<br />
proves its crystalline nature as evidenced from the number <strong>of</strong><br />
sharp <strong>and</strong> intense peaks. The diffractogram <strong>of</strong> nateglinide with<br />
polymers showed diffused peaks indicating amorphous nature<br />
<strong>of</strong> the polymers <strong>and</strong> sharp, incense peaks indicating the<br />
crystalline nature <strong>of</strong> drug. Diffraction pattern <strong>of</strong> drug with<br />
polymer mixture showed simply the sum <strong>of</strong> the characteristic<br />
peaks <strong>of</strong> polymer indicating the presence <strong>of</strong> drug in crystalline<br />
form. Diffraction patterns <strong>of</strong> sample spectra represent the<br />
availability <strong>of</strong> crystalline peaks <strong>of</strong> drug situated at 12.83,<br />
16.55, 20.01, 21.45, 25.76 <strong>and</strong> 38.21 (2θ) similar to the pure<br />
drug with corresponding intensities <strong>and</strong> linear counts<br />
respectively. The obtained 2θ values as characteristic peaks<br />
were found at the same position in combinations like<br />
nateglinide + SA + Sod. CMC <strong>and</strong> nateglinide + SA + MC,<br />
but the intensities got reduced because <strong>of</strong> diffused peaks <strong>and</strong><br />
more orientation in case <strong>of</strong> polymers. The reduction in<br />
intensities or linear counts <strong>of</strong> peaks in combinations was<br />
possibly due to decrease in the degree <strong>of</strong> crystallinity <strong>of</strong> the<br />
drug that might have occurred when the drug is well dispersed<br />
in the SA + polymer matrix. Finally the DSC <strong>and</strong> XRD data<br />
indicate that the crystallinity <strong>of</strong> pure drug was unchanged <strong>and</strong><br />
stable, <strong>and</strong> indirectly show that the compositions are<br />
compatible. (Figures 3 <strong>and</strong> 4).<br />
Santhosh Kumar Mankala et al, J Adv Scient Res, 2011; 2(4): 34-45 41<br />
Figure 3: DSC spectra <strong>of</strong> nateglinide pure drug,<br />
nateglinide+SA+Sod.CMC <strong>and</strong> nateglinide+SA+MC<br />
The microencapsulation efficiency was from 80.892 ±<br />
7.275 to 93.878 ± 4.356% with practical % drug content<br />
values around 22.65 ± 3.165 to 36.55 ± 2.254% (Table 3).<br />
Wall thickness <strong>and</strong> permeability coefficient were found around<br />
88.51 ± 2.983 to 106.492 ± 3.543 μm <strong>and</strong> 520.106 to 590.62<br />
μg/h, respectively. Swelling index was the highest in<br />
formulation NSM 3 around 189.29 ± 13.553% w/w <strong>and</strong> the<br />
least in NMM 4 around 57.89 ± 12.554% w/w (Figure 5). All<br />
microcapsules exhibited good mucoadhesive property in the in<br />
vitro wash-<strong>of</strong>f test (Figure 6) <strong>and</strong> microcapsules with MC<br />
NMM 5 showed better mucoadhesion where 24% <strong>of</strong><br />
microcapsules were found adhered to the mucosal layer after 8<br />
h (Table 4). In the In vitro drug release studies, the highest<br />
release retardation was found to be around 98.7697 ±<br />
2.0964% in formulation NSM 3 up to 22 h whereas the least<br />
retardation was observed to be around 99.6677 ± 3.8762% in<br />
the formulation NMM 4 after 16 h (Figure 7). When that the<br />
best formulation was prepared 6 times (batches) <strong>and</strong>, three<br />
Journal <strong>of</strong> Advanced Scientific Research, 2011, 2(4)
samples from each batch were taken then evaluated for drug<br />
release (n = 3) <strong>and</strong> statistically analyzed by (one factor<br />
ANOVA), the data showed Df 1 (5) <strong>and</strong> Df 2 (30) with an F-value<br />
<strong>of</strong> 1.4714. The obtained F-value found less than f-table value<br />
around 3.68 indicating less difference in between the groups<br />
Santhosh Kumar Mankala et al, J Adv Scient Res, 2011; 2(4): 34-45 42<br />
<strong>and</strong> within the groups. P-value was found to be significant<br />
around 0.2609, proving maximum closeness between the<br />
results. All formulations followed zero-order non-Fickian<br />
release kinetics with Super Case II Transport mechanism<br />
(Table 5).<br />
Figure 4: X-Ray diffraction spectra <strong>of</strong> nateglinide pure drug, nateglinide+SA+Sod.CMC <strong>and</strong> nateglinide+SA+MC<br />
Journal <strong>of</strong> Advanced Scientific Research, 2011, 2(4)
Swelling Index %w/w<br />
% Microcapsules retained after<br />
8th hour<br />
Santhosh Kumar Mankala et al, J Adv Scient Res, 2011; 2(4): 34-45 43<br />
Table 3: Drug content/Encapsulation Efficiency <strong>of</strong> formulations NSM 1 -NMM 6<br />
Formulation<br />
D:SA:P<br />
ratio<br />
Weight<br />
Taken<br />
(mg)<br />
Theoretical<br />
Drug content<br />
(mg)<br />
Practical<br />
Drug Content<br />
(mg)<br />
Encapsulation<br />
Efficiency (%)<br />
NSM 1<br />
2:2:1 100 40 36.55 ±2.254 91.375 ±5.126<br />
NSM 2<br />
2:3:1 100 33.33 30.98 ±1.975 93.878 ±4.356<br />
NSM 3<br />
2:4:1 100 28.57 25.36 ±1.991 90.571 ±4.198<br />
NMM 4<br />
2:2:1 100 40 34.58 ±2.321 86.45 ±6.124<br />
NMM 5<br />
2:3:1 100 33.33 30.24 ±1.012 91.636 ±2.448<br />
NMM 6<br />
2:4:1 100 28.57 22.65 ±3.165 80.892 ±7.275<br />
*Mean ± S.D (n=3)<br />
250<br />
200<br />
150<br />
110.54<br />
Swelling Index data <strong>of</strong> nateglinide mucoadhesive<br />
microcapsules (Formulations NSM1-NMM6)<br />
163.44<br />
189.29<br />
104.3<br />
132.3<br />
30<br />
25<br />
20<br />
15<br />
In vitro mucoadhesive wash <strong>of</strong> test results <strong>of</strong> nateglinide<br />
mucoadhesive microcapsules after 8hours<br />
(Formulations NSM1-NMM6) 24<br />
18<br />
22<br />
20<br />
18<br />
20<br />
100<br />
57.89<br />
10<br />
50<br />
5<br />
0<br />
NSM1 NSM2 NSM3 NMM4 NMM5 NMM6<br />
Formulations<br />
0<br />
NSM1 NSM2 NSM3 NMM4 NMM5 NMM6<br />
Formulation<br />
Figure 5: Swelling Index histogram <strong>of</strong> nateglinide mucoadhesive<br />
microcapsules NSM 1 -NMM 6<br />
All physical parameters were found in the acceptable range.<br />
The microencapsulation efficiency <strong>and</strong> swelling index were<br />
found to be greater with Sod. CMC than in other formulations,<br />
whereas mucoadhesive efficiency was found higher in<br />
formulations with MC. All compositions were found<br />
compatible in IR, DSC <strong>and</strong> XRD studies <strong>and</strong> thus are suitable<br />
for extending the scope <strong>of</strong> work in this research area. The<br />
drug release from the microcapsules was sustained over an<br />
Figure 6: In vitro mucoadhesive wash <strong>of</strong>f test results histogram<br />
<strong>of</strong> nateglinide mucoadhesive microcapsules NSM 1 -NMM 6 after 8<br />
h<br />
extended period <strong>of</strong> time. The study states that release<br />
depended on the core: coat ratio <strong>and</strong> type <strong>of</strong> mucoadhesive<br />
agent, which got retarded as the coat material percentage got<br />
increased. Microcapsules prepared using Sod. CMC showed<br />
better sustained action, <strong>and</strong> formulation containing drug: SA:<br />
Sod. CMC in the ratio 2:4:1 was found to be the best<br />
formulation as it released the maximum drug up to 22 h.<br />
Table 4: In Vitro Wash <strong>of</strong>f Test Data <strong>of</strong> formulations NSM 1 -NSM 6<br />
Formulation<br />
(50<br />
microcapsules)<br />
% <strong>of</strong> microcapsules (±SD) adhering to tissue at (h)<br />
Phosphate buffer, pH 7.4<br />
1 2 4 8<br />
NSM 1 52 ±4.66 44 ±2.66 34 ±2 18 ±3.33<br />
NSM 2 68 ±5.33 56 ±4 44 ±3.33 22 ±2.66<br />
NSM 3 82 ±5 68 ±4.33 58 ±4.66 20 ±1.66<br />
NMM 4 52 ±3.33 44 ±4.33 34 ±2.66 18 ±3<br />
NMM 5 62 ±2.66 56 ±2.66 43 ±3.33 24 ±3.66<br />
NMM 6 76 ±4.66 62 ±4 48 ±2.66 20 ±2.66<br />
*Mean ± S.D (n=3)<br />
Journal <strong>of</strong> Advanced Scientific Research, 2011, 2(4)
% Drug Rleased<br />
Table 5: Release Kinetic Data <strong>of</strong> Formulations NSM 1 -NMM 6<br />
Santhosh Kumar Mankala et al, J Adv Scient Res, 2011; 2(4): 34-45 44<br />
Formulation<br />
Zero Release rate First<br />
Korsmeyer-<br />
Higuchi<br />
Release<br />
Order constant Order<br />
Best Fit Peppas<br />
Mechanism<br />
r 2 K 0 r 2 r 2 r 2 n value<br />
NSM 1 0.9952 6.5209 0.8519 0.9462 Zero order 0.9859 1.086 Super Case II<br />
NSM 2 0.9981 5.6131 0.7844 0.9297 Zero order 0.9871 0.9335 Super Case II<br />
NSM 3 0.9759 4.884 0.8918 0.9611 Zero order 0.9778 1.1674 Super Case II<br />
NMM 4 0.9933 6.6518 0.6893 0.9019 Zero order 0.9941 1.2334 Super Case II<br />
NMM 5 0.9828 6.0295 0.9146 0.9483 Zero order 0.9827 1.1442 Super Case II<br />
NMM 6 0.991 5.5272 0.8374 0.9587 Zero order 0.9916 0.9973 Super Case II<br />
120<br />
100<br />
80<br />
60<br />
40<br />
20<br />
0<br />
In vitro drug release pr<strong>of</strong>ile plots <strong>of</strong> acecl<strong>of</strong>enac mucoadhesive<br />
microcapsules NSM1-NSM3 (Sod. CMC) <strong>and</strong> NMM4-NMM6 (MC)<br />
NSM1 (Sod. CMC)<br />
NSM2 (Sod. CMC)<br />
NSM3 (Sod. CMC)<br />
NMM4 (MC)<br />
NMM5 (MC)<br />
NMM6 (MC)<br />
0 5 10 15 20 25 30<br />
Time (hrs)<br />
Figure 7: In vitro drug release plots <strong>of</strong> nateglinide mucoadhesive<br />
microcapsules NSM 1 -NMM 6<br />
4. CONCLUSION<br />
The mucoadhesive microencapsulation by following orificeionic<br />
gelation technique could be adopted in the laboratory as<br />
well as in the industry, as it is simple <strong>and</strong> reproducible. In<br />
conclusion, MC <strong>and</strong> Sod. CMC microcapsules could be used<br />
for better mucoadhesive action <strong>and</strong> SA could be used for better<br />
sustained action over an extended period <strong>of</strong> time. Release<br />
retardation depends not only on coat material percentage but<br />
also on mucoadhesive polymer selected. However, further in<br />
vivo studies are needed to optimize the drug for sustained<br />
action in human beings for better bioavailability, <strong>and</strong> efficacy,<br />
<strong>and</strong> thus safety.<br />
5. ACKNOWLEDGEMENTS<br />
Authors wish to thank M/s Hetero Drugs Ltd., Hyderabad,<br />
(Andhra Pradesh India) for providing gift sample <strong>of</strong><br />
Nateglinide, <strong>and</strong> authors will be thankful to management <strong>of</strong><br />
Vaageswari College <strong>of</strong> Pharmacy, Karimnagar, (Andhra<br />
Pradesh, India) for supporting us to finish up this study<br />
successfully.<br />
6. REFERENCES<br />
1. Mealey BL, Oates TW. J Periodontal, 2006; 77(8):1289-<br />
1303.<br />
2. Norman P, Rabasseda X. Drugs Today, 2001; 37(6):411-<br />
426.<br />
3. Solmaz D, Reza A, Mohammadreza A <strong>and</strong> Ramin K.<br />
African J Pharm Pharmacology, 2010; 4(6):346-354.<br />
4. Robinson RJ, Lee VH. Controlled Drug Delivery:<br />
Fundamentals <strong>and</strong> Applications. Revised <strong>and</strong> exp<strong>and</strong>ed.<br />
Vol 29; 2nd ed. New York: Marcel Dekker Inc; 2005. p.<br />
9-19.<br />
5. Boddupalli BM, Mohammed ZNK, Ravinder Nath A,<br />
Banji D. J Adv Pharm Tech Res, 2010; 1: 381-387.<br />
6. Pranshu TSK, Sathish MNV. Int J Pharma Bio Sci, 2011;<br />
2(1): 458-467.<br />
7. Carvalho FC, Bruschi ML, Evangelista RC, Gremiao<br />
MPD. Brazilian J Pharm Sci, 2010; 46(1): 1-17.<br />
8. Chowdary KPR, Srinivas L. Indian Drugs, 2000; 37:<br />
400-410.<br />
9. Liu XD, Yu WY, Zhang Y, Xue WM, et al. J<br />
Microencapsulation, 2002; 18: 775-782.<br />
10. Bahadur S, Ch<strong>and</strong>a R, <strong>and</strong> Roy A, Res J Pharm Tech,<br />
2008; 1(2): 100-105.<br />
11. Lachman L, Lieberman HA, Kanig JL. The theory <strong>and</strong><br />
practice <strong>of</strong> industrial pharmacy. 3 rd ed. Bombay:<br />
Varghese Publishing House; 1987. p. 22-28.<br />
12. Puttewar TY, Kshirsagar MD, Chadewar AV, Chikale<br />
RV. J King Saud Uni, 2010; 22: 229-240.<br />
13. Hausner HH. Int J Metall, 1967; 3: 7-13.<br />
14. Carr RL. Chem Eng, 1965; 72: 163-168.<br />
15. Aulton ME. Pharmaceutics: The Science <strong>of</strong> Dosage<br />
Form Design. 3rd ed. New York: Churchill<br />
Livingstone; 1988: p. 605-613.<br />
16. Zinutti C, H<strong>of</strong>fman M. J Microencapsul, 1994; 11(5):<br />
555-563.<br />
17. Si-Nang L, Carlier PF, Delort P, Gazzola J, et al. J<br />
Pharm Sci, 1973; 62(3): 452-455.<br />
18. Ma XJ, Xie YB, Zhou L, Yu XJ, Yuan Q, Li CC, et al.<br />
Chinese J Organ Transplantation, 1995; 16: 156-157.<br />
19. Koida Y, Kobayashi M, Samejima M. Chem Pharma Bull,<br />
1986; 34(8): 3354-3361.<br />
Journal <strong>of</strong> Advanced Scientific Research, 2011, 2(4)
20. Lehr CM, Bowstra JA, Tukker JJ, Junginer HE. J Control<br />
Rel, 1990; 13(1): 51-62.<br />
21. Costa P, Jose-Manuel SL. Eur J Pharma Sci, 2001; 13: 123-<br />
133.<br />
22. Yadav A, Jain DK. J Adv Pharm Tech Res, 2011; 2: 51-55.<br />
23. The Indian Pharmacopoeia, Vol-II, Indian Pharmacopoeia<br />
Santhosh Kumar Mankala et al, J Adv Scient Res, 2011; 2(4): 34-45 45<br />
Commission, Ghaziabad, 2007. p. 740-742.<br />
24. Higuchi T. J Pharm Sci, 1963; 52: 1145-1149.<br />
25. Ritger PL, Peppas NA. J Controlled Rel, 1987; 52: 37-42.<br />
26. Sipemann J, Peppas NA. Adv Drug Del Rev, 2001; (48):139-<br />
157.<br />
Journal <strong>of</strong> Advanced Scientific Research, 2011, 2(4)