Accurate and Reproducible Mitral Valvular Blood Flow Measurement
Accurate and Reproducible Mitral Valvular Blood Flow Measurement
Accurate and Reproducible Mitral Valvular Blood Flow Measurement

You also want an ePaper? Increase the reach of your titles
YUMPU automatically turns print PDFs into web optimized ePapers that Google loves.
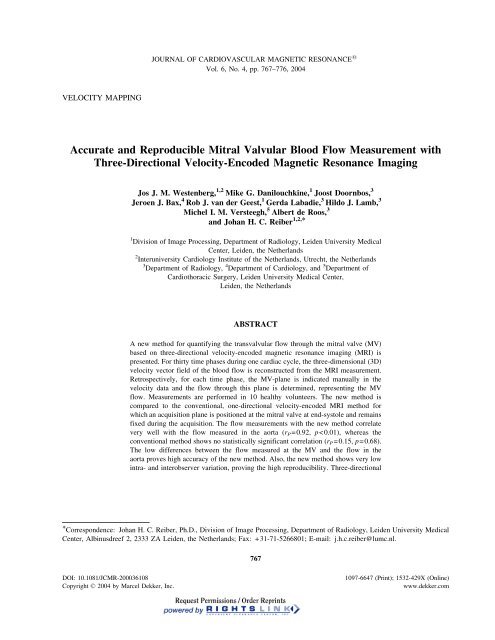
JOURNAL OF CARDIOVASCULAR MAGNETIC RESONANCE 1<br />
Vol. 6, No. 4, pp. 767–776, 2004<br />
VELOCITY MAPPING<br />
<strong>Accurate</strong> <strong>and</strong> <strong>Reproducible</strong> <strong>Mitral</strong> <strong>Valvular</strong> <strong>Blood</strong> <strong>Flow</strong> <strong>Measurement</strong> with<br />
Three-Directional Velocity-Encoded Magnetic Resonance Imaging<br />
Jos J. M. Westenberg, 1,2 Mike G. Danilouchkine, 1 Joost Doornbos, 3<br />
Jeroen J. Bax, 4 Rob J. van der Geest, 1 Gerda Labadie, 3 Hildo J. Lamb, 3<br />
Michel I. M. Versteegh, 5 Albert de Roos, 3<br />
<strong>and</strong> Johan H. C. Reiber 1,2, *<br />
1 Division of Image Processing, Department of Radiology, Leiden University Medical<br />
Center, Leiden, the Netherl<strong>and</strong>s<br />
2 Interuniversity Cardiology Institute of the Netherl<strong>and</strong>s, Utrecht, the Netherl<strong>and</strong>s<br />
3 Department of Radiology, 4 Department of Cardiology, <strong>and</strong> 5 Department of<br />
Cardiothoracic Surgery, Leiden University Medical Center,<br />
Leiden, the Netherl<strong>and</strong>s<br />
ABSTRACT<br />
A new method for quantifying the transvalvular flow through the mitral valve (MV)<br />
based on three-directional velocity-encoded magnetic resonance imaging (MRI) is<br />
presented. For thirty time phases during one cardiac cycle, the three-dimensional (3D)<br />
velocity vector field of the blood flow is reconstructed from the MRI measurement.<br />
Retrospectively, for each time phase, the MV-plane is indicated manually in the<br />
velocity data <strong>and</strong> the flow through this plane is determined, representing the MV<br />
flow. <strong>Measurement</strong>s are performed in 10 healthy volunteers. The new method is<br />
compared to the conventional, one-directional velocity-encoded MRI method for<br />
which an acquisition plane is positioned at the mitral valve at end-systole <strong>and</strong> remains<br />
fixed during the acquisition. The flow measurements with the new method correlate<br />
very well with the flow measured in the aorta (r P =0.92, p
768 Westenberg et al.<br />
velocity-encoded MRI is a patient-friendly <strong>and</strong> easy-to-use method suitable for<br />
quantifying accurately <strong>and</strong> reproducibly the transvalvular MV flow.<br />
Key Words:<br />
processing.<br />
Magnetic resonance imaging; <strong>Mitral</strong> valve; <strong>Flow</strong> quantification; Image<br />
INTRODUCTION<br />
<strong>Accurate</strong> measurement of the transvalvular blood<br />
flow is invaluable for diagnosing patients with valvular<br />
disease. Currently, the assessment of mitral valve (MV)<br />
regurgitation or stenosis is based on echocardiography.<br />
Both two-dimensional transthoracic echocardiography<br />
(TTE) (Ascah et al., 1985; Goldman et al., 1987) as<br />
well as mono- <strong>and</strong> multiplane transesophageal echocardiography<br />
(TEE) with color Doppler (Caldarera et<br />
al., 1995; Helmcke et al., 1987; Shah et al., 1999;<br />
Spain et al., 1989) provide the information needed to<br />
plan surgical strategy (Hellemans et al., 1997; Miyatake<br />
et al., 1986). Quantification of transvalvular flow<br />
velocities based on Doppler measurements has to cope<br />
with two sources of error: the alignment of the<br />
ultrasound beam to the flow direction <strong>and</strong> the fixed<br />
location of the sample volume (Fyrenius et al., 1999;<br />
Sahn, 1988). Besides measurement restrictions, the<br />
interpretation of echo Doppler measurements to physiological<br />
parameters is achieved with the application of<br />
geometrical models, which do not apply to all<br />
individual subjects. <strong>Measurement</strong>s in multiple planes<br />
are necessary, which can yield a summation of errors.<br />
Furthermore, imaging the region of interest in TTE can<br />
be difficult or even impossible because of acoustic<br />
attenuation from structures inside the thorax (lungs,<br />
subcutaneous tissues, <strong>and</strong> ribs) <strong>and</strong> the heart (prosthetic<br />
valve construction materials <strong>and</strong> calcification). TEE is<br />
less limited by attenuation of thoracic structures, but<br />
this technique is semiinvasive <strong>and</strong> patients may experience<br />
discomfort during this investigation.<br />
Magnetic resonance imaging (MRI) is a noninvasive<br />
technique, which is readily applied for the determination<br />
of global <strong>and</strong> regional left ventricular<br />
anatomy <strong>and</strong> function (Van der Geest <strong>and</strong> Reiber,<br />
1999). As a three-dimensional (3D) imaging technique,<br />
volumetric measurements do not rely on the application<br />
of geometrical models. Velocity-encoded cine MRI<br />
provides quantitative information on moving spins <strong>and</strong><br />
can be applied to determine intra–ventricular blood<br />
flow (Mohiaddin, 1995; Van Dijk, 1984; Wigström<br />
et al., 1999). These promising qualities make MRI a<br />
very suitable modality for quantifying transvalvular<br />
blood flow. Previous attempts have all encountered<br />
the motion of the heart during contraction <strong>and</strong> relaxation<br />
as the main obstacle toward direct acquisition<br />
of the transvalvular flow. The mitral annulus moves<br />
12–16 mm toward the apex during contraction<br />
(Komoda et al., 1994).<br />
Kayser et al. (1997) showed that for tricuspid flow<br />
quantification, correction for through-plane motion is<br />
indispensable. This must also be considered for mitral<br />
flow. Their method corrects for through-plane motion of<br />
the right ventricular annulus in a retrospective manner.<br />
Since the acquisition plane has a fixed position during<br />
the complete cardiac cycle, the location of the data<br />
acquisition is not identical to the plane of the MV for the<br />
whole cardiac cycle. This implies that flow quantification<br />
does not represent the true transvalvular flow.<br />
Kozerke et al. (1999) introduced a single-slice acquisition<br />
for transvalvular aortic <strong>and</strong> MV-flow quantification<br />
adapted to the heart motion, the so-called<br />
‘‘STrack’’ technique. With this technique, accurate<br />
positioning of the acquisition plane enables measurement<br />
of the true valvular flow for all phases. Besides the<br />
fact that using this technique requires dedicated scanning<br />
software not widely available on all commercial<br />
MR scanners, this technique uses prospective triggering.<br />
This implies that the final part of the RR-interval will<br />
not be acquired <strong>and</strong> diastolic flow quantification,<br />
especially important at the MV, will not be accurate.<br />
Using velocity-encoded MRI, a new acquisition<br />
method is introduced in this study to obtain the<br />
velocity vector field of the intraventricular blood flow<br />
in three directions during the complete cardiac cycle.<br />
In this velocity vector field, the MV plane is indicated<br />
retrospectively. The velocity values of the vector<br />
components going through the MV plane will be reconstructed.<br />
For the MV area, this will result in an<br />
accurate MV flow measurement.<br />
MATERIAL AND METHODS<br />
MRI Acquisition<br />
Ten volunteers (9 males, 1 female, aged 33–67<br />
years, mean age 54±10 years) were recruited for MR<br />
examination, all without cardiac valvular disease as<br />
confirmed by TTE <strong>and</strong> TEE. The Medical Ethical<br />
Committee of our hospital approved all examinations.<br />
All volunteers gave informed consent. The MRI was<br />
performed on a 1.5 T scanner (ACS-NT15 Gyroscan
<strong>Mitral</strong> <strong>Valvular</strong> <strong>Blood</strong> <strong>Flow</strong> <strong>Measurement</strong> with 3D Velocity-Encoded MRI 769<br />
Figure 1. Planning of the 3-dir MV flow acquisition. A radial stack of 6 acquisition planes, with interslice angulation of 30°, is<br />
placed on the LV. The long axis of the LV, from MV annulus to apex, coincides with the radial axis of the stack. On a short-axis<br />
view (A), a 2-chamber (B), <strong>and</strong> a 4-chamber (C) view, the position of the stack is planned as illustrated.<br />
with the Powertrack 6000 gradient system; Philips<br />
Medical Systems, Best, the Netherl<strong>and</strong>s), using the<br />
body coil for transmission <strong>and</strong> a five-element cardiac<br />
phased-array coil placed on the chest for signal<br />
reception. First, scout images <strong>and</strong> two- <strong>and</strong> fourchamber<br />
acquisitions as well as a complete short-axis<br />
acquisition were performed [conforming to st<strong>and</strong>ard<br />
cardiac MR protocols (Van Rossum et al., 1987), using<br />
balanced-FFE (Steenbeck <strong>and</strong> Pruessmann, 2001)],<br />
needed for planning the velocity-encoded MR scans.<br />
To obtain the velocity vector field of the intraventricular<br />
blood flow, a multislice spoiled gradient-echo (phasecontrast)<br />
sequence with velocity encoding in all three<br />
directions (Pelc et al., 1991) was acquired as follows. A<br />
radial stack of six imaging planes was positioned on the<br />
left ventricle (LV), with an interplane angulation of 30°<br />
<strong>and</strong> the radial axis of the stack going through the MV<br />
annulus <strong>and</strong> the apex (both found in a short-axis view),<br />
coinciding with the long axis of the LV (Fig. 1). In each<br />
consecutive imaging plane, velocity values were<br />
acquired in three directions, with a maximum velocity<br />
sensitivity value of 100 cm/s in each direction. The<br />
reconstructed velocity values in three directions represent<br />
the velocity vector components. Slice thickness of<br />
the imaging planes was 8 mm, field-of-view=370 mm<br />
(60% rectangular), scan matrix=128102, with voxels<br />
of 2.892.898.0 mm. The flip angle a=10°, TR/<br />
TE=5.8/3.5; two signal averages were used to increase<br />
the signal-to-noise ratio. Retrospective cardiac synchronization<br />
was used, 30 phase images were reconstructed<br />
for one cardiac cycle. Typical examination time was 9–<br />
12 mins, depending on the heart rate.<br />
Image Processing<br />
In the modulus images, the myocardial wall is<br />
segmented from the LV blood pool by manual contour<br />
drawing. This is performed for each of the 30 phases <strong>and</strong><br />
each of the 6 slices <strong>and</strong> copied to the velocity-encoded<br />
images, resulting in the velocity vector field of the<br />
intraventricular blood flow. The velocity vectors inside<br />
the LV were constructed from the three components of<br />
the velocity values measured inside these contours.<br />
Also, in the modulus images of each of the phases<br />
<strong>and</strong> each of the slices, the position of the MV was<br />
indicated manually by positioning a line on the valve<br />
leaflets during systole <strong>and</strong> on the annulus during<br />
diastole, perpendicular to the inflow direction. The<br />
center of the MV line was placed on the center of the<br />
annulus (where the radial axis of the six acquisition<br />
planes intersects the MV annulus). For each time phase,<br />
the velocity components perpendicular to each of the six<br />
MV lines were projected onto a single two-dimensional<br />
(2D) plane, representing the MV plane. The center of<br />
each of the six lines is positioned in the center of this<br />
MV plane. Triangular interpolation between the sample<br />
points on the six lines was used to obtain velocities for<br />
the complete 2D MV plane (Fig. 2A).<br />
To obtain the transvalvular velocity of the blood<br />
flow, the velocities measured perpendicularly to the<br />
reconstructed MV plane have to be corrected for the<br />
motion of the myocardium in basal/apical direction.<br />
Information needed to perform this correction was<br />
obtained from the two- <strong>and</strong> four-chamber acquisitions.<br />
On these images, the annulus of the MV was indicated<br />
manually. From the position of the MV annulus at<br />
each phase, the displacement of the valve between the<br />
phases of the cardiac cycle was determined. Its<br />
through-plane velocity was obtained by dividing the<br />
displacement of the annulus over the time step between<br />
the phases (i.e., the temporal resolution of the two- <strong>and</strong><br />
four-chamber acquisitions). This velocity value was<br />
subtracted from the through-plane velocities measured<br />
at the reconstructed plane, resulting in velocity values<br />
with respect to the MV annulus. Finally, the transvalvular<br />
volume flow is obtained after manually<br />
drawing a contour in the reconstructed velocity image<br />
of each phase, containing the transvalvular velocities
770 Westenberg et al.<br />
Figure 2. A moment of early diastole (A). By drawing a region of interest, the velocity through the MV can be determined. The<br />
flow is calculated by integration. The flow graph is obtained by performing flow measurement in all time phases (B).<br />
<strong>and</strong> then integrating these velocities over the area. A<br />
flow graph of the transvalvular flow during one cardiac<br />
cycle can be plotted (Fig. 2B). Finally, the MV-flow<br />
volume can be obtained by calculating the Riemann<br />
sum of the flow graph (i.e., discretized approximation<br />
of calculating the area under the flow graph).<br />
Validation<br />
For each volunteer, the MV-flow volume determined<br />
with the new method described above (from<br />
hereon noted as the ‘‘3-dir MV flow’’) was validated<br />
by comparing it with the flow volume measured with
<strong>Mitral</strong> <strong>Valvular</strong> <strong>Blood</strong> <strong>Flow</strong> <strong>Measurement</strong> with 3D Velocity-Encoded MRI 771<br />
MRI at the ascending aorta [described by Van der<br />
Geest et al., 1998], referred to as the AO-flow volume.<br />
The same MRI acquisition protocol was used as<br />
described above, but now with a single imaging plane<br />
positioned perpendicular to the ascending aorta. Also,<br />
only the velocity values in through-plane direction,<br />
perpendicular to the acquisition plane, were considered.<br />
The aortic flow was determined using the FLOW<br />
software (Medis, Leiden, the Netherl<strong>and</strong>s) (Van der<br />
Geest et al., 1998).<br />
Also, for each volunteer, the 3-dir MV-flow<br />
volume was compared with the conventional throughplane<br />
MR flow volume measurement described by<br />
(Kayser et al., 1997). The same imaging protocol was<br />
used as described above, with the single imaging plane<br />
positioned at the MV during end-systole. Only the<br />
velocity values in through-plane direction were considered.<br />
Again, for measuring the MV flow, the FLOW<br />
software was used, under condition that correction for<br />
through-plane motion was performed (Kayser et al.,<br />
1997). The through-plane velocity of the myocardium<br />
is assessed in a region of interest, drawn inside the<br />
myocardium for each of the phases, by measuring the<br />
mean velocity inside this region of interest. The<br />
velocity of the myocardium in basal/apical direction<br />
was subtracted from the velocity measured at the<br />
opening of the MV. Again, the flow can be determined<br />
by integrating the velocities over an area, indicated by<br />
an observer. The MVflow volume is obtained from the<br />
Riemann sum of the flow graph during one cardiac<br />
cycle. The MV-flow volume measured with this<br />
method, is referred to as the ‘‘1-dir MV-flow volume.’’<br />
Statistical Analysis<br />
Correlations between the AO-flow volume measurement<br />
<strong>and</strong> both the conventional 1-dir MV-flow<br />
volume <strong>and</strong> the new 3-dir MV-flow volume were<br />
tested by calculating the Pearson correlation coefficient,<br />
r P , under the assumption that the parameters<br />
were distributed normally. This assumption was tested<br />
with Kolmogorov–Smirnov tests. The approach described<br />
by Bl<strong>and</strong> <strong>and</strong> Altman (1986) was followed to<br />
study the differences between both MV-flow volume<br />
measurements <strong>and</strong> the AO-flow volume. The mean<br />
differences were determined <strong>and</strong> the statistical significance<br />
of these differences was tested by a pairedsamples<br />
t-test.<br />
The reproducibility of the interpretation of the<br />
velocity images, acquired with the new 3-dir MV-flow<br />
method, was tested by inter- <strong>and</strong> intraobserver studies.<br />
Two observers (JW, MD) analyzed the 3-directional<br />
MR velocity-encoded images to study interobserver<br />
variation; one observer (JW) analyzed the images<br />
twice, with an interanalysis time of more than one<br />
week, to study intraobserver variation. Accuracy <strong>and</strong><br />
reproducibility were investigated by performing paired<br />
samples t-test <strong>and</strong> determining the Pearson correlation<br />
coefficient r P for the repeated measurements.<br />
Clinical Example<br />
The clinical applicability is illustrated by presenting<br />
data of two patients with MV regurgitation<br />
(one female, 35 years; one male, 43 years). Regurgitation<br />
was proven from TEE. The same MR<br />
examination was performed as used for the volunteers.<br />
The MV regurgitation was determined from the 3-dir<br />
MV-flow measurement. The AO-flow volume was<br />
used for comparison.<br />
RESULTS<br />
In ten volunteers without cardiac valvular disease<br />
(confirmed by TTE <strong>and</strong> TEE), the transvalvular MVflow<br />
volume was measured with MRI. This was done<br />
with the conventional 1-directional, through-plane<br />
velocity-encoded MRI (1-dir MV flow), as well as<br />
with the new method, 3-directional velocity-encoded<br />
MRI (3-dir MV flow). Both flow volume measurements<br />
were compared to the flow volume measured<br />
with 1-directional through-plane velocity-encoded MRI<br />
measured at the aorta (AO flow). The results are<br />
presented in Fig. 3. Kolmogorov–Smirnov tests prove<br />
that the data of each of the parameters is distributed<br />
normally ( p=0.84 for 1-dir MV flow, p=0.99 for 3-dir<br />
MV flow, p=0.89 for AO flow). The correlation<br />
between the MV-flow volumes acquired with both<br />
Figure 3. MV-flow volume measurement with the conventional<br />
1-dir MV-flow method <strong>and</strong> the new 3-dir MV flow<br />
method, respectively. The MV-flow is compared with the flow<br />
measured at the aorta.
772 Westenberg et al.<br />
Figure 4. Bl<strong>and</strong>-Altman analysis for studying the differences between the MV-flow volume [determined with the 1-dir MV-flow<br />
method (A) <strong>and</strong> the 3-dir MV-flow method (B), respectively] <strong>and</strong> the AO flow. The 1-dir MV flow shows a statistically significant<br />
overestimation compared to the AO flow. The 3-dir MV flow is not statistically significantly different. The dashed lines represent the<br />
mean differences, the dotted line determines the 95% confidence intervals.<br />
methods <strong>and</strong> the AO-flow volume is tested with<br />
Pearson correlation coefficients. The correlation<br />
between the 1-dir MV-flow volume <strong>and</strong> the AO-flow<br />
volume is not statistically significant (r P =0.15,<br />
p=0.68), whereas the correlation between the 3-dir<br />
MV-flow volume <strong>and</strong> the AO-flow volume is statistically<br />
significant: (r P =0.92, p
<strong>Mitral</strong> <strong>Valvular</strong> <strong>Blood</strong> <strong>Flow</strong> <strong>Measurement</strong> with 3D Velocity-Encoded MRI 773<br />
Clinical Example<br />
Two patients with proven MV-regurgitation (confirmed<br />
on TEE) were investigated with the same MR<br />
examination as was used for the volunteers. In Fig. 5A,<br />
a four-chamber MR image of a female patient (35<br />
years) is shown, representing a systolic phase. The<br />
arrow indicates the regurgitant jet, flowing from the<br />
MV into the left atrium. In Fig. 5B, the reconstructed<br />
velocities through the MV are represented for the same<br />
phase. The area with regurgitant flow is clearly<br />
discriminated. The flow through the MV is measured<br />
for each time phase <strong>and</strong> presented in Fig. 5C. The<br />
regurgitant flow volume (i.e., negative flow value in<br />
the graph during systole) amounts to 9 ml. The<br />
diastolic forward flow volume for this patient amounts<br />
to 86 ml, yielding a regurgitant fraction of 10%.<br />
Comparing the effective forward flow volume through<br />
the MV with the flow volume measured at the aorta<br />
(i.e., 81 ml), good agreement is found for this patient.<br />
A second case (male, 43 years) also shows good<br />
agreement: regurgitant flow volume = 23 ml, diastolic<br />
MV flow volume = 101 ml (regurgitant fraction of<br />
23%) <strong>and</strong> aortic flow volume = 79 ml.<br />
Figure 5. Clinical applicability. A four-chamber MR image of a female patient (35 years), representing a systolic phase (A). The<br />
arrow indicates the regurgitant jet, flowing from the MV into the left atrium. The reconstructed velocities through the MV are<br />
represented for the same phase (B). The area with regurgitant flow is clearly discriminated. The flow through the MV is measured for<br />
each time phase (C).
774 Westenberg et al.<br />
DISCUSSION<br />
Kayser et al. (1997) demonstrated that myocardial<br />
motion correction is m<strong>and</strong>atory for obtaining accurate<br />
transvalvular flow values with single-slice 1-directional<br />
velocity-encoded MRI. The motion of the myocardium<br />
due to the contraction <strong>and</strong> relaxation in the same<br />
direction of the flow through the MV (i.e., the throughplane<br />
motion for 1-dir MV flow) will result in an<br />
offset in the velocities measured at the location of the<br />
MV annulus. By measuring the through-plane velocity<br />
of the myocardium in a region of interest, positioned<br />
inside the myocardial wall <strong>and</strong> subtracting this velocity<br />
from the velocities measured at the MV-annulus,<br />
motion correction is performed. This motion correction<br />
is not sufficient to guarantee that the acquired flow<br />
equals the transvalvular flow, though. The single acquisition<br />
plane is positioned at the location of the MV at<br />
end-systole. Because this plane has a fixed position<br />
<strong>and</strong> is not adapted to the cardiac motion, the acquisition<br />
is performed inside the LV during most part of<br />
the cardiac cycle. In this study, the MV-flow volume<br />
measured conform the method of Kayser et al. (i.e.,<br />
1-dir MV-flow volume) was compared to the flow<br />
volume measured at the aorta. No statistically significant<br />
correlation was found. The 1-dir MV-flow volume<br />
showed a statistically significant overestimation compared<br />
to the AO-flow volume. This illustrates that the<br />
1-dir MV-flow method, although readily applied in<br />
clinical studies (Kroft <strong>and</strong> de Roos, 1999; Rebergen<br />
et al., 1996), is not recommended for accurate transvalvular<br />
MV-flow measurement.<br />
Kozerke et al. (1999) introduced a new acquisition<br />
method for a single-slice flow measurement at the aortic<br />
valve, with the acquisition plane adapted to the heart<br />
motion (STrack). The acquisition plane follows the basal<br />
level during the cardiac cycle, <strong>and</strong> after myocardial<br />
through-plane motion correction, this results in an<br />
accurate transvalvular flow measurement. A disadvantage<br />
of their method is the necessity of prospective<br />
triggering, resulting in an incomplete acquisition of<br />
the cardiac cycle. The final part of the RR-interval<br />
cannot be acquired <strong>and</strong> is ignored. For MV-flow measurement,<br />
acquisition of the complete diastole is m<strong>and</strong>atory.<br />
For regurgitation studies, the complete systole<br />
<strong>and</strong> diastole need to be acquired. When studying transvalvular<br />
MV flow, the use of retrospective gating is<br />
preferred over prospective triggering. Another disadvantage<br />
of the method proposed by Kozerke et al.<br />
(1999) is that the acquisition software is not available<br />
on all commercially available MRI scanners.<br />
In our study, a new method was introduced to<br />
assess the true transvalvular MV-flow. No dedicated<br />
scanning software is required to apply this protocol.<br />
The complete velocity vector field of the blood flow<br />
inside the LV, acquired with 3-directional velocityencoded<br />
MRI using retrospective gating, was obtained<br />
<strong>and</strong> reconstructed to 30 time phases covering one<br />
average complete cardiac cycle. Retrospectively, the<br />
position of the MV in this velocity vector field was<br />
indicated manually for each time phase, <strong>and</strong> from this,<br />
the flow through the MV was acquired. The velocities<br />
in the MV-plane were corrected for the through-plane<br />
motion of the myocardium in the apical-basal direction,<br />
perpendicular to the MV-plane itself. Integrating the<br />
velocities over the area of the MV annulus (indicated<br />
manually) resulted in the MV flow.<br />
Because of time limitations, it is impossible to<br />
acquire the complete transvalvular flow with slices<br />
oriented parallel to the long axis. Therefore, the flow is<br />
acquired with a radial stack of six acquisition planes.<br />
The axis of the radial stack is positioned in the center of<br />
the mitral annulus. This means that in the blood flow in<br />
the center of the mitral annulus will be densely sampled.<br />
In the outer part of the mitral annulus, the flow is not<br />
sampled in all the parts of the mitral annulus. The<br />
acquisition voxels in the plane of the mitral annulus<br />
have dimensions of 2.89 mm8 mm. For a circularshaped<br />
mitral annulus with a 40-mm diameter, 62% of<br />
the area of the annulus will be covered with acquisition<br />
voxels. In reality, the area of the annulus will not be<br />
circular shaped <strong>and</strong> therefore, smaller. The nonsampled<br />
parts of flow through the annulus will be reconstructed<br />
by triangular interpolation.<br />
This method was applied to obtain the MV-flow<br />
volume in 10 healthy volunteers. The 3-dir MV flow<br />
showed very good correlation with the AO flow. The<br />
differences between the flow volumes from both<br />
methods were very small <strong>and</strong> not statistically significant.<br />
When comparing the MV-flow volume to the AO<br />
flow volume, the flow to the coronaries has to be taken<br />
into account. The AO flow was acquired at a level<br />
distal to the branches of the coronaries. This implies<br />
that the AO-flow volume measured at this location will<br />
be smaller than the MV-flow volume. In our study, this<br />
small systematic difference was not detectable. The<br />
contribution of the flow to the coronaries, only 0.5% of<br />
the cardiac output (Mymin <strong>and</strong> Sharma, 1974), was too<br />
low to be detected by this method.<br />
A high reproducibility for flow quantification with<br />
3-dir MV flow was found. The manual interaction during<br />
image analysis was performed twice by one observer<br />
with an interanalysis time >1 week. Excellent correlation<br />
between both analyses was found <strong>and</strong> the differences<br />
between the analyses were small <strong>and</strong> not statistically<br />
significant. The interobserver study showed similar<br />
results, i.e., very high correlation between observers<br />
<strong>and</strong> small, not statistically significant differences.
<strong>Mitral</strong> <strong>Valvular</strong> <strong>Blood</strong> <strong>Flow</strong> <strong>Measurement</strong> with 3D Velocity-Encoded MRI 775<br />
Limitations<br />
The new 3-dir MV-flow method enables accurate <strong>and</strong><br />
reproducible quantification of the true transvalvular MVflow<br />
in a patient-friendly <strong>and</strong> easy-to-use manner. This<br />
method can be applied on most commercially available<br />
MRI scanners. Data of two patients with MV regurgitation<br />
illustrate the clinical applicability of this method.<br />
The acquisition of the radial stack of six imaging planes<br />
takes 9–12 min <strong>and</strong> depends on the patient’s heart rate.<br />
Scout images, st<strong>and</strong>ard two- <strong>and</strong> four-chamber views,<br />
<strong>and</strong> a set of short-axis images are needed to plan the<br />
radial stack of slices. This process takes approximately<br />
15–20 min of examination time. The manual postprocessing<br />
is currently the most laborious <strong>and</strong> needs to be<br />
automated before this method can be introduced in daily<br />
clinical practice. The reconstruction of the velocity vector<br />
field <strong>and</strong> the manual contour drawing, all needed for the<br />
flow analysis, can take up to 1 h per patient. The manual<br />
interaction does not result in large intra-or interobserver<br />
variations. Automating the manual processing (i.e.,<br />
indicating the mitral valve in the long-axis images as<br />
well as the contour drawing in the reconstructed transvalvular<br />
velocity images) will result in a clinically<br />
applicable method.<br />
Another limitation of the technique is the incomplete<br />
data acquisition of the transvalvular flow. The<br />
new 3-dir MV-flow method uses a radial stack of six<br />
acquisition planes, positioned on the LV parallel to the<br />
long axis, with the radial axis of the stack going<br />
through the MV annulus <strong>and</strong> the apex. This results in a<br />
dense sampling in the center of the annulus but sparse<br />
sampling at the edges. The velocities going through the<br />
MV plane are reconstructed from the sampled data <strong>and</strong><br />
triangular interpolation is used for the area where no<br />
sampling has occurred. Because of this sampling<br />
strategy, small eccentric regurgitant jets can be overlooked<br />
when they occur in the region where no<br />
sampling is performed. The sampling strategy used is<br />
a trade-off with available examination time. Also, this<br />
is inherent to the limits of MRI flow quantification. It<br />
is difficult or impossible to quantify small flow jets<br />
with voxels of 2.892.89 mm. The two presented<br />
clinical cases show that it is very possible to quantify<br />
regurgitant MV flow accurately. Future studies investigating<br />
MV regurgitation are needed to give more<br />
insight on the limits of the new method.<br />
ACKNOWLEDGMENTS<br />
We thank Dr. Romhild Hoogeveen from Philips<br />
Medical Systems, Best, the Netherl<strong>and</strong>s, for his help<br />
regarding the MRI sequence.<br />
This research was funded by the Netherl<strong>and</strong>s Heart<br />
Association, grant number 99.099.<br />
REFERENCES<br />
Ascah, K. J., Stewart, W. J., Jiang, L., Guerrero, J. L.,<br />
Newell, J. B., Gillam, L. D., Weyman, A. E.<br />
(1985). A Doppler-two-dimensional echocardiographic<br />
method for quantitation of mitral regurgitation.<br />
Circulation 72:377–383.<br />
Bl<strong>and</strong>, J. M., Altman, D. G. (1986). Statistical methods<br />
for assessing agreement between two methods of<br />
clinical measurement. Lancet 8:307–310.<br />
Caldarera, I., Van Herwerden, L. A., Taams, M. A., Bos,<br />
E., Roel<strong>and</strong>t, J. R. T. C. (1995). Multiplane<br />
transesophageal echocardiography <strong>and</strong> morphology<br />
of regurgitant mitral valves in surgical repair.<br />
Eur. Heart J. 16:999–1006.<br />
Fyrenius, A., Wigström, L., Bolger, A. F., Ebbers, T.,<br />
Ohman, K. P., Karlsson, M., Wranne, B., Engvall,<br />
J. (1999). Pitfalls in Doppler evaluation of<br />
diastolic function: insights from 3-dimensional<br />
magnetic resonance imaging. J. Am. Soc. Echocardiogr.<br />
12:817–826.<br />
Goldman, M. E., Mora, F., Guarino, T., Fuster, V.,<br />
Mindich, B. P. (1987). <strong>Mitral</strong> valvuloplasty is<br />
superior to valve replacement for preservation<br />
of left ventricular function: an intraoperative<br />
two-dimensional echocardiographic study. J. Am.<br />
Coll. Cardiol. 10:568–575.<br />
Hellemans, I. M., Pieper, E. G., Ravelli, A. C. J., Hamer,<br />
J. P. M., Jaarsma, W., Cheriex, E., Peels, C. H.,<br />
Bakker, P. F. A., Tijssen, J. G. P., Visser, C. A.<br />
(1997). Prediction of surgical strategy in mitral<br />
valve regurgitation based on echocardiography.<br />
Am. J. Cardiol. 79:334–338.<br />
Helmcke, F., N<strong>and</strong>a, N. C., Hsiung, M. C., Soto, B.,<br />
Adey, C. K., Goyal, R. G., Gatewood, R. P. J.<br />
(1987). Color Doppler assessment of mitral<br />
regurgitation with orthogonal planes. Circulation<br />
75:175–183.<br />
Kayser, H. W. M., Stoel, B. C., van der Wall, E. E., van<br />
der Geest, R. J., de Roos, A. (1997). MR velocity<br />
mapping of tricuspid flow: correction for throughplane<br />
motion. J. Magn. Reson. Imaging 7:669–<br />
673.<br />
Komoda, T., Hetzer, R., Uyama, C., Siniawski, H.,<br />
Maeta, H., Rosendahl, U. P., Ozaki, K. (1994).<br />
<strong>Mitral</strong> annular function assessed by 3D imaging<br />
for mitral valve surgery. J. Heart Valve Dis.<br />
3:483–490.<br />
Kozerke, S., Scheidegger, M. B., Pedersen, E. M.,<br />
Boesiger, P. (1999). Heart motion adapted cine
776 Westenberg et al.<br />
phase-contrast flow measurements through the<br />
aortic valve. Magn. Reson. Med. 42:970–978.<br />
Kroft, L. J., de Roos, A. (1999). Biventricular diastolic<br />
cardiac function assessed by MR flow imaging<br />
using a single angulation. Acta Radiol. 40:563–<br />
568.<br />
Miyatake, K., Izumi, S., Okamoto, M., Kinoshita, N.,<br />
Asonuma, H., Nakagawa, K., Yamamoto, K.,<br />
Takamiya, M., Sakakibara, H., Nimura, Y.<br />
(1986). Semiquantitative grading of severity of<br />
mitral regurgitation by real-time two-dimensional<br />
Doppler flow imaging technique. J. Am. Coll.<br />
Cardiol. 7:82–88.<br />
Mohiaddin, R. H. (1995). <strong>Flow</strong> patterns in the dilated<br />
ischemic left ventricle studied by MR imaging<br />
with velocity vector mapping. J. Magn. Reson.<br />
Imaging 5:493–498.<br />
Mymin, D., Sharma, G. P. (1974). Total <strong>and</strong> effective<br />
coronary blood flow in coronacy <strong>and</strong> noncoronary<br />
heart disease. J. Clin. Invest. 53:363–373.<br />
Pelc, N. J., Bernstein, M. A., Shimakawa, A., Glover, G.<br />
H. (1991). Encoding strategies for three-direction<br />
phase-contrast MR imaging of flow. J. Magn.<br />
Reson. Imaging 1:405–413.<br />
Rebergen, S. A., Niezen, R. A., Helbing, W. A., van der<br />
Wall, E. E., de Roos, A. (1996). Cine gradientecho<br />
MR imaging <strong>and</strong> MR velocity mapping in<br />
the evaluation of congenital heart disease. Radiographics<br />
16:467–481.<br />
Sahn, D. J. (1988). Instrumentation <strong>and</strong> physical factors<br />
related to visualization of stenotic <strong>and</strong> regurgitant<br />
jets by Doppler color flow mapping. J. Am. Coll.<br />
Cardiol. 12:1354–1365.<br />
Shah, P. M., Raney, A. A., Duran, C. M. G., Oury, J. H.<br />
(1999). Multiplane transesophageal echocardiography:<br />
a roadmap for mitral valve repair. J. Heart<br />
Valve Dis. 8:625–629.<br />
Spain, M. G., Smith, M. D., Grayburn, P. A., Harlamert,<br />
E. A., DeMaria, A. N. (1989). Quantitative assessment<br />
of mitral regurgitation by Doppler color flow<br />
imaging—angiographic <strong>and</strong> hemodynamic correlations.<br />
J. Am. Coll. Cardiol. 13:585–590.<br />
Steenbeck, J., Pruessmann, K. (2001). Technical developments<br />
in cardiac MRI: 2000 update. Rays<br />
26:15–34.<br />
Van der Geest, R. J., Reiber, J. H. C. (1999). Quantification<br />
in cardiac MRI. J. Magn. Reson. Imaging<br />
10:602–608.<br />
Van der Geest, R. J., Niezen, R. A., van der Wall, E. E.,<br />
de Roos, A., Reiber, J. H. C. (1998). Automated<br />
measurement of volume flow in the ascending<br />
aorta using MR velocity maps: evaluation of inter<strong>and</strong><br />
intraobserver variability in healthy volunteers.<br />
J. Comput. Assist. Tomogr. 22:904–911.<br />
Van Dijk, P. (1984). Direct cardiac NCMR imaging of<br />
heart wall <strong>and</strong> blood flow velocity. J. Comput.<br />
Assist. Tomogr. 8:429–436.<br />
Van Rossum, A. C., Visser, F. C., Van Eenige, M. J.,<br />
Valk, J., Roos, J. P. (1987). Oblique views in<br />
magnetic resonance imaging of the heart by combined<br />
axial rotations. Acta Radiol. 28:497–503.<br />
Wigström, L., Ebbers, T., Fyrenius, A., Karlsson, M.,<br />
Engvall, J., Wranne, B., Bolger, A. F. (1999).<br />
Particle trace visualization of intracardiac flow<br />
using time-resolved 3D phase contrast MRI.<br />
Magn. Reson. Med. 41:793–799.<br />
Submitted May 8, 2003<br />
Accepted March 22, 2004