Prepayable NHA MBS - Securitization.Net
Prepayable NHA MBS - Securitization.Net
Prepayable NHA MBS - Securitization.Net

You also want an ePaper? Increase the reach of your titles
YUMPU automatically turns print PDFs into web optimized ePapers that Google loves.
10<br />
13<br />
16<br />
19<br />
22<br />
25<br />
28<br />
31<br />
34<br />
37<br />
40<br />
43<br />
46<br />
49<br />
52<br />
55<br />
For this study,<br />
we have<br />
eliminated<br />
pools with<br />
economically<br />
motivated<br />
refinancings in<br />
order to<br />
examine core<br />
prepayment<br />
patterns<br />
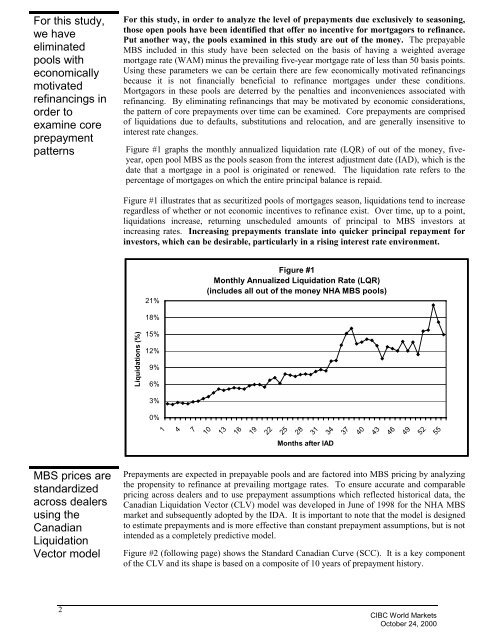
For this study, in order to analyze the level of prepayments due exclusively to seasoning,<br />
those open pools have been identified that offer no incentive for mortgagors to refinance.<br />
Put another way, the pools examined in this study are out of the money. The prepayable<br />
<strong>MBS</strong> included in this study have been selected on the basis of having a weighted average<br />
mortgage rate (WAM) minus the prevailing five-year mortgage rate of less than 50 basis points.<br />
Using these parameters we can be certain there are few economically motivated refinancings<br />
because it is not financially beneficial to refinance mortgages under these conditions.<br />
Mortgagors in these pools are deterred by the penalties and inconveniences associated with<br />
refinancing. By eliminating refinancings that may be motivated by economic considerations,<br />
the pattern of core prepayments over time can be examined. Core prepayments are comprised<br />
of liquidations due to defaults, substitutions and relocation, and are generally insensitive to<br />
interest rate changes.<br />
Figure #1 graphs the monthly annualized liquidation rate (LQR) of out of the money, fiveyear,<br />
open pool <strong>MBS</strong> as the pools season from the interest adjustment date (IAD), which is the<br />
date that a mortgage in a pool is originated or renewed. The liquidation rate refers to the<br />
percentage of mortgages on which the entire principal balance is repaid.<br />
Figure #1 illustrates that as securitized pools of mortgages season, liquidations tend to increase<br />
regardless of whether or not economic incentives to refinance exist. Over time, up to a point,<br />
liquidations increase, returning unscheduled amounts of principal to <strong>MBS</strong> investors at<br />
increasing rates. Increasing prepayments translate into quicker principal repayment for<br />
investors, which can be desirable, particularly in a rising interest rate environment.<br />
21%<br />
Figure #1<br />
Monthly Annualized Liquidation Rate (LQR)<br />
(includes all out of the money <strong>NHA</strong> <strong>MBS</strong> pools)<br />
18%<br />
Liquidations (%)<br />
15%<br />
12%<br />
9%<br />
6%<br />
3%<br />
0%<br />
1<br />
4<br />
7<br />
Months after IAD<br />
<strong>MBS</strong> prices are<br />
standardized<br />
across dealers<br />
using the<br />
Canadian<br />
Liquidation<br />
Vector model<br />
Prepayments are expected in prepayable pools and are factored into <strong>MBS</strong> pricing by analyzing<br />
the propensity to refinance at prevailing mortgage rates. To ensure accurate and comparable<br />
pricing across dealers and to use prepayment assumptions which reflected historical data, the<br />
Canadian Liquidation Vector (CLV) model was developed in June of 1998 for the <strong>NHA</strong> <strong>MBS</strong><br />
market and subsequently adopted by the IDA. It is important to note that the model is designed<br />
to estimate prepayments and is more effective than constant prepayment assumptions, but is not<br />
intended as a completely predictive model.<br />
Figure #2 (following page) shows the Standard Canadian Curve (SCC). It is a key component<br />
of the CLV and its shape is based on a composite of 10 years of prepayment history.<br />
2<br />
CIBC World Markets<br />
October 24, 2000